Anyone who's done a search for Azure DevOps has seen how easy it is to develop and deploy software using Azure. There's great documentation available and tutorials for getting started abound. Unfortunately, these resources only get you started and don't cover sophisticated applications or the configuration necessary for real-world applications. There's a DevOps process to be implemented, and you have to know the right configuration elements to use in order to light up the Azure DevOps family of products and make it shine. In this article, you will acquire the skills to:
- Organize your code in a manner compatible with DevOps
- Configure each of the five Azure DevOps products professionally
- Automate your pipeline for insanely short cycle times
- Design your process in order to build quality into each stage
Additional Azure related articles: Microsoft Azure CODE articles
Moving Through the Quickstarts
Even before Azure DevOps Services, Visual Studio Team Services (VSTS) made it very easy to start leveraging DevOps methods such as continuous integration and continuous delivery. Almost three years ago, I published an article in CODE Magazine showing how to easy it was to configure continuous delivery in the Microsoft ecosystem. See the article here: https://www.codemag.com/article/1603061/DevOps-and-Continuous-Delivery-Made-for-a-Cloud-World
Since then, Visual Studio Team Services, now Azure DevOps Services, has emerged as the state-of-the-art environment for creating and operating a DevOps environment for a custom software team. In addition to these capabilities, Azure and Visual Studio provide some tooling to move software into Azure in a matter of minutes. These Quickstarts are well-documented and easy to set up, but for real-world software, these methods quickly break down. In this section, I'll quickly cover the options for dipping your toe into DevOps with Azure. If you'd like to follow the environment you'll be exploring more closely, you can access and fork the public Azure DevOps project at https://dev.azure.com/clearmeasurelabs/Onion-DevOps-Architecture.
Azure DevOps Services has emerged as the state-of-the-art environment for creating and operating a DevOps environment for a custom software team.
Initial Setup of Azure DevOps Services
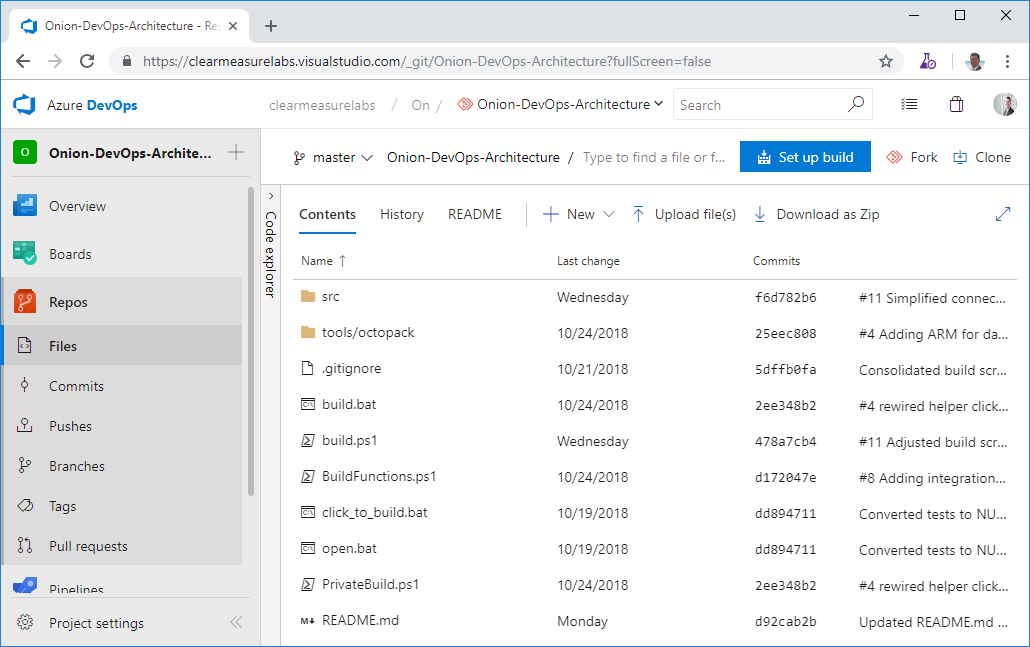
Once a Git source-control repository is created within a new Azure DevOps project, a helper button lights up blue, reading “Set up Build.” See Figure 1 for how a repository displays before any build is configured for it.
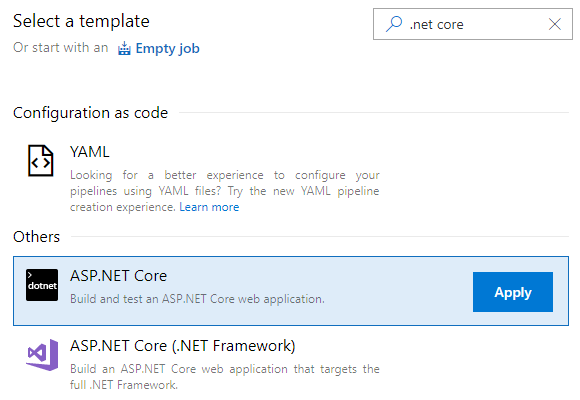
The first time through this set-up experience has some easy-to-see options. Figure 2 shows how to select the option for creating a build for ASP.NET Core.
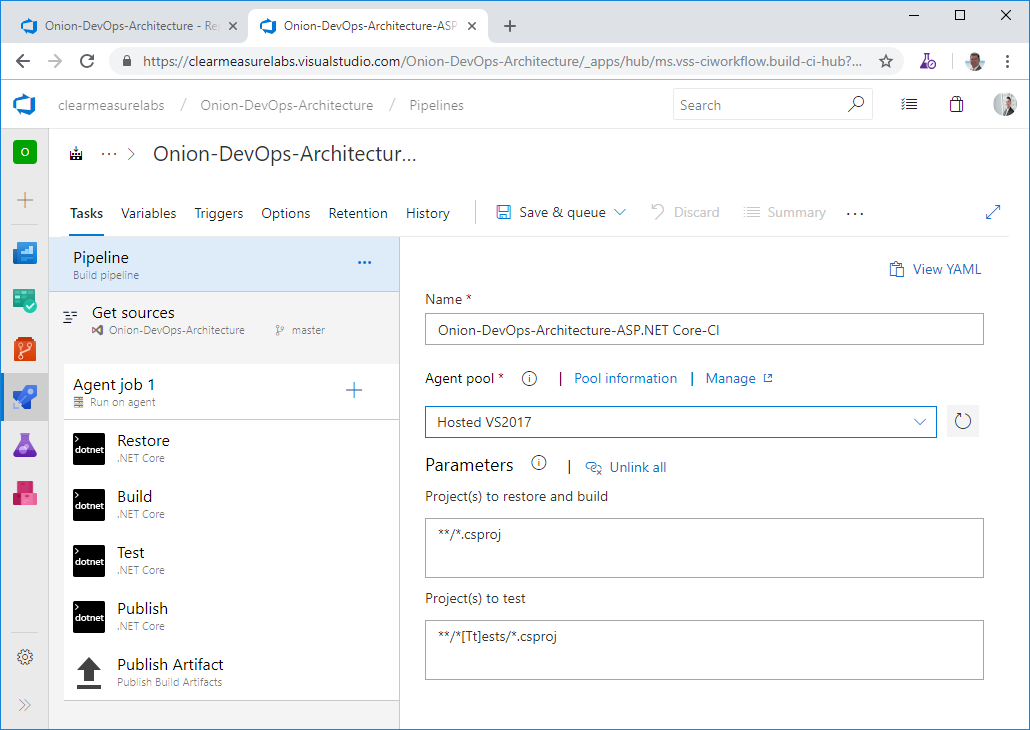
YAML (YAML Ain't Markup Language) is an option that's gaining quite a bit of traction, and it will certainly supplant the designer method of creating a build. But without an option for marketplace step discovery, you're left with the screen-based method for configuring the appropriate build steps you need. Once you apply the chosen template, you're pretty close to being able to run your first build. I'll cover some caveats later in this article regarding testing and database build considerations; you can see the basic steps in Figure 3 of Restore, Build, Test, Publish, and Publish Artifact.
In addition to this template, Azure provides some other methods to deploy directly from a GitHub repository if the architecture of your application is compatible with a file copy deployment. Further depth on the pathways to getting started quick can be found in a Microsoft eBook by Cam Soper and Scott Addie entitled "DevOps with ASP.NET Core and Azure".
Outgrowing the Quickstarts
Azure provides quite a few options for moving code from various sources into App Services. The options are currently grouped into the new Deployment Center shown in Figure 4.
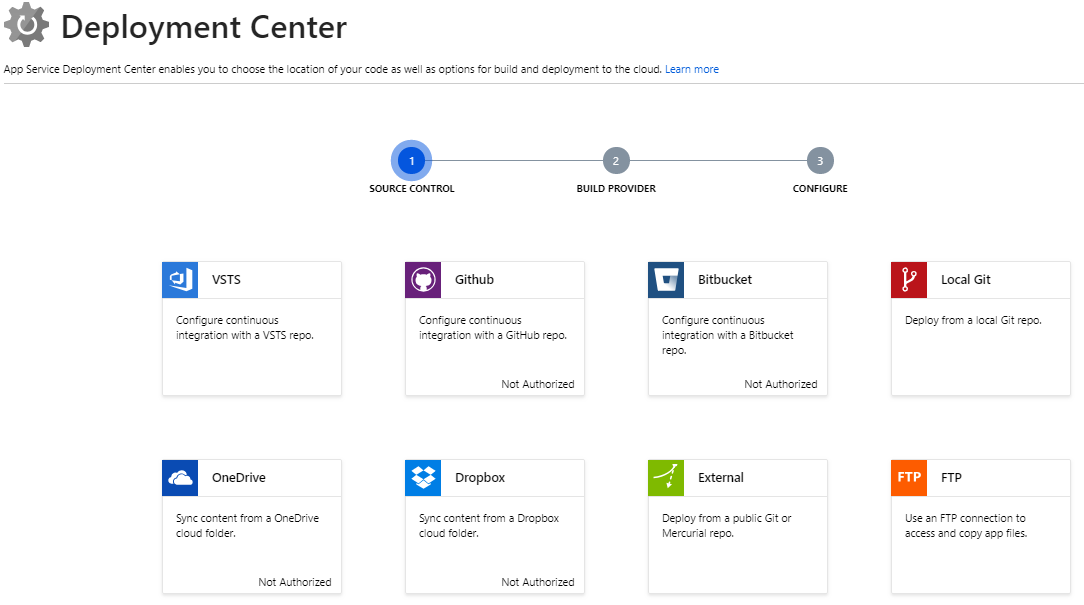
Choosing any of these sources moves you through a multi-stage wizard in order to hook things up quickly.
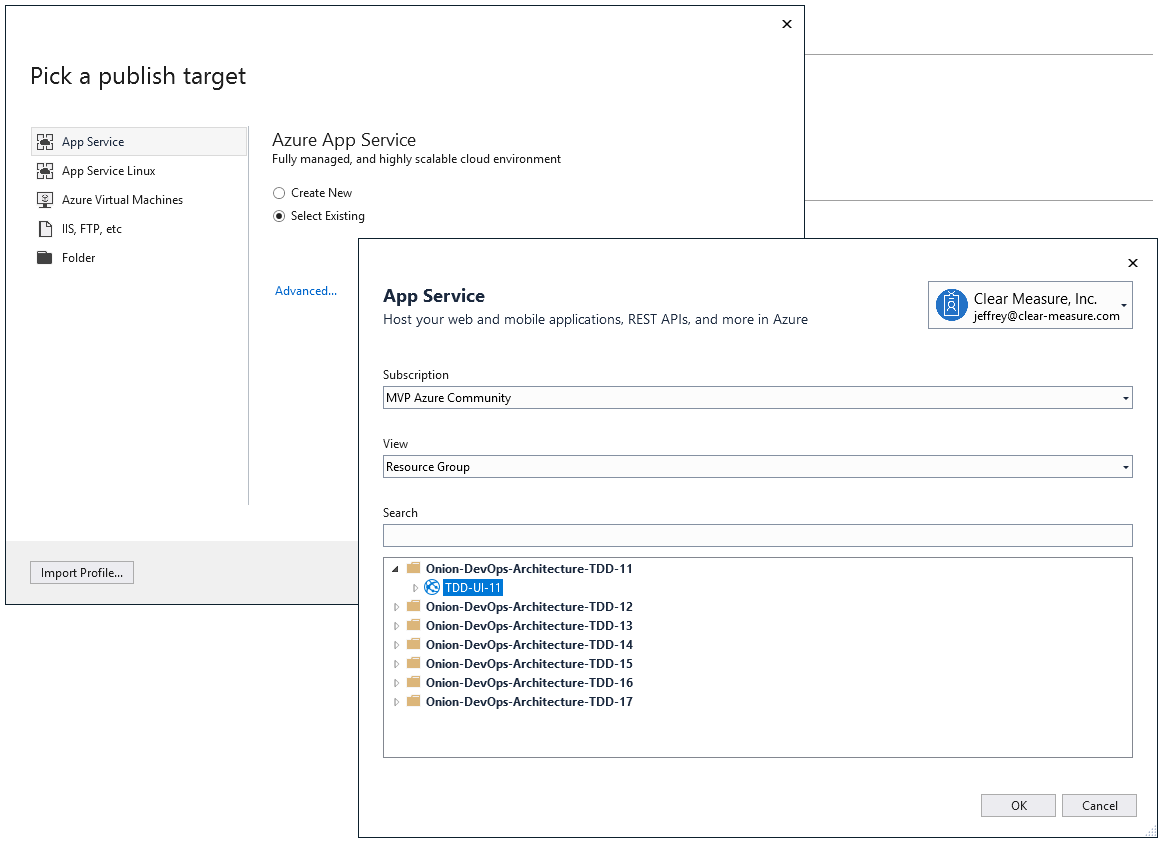
Along with these Azure Portal options, Visual Studio continues to offer a menu-based method for deploying an application into Azure. Figure 5 shows the simple screens you can use within Visual Studio. This shows the option to create new resources or redeploy over existing Azure resources.
Each of these options has some pretty immediate drawbacks after quickly prototyping a deployment or cloud computing topology. Let's dig into the ASP.NET Core build template shown in Figure 3. The next sections discuss some limitations that you must overcome on your own in order to approach a professional DevOps environment for your application. I'll take them one at a time.
Private Build
The included build the wizard's offer of guidance for a private build process. It's up to you to create a script agreed on by your team that's run locally before a commit is pushed to the team's Git repository. The purpose of the private build is to prevent the loss of 20-30 minutes if a commit causes a continuous integration build to fail. And forgetting to include a new file or other small mistakes are often the cause of a broken build. Creating a private build for yourself or your team isn't complicated, but it does include some essential steps because it's the foundation of the continuous integration build. It must contain the following steps, at a minimum:
- Clean your environment: All artifacts of previous builds should be discarded so there is a known starting point
- Compile your Visual Studio solution: Compiled them all together, all at once
- Set up any dependencies: Allows unit tests and fast integration tests to run
- Run unit tests: These tests are fast and shouldn't call out of process
- Running fast integration tests: Examples are small tests that ensure every query or ORM configuration functions properly
The purpose of the private build is to prevent the loss of a cycle if a commit causes a continuous integration build to fail.
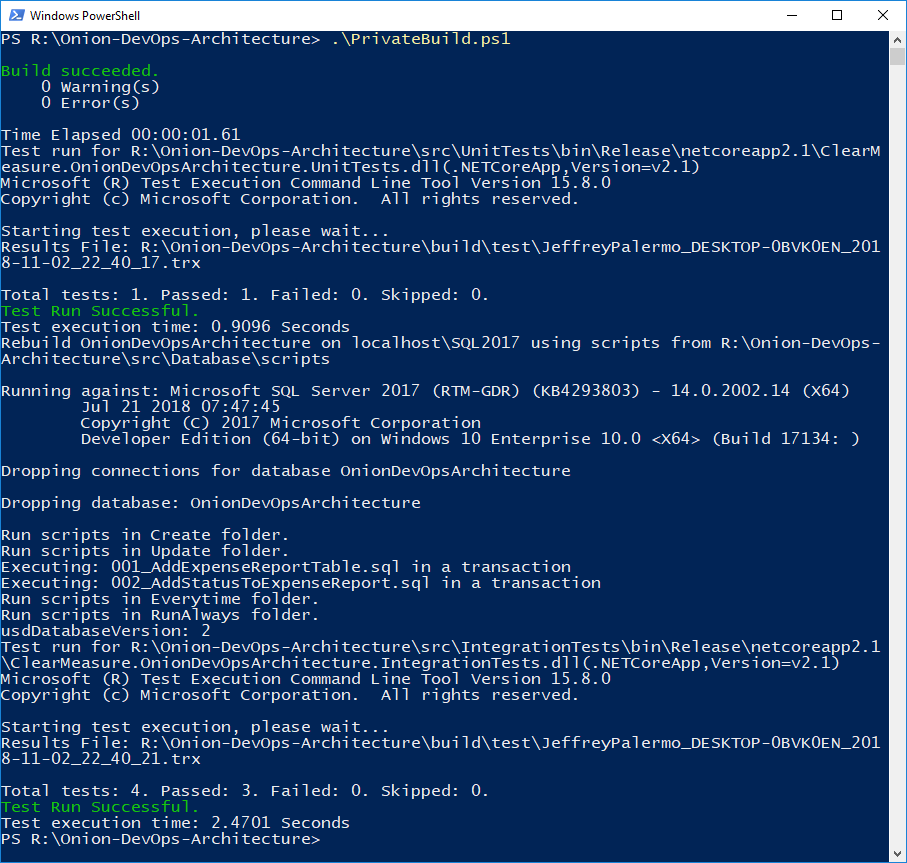
You can see the private build script used in your application at https://dev.azure.com/clearmeasurelabs/_git/Onion-DevOps-Architecture?path=%2Fbuild.ps1&version=GBmaster. Figure 6 shows the build run locally via PowerShell.
Assembly Versioning
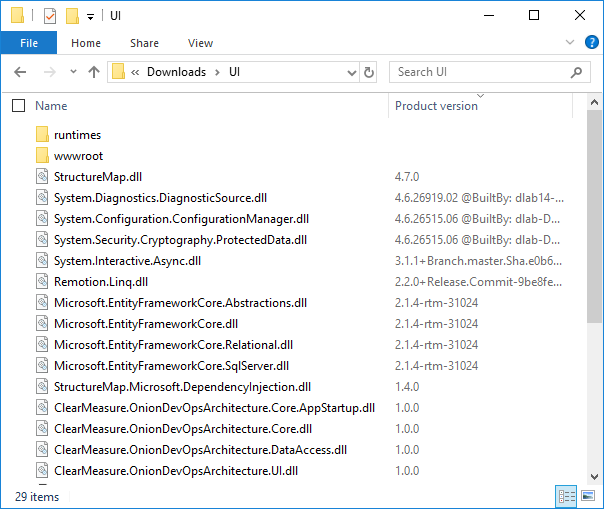
With any build process, the version number is a foundational element. If you're unsure what version of your software is running, there's no way to report bugs. A common feature in a test environment is for the bottom of the screen to show the user what version of the software is being run so that bug reports can include this information. If the packaged software doesn't include any kind of label or embedded version number, contact the manufacturer. The template in the Quickstart doesn't pass on the build's version number to the dotnet.exe command line, so there's no chance for embedding a version number. As a result, the packaged application that's stored for deployment contains the default 1.0.0 version, as shown in Figure 7.
Database Set up
In most .NET applications, SQL Server is a common storage component. In my professional work, I seldom come across a client with a .NET application that fully runs without SQL Server. Given that, you can conclude that setting up a database for use in the continuous integration build process is a normal and necessary step that must be included. Although this topic will receive more attention later in the article, your build script must include support for this, as shown in the following snippet.
Function PrivateBuild{
    Init
    Compile
    UnitTests
    MigrateDatabaseLocal
    IntegrationTest
}
Function CIBuild{
    Init
    Compile
    UnitTests
    MigrateDatabaseRemote
    IntegrationTest
    Pack
}
Build Tuning
Without adding any code, you'll see that the Quickstart build takes almost three minutes to complete. When you investigate, you'll find that you can run the same steps on your local computer in under a minute. Some of the architecture of the hosted build agents is responsible for that, and some of the structure of the build template is responsible. Regardless, you must reduce that build time.
In late 2018, I published a blog post on this very topic. Out of the box, you can see that the dotnet.exe restore step consumes almost a minute of build time. With industry guidance at a ten-minute limit, consuming 10% of available build time just gathering dependencies isn't going to work. In a few build runs, the Restore step consumed 53 and 60 seconds, respectively. Then, the dotnet.exe build command failed to pass in the –no-restore command line argument, so it wastes another 30 seconds duplicating work already done.
As you put together your own build script, be mindful of performance. Any minute that your build takes to process will be a minute of concentration that could result in a loss of team productivity. Short cycle time is critical in a professional DevOps environment.
Any minute your build takes to process is a minute of concentration that could result in a loss of team productivity.
The State of DevOps
Several organizations are performing ongoing research into the advancement of DevOps methods across the industry. Puppet and DORA are two that stand out. Microsoft has sponsored the DORA State of DevOps Report. Sam Guckenheimer is the Product Owner for all Azure DevOps products at Microsoft and contributed to the report. He also spoke about that on his recent interview with the Azure DevOps Podcast, which can be found at http://azuredevopspodcast.clear-measure.com/sam-guckenheimer-on-testing-data-collection-and-the-state-of-devops-report-episode-003.
A key finding of DORA's State of DevOps report was that elite performers take full advantage of automation. From builds to testing to deployments and even security configuration changes, elite performers have a seven times lower change failure rate and over 2,000 times faster time to recover from incidents.
Other key texts that have led the industry's definition of DevOps are a series of books, all including Jez Humble. The progression in which you should read them is:
- The Phoenix Project: A Novel about IT, DevOps, and Helping Your Business Win, by Kim, Spafford, and Behr
- Continuous Delivery: Reliable Software Releases through Build, Test, and Deployment Automation, by Farley and Humble
- The DevOps Handbook: How to Create World-Class Agility, Reliability, and Security in Technology Organizations by Kim, Humble, and Debois
If you're just getting into DevOps, don't be discouraged. The industry is still figuring out what it is too, but there are now plenty of success stories to learn from.
Removing the Ambiguity from DevOps
In the community of large enterprise software organizations, many define DevOps as development and operations coming together and working together from development through operations. This is likely the case in many organizations, but I want to propose what DevOps will likely be as you look back on this era twenty years from now from a time when your worldview isn't colored by the problems of today.
In the 1950s there were no operating systems. Therefore, there was no opportunity for multiple programs to run at the same time on a computer. There was no opportunity for one programmer to have a program that interfered with the program of another. There was no need for this notion of Operations. The human who wrote the program also loaded the program. That person also ran the program and evaluated its output.
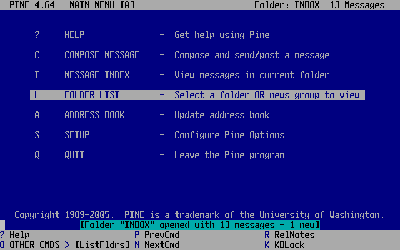
Fast-forward to the era of the terminal mainframe server. In this era, a programmer could load a program and it had the potential of causing problems for the other users of the mainframe. In this era, it became someone's job to keep the mainframe operating for the growing pool of mainframe users. Even if you've never programmed for a mainframe, you might remember using Pine for email. It was popular at universities in the 1990s. If this predates you, you can see it in Figure 8.
I believe that the DevOps movement is the correction of a software culture problem that began with the mainframe era. Because multi-user computers, soon to be called servers, were relied upon by increasing numbers of people, companies had to ensure that they remained operational. This transformed Data Processing departments into IT departments. All of the IT assets needed to run smoothly. Groups that sought to change what was running on them became known as developers, (although I still call myself a computer programmer). Those who're responsible for stable operations of the software in production environments are known as operations departments, which are filled with IT professionals, systems engineers, and so on.
I believe you're going to look back at the DevOps era and see that it's not a new thing you're creating but an undoing of a big, costly mistake that occurred over two or three decades. Instead of bringing together two departments so that they work together, you'll have eliminated these two distinct departments and will have emerged with one type of persona: the software engineer.
Smaller companies, by the way, don't identify with all the talk of development and operations working together because they never made this split in the first place. There are thousands upon thousands of software organizations that have always been responsible for operating what they build. And with the Azure cloud, any infrastructure operation becomes like electricity and telephone service, which companies have always relied on outside parties to provide.
Microsoft has already reorganized their Azure DevOps department in this fashion. There's no notion of two departments working together. They eliminated the divide by making one department staffed with two roles:
- Program manager
- Engineer
I believe this type of consolidation will happen all across the industry. Although there's always room for specialists in very narrow disciplines, software organizations will require the computer programmer to be able to perform all of the tasks necessary to deliver something they envisioned as it's built and operated.
A Professional-Grade DevOps Vision
When you look at your own organization, you're probably in the camp where you want better quality and better speed. Your form of quality may be fewer bugs. It may be fewer problems in production. It may be more uptime or better handling of user load spikes. When you think of speed, you may be thinking about developing new features. But business executives may be thinking about reducing the lead-time between when they fund a strategic initiative and when they're able to launch the software to support it. Regardless of the specific issues, it seems to always come down to quality and speed. That's when you need Capers Jones, your industry's leading software research statistician. In his recent book, Software Engineering Best Practices: Lessons from Successful Projects in the Top Companies he demonstrates research that proves two points:
- Prioritizing speed causes shortcuts, which cause defects, which cause rework, which depletes speed. Therefore, prioritizing speed achieves neither speed nor quality.
- Prioritizing quality reduces defects, which reduces rework, which directs all work capacity to the next feature. Therefore, prioritizing quality achieves speed.
You want to design a DevOps environment that squeezes out defects all along the way. You can do this by automating the repetitive tasks and taking them away from the humans. Humans aren't good at repetitive tasks. Computers are much better at such things. But humans are very good at solving problems. Computers are not good at “thinking outside the box.” The following capabilities are my vision for a professional-grade DevOps environment:
- Private build
- Continuous integration build
- Static code analysis
- Release candidate versioning and packaging
- Environment provisioning and configuration
- Minimum of a three-tier deployment pipeline
- Production diagnostics managed by development team
- Insanely short cycle time through the previous steps
You don't need an infrastructure like Netflix in order to accomplish this. In fact, you can set this up with a skeleton architecture even before you've written your first feature or screen for a new application. And you can retrofit your current software into an environment like this as well. You want to keep in mind the 80/20 rule and gain these new capabilities without adding too much scope or trying to “boil the ocean” in your first iteration.
DevOps Architecture
Let's walk through the process that a DevOps environment manages. Figure 9 shows the logical structure of a DevOps environment. The full-sized image can be downloaded from https://jeffreypalermo.com/2018/08/applying-41-architecture-blueprints-to-continuous-delivery.
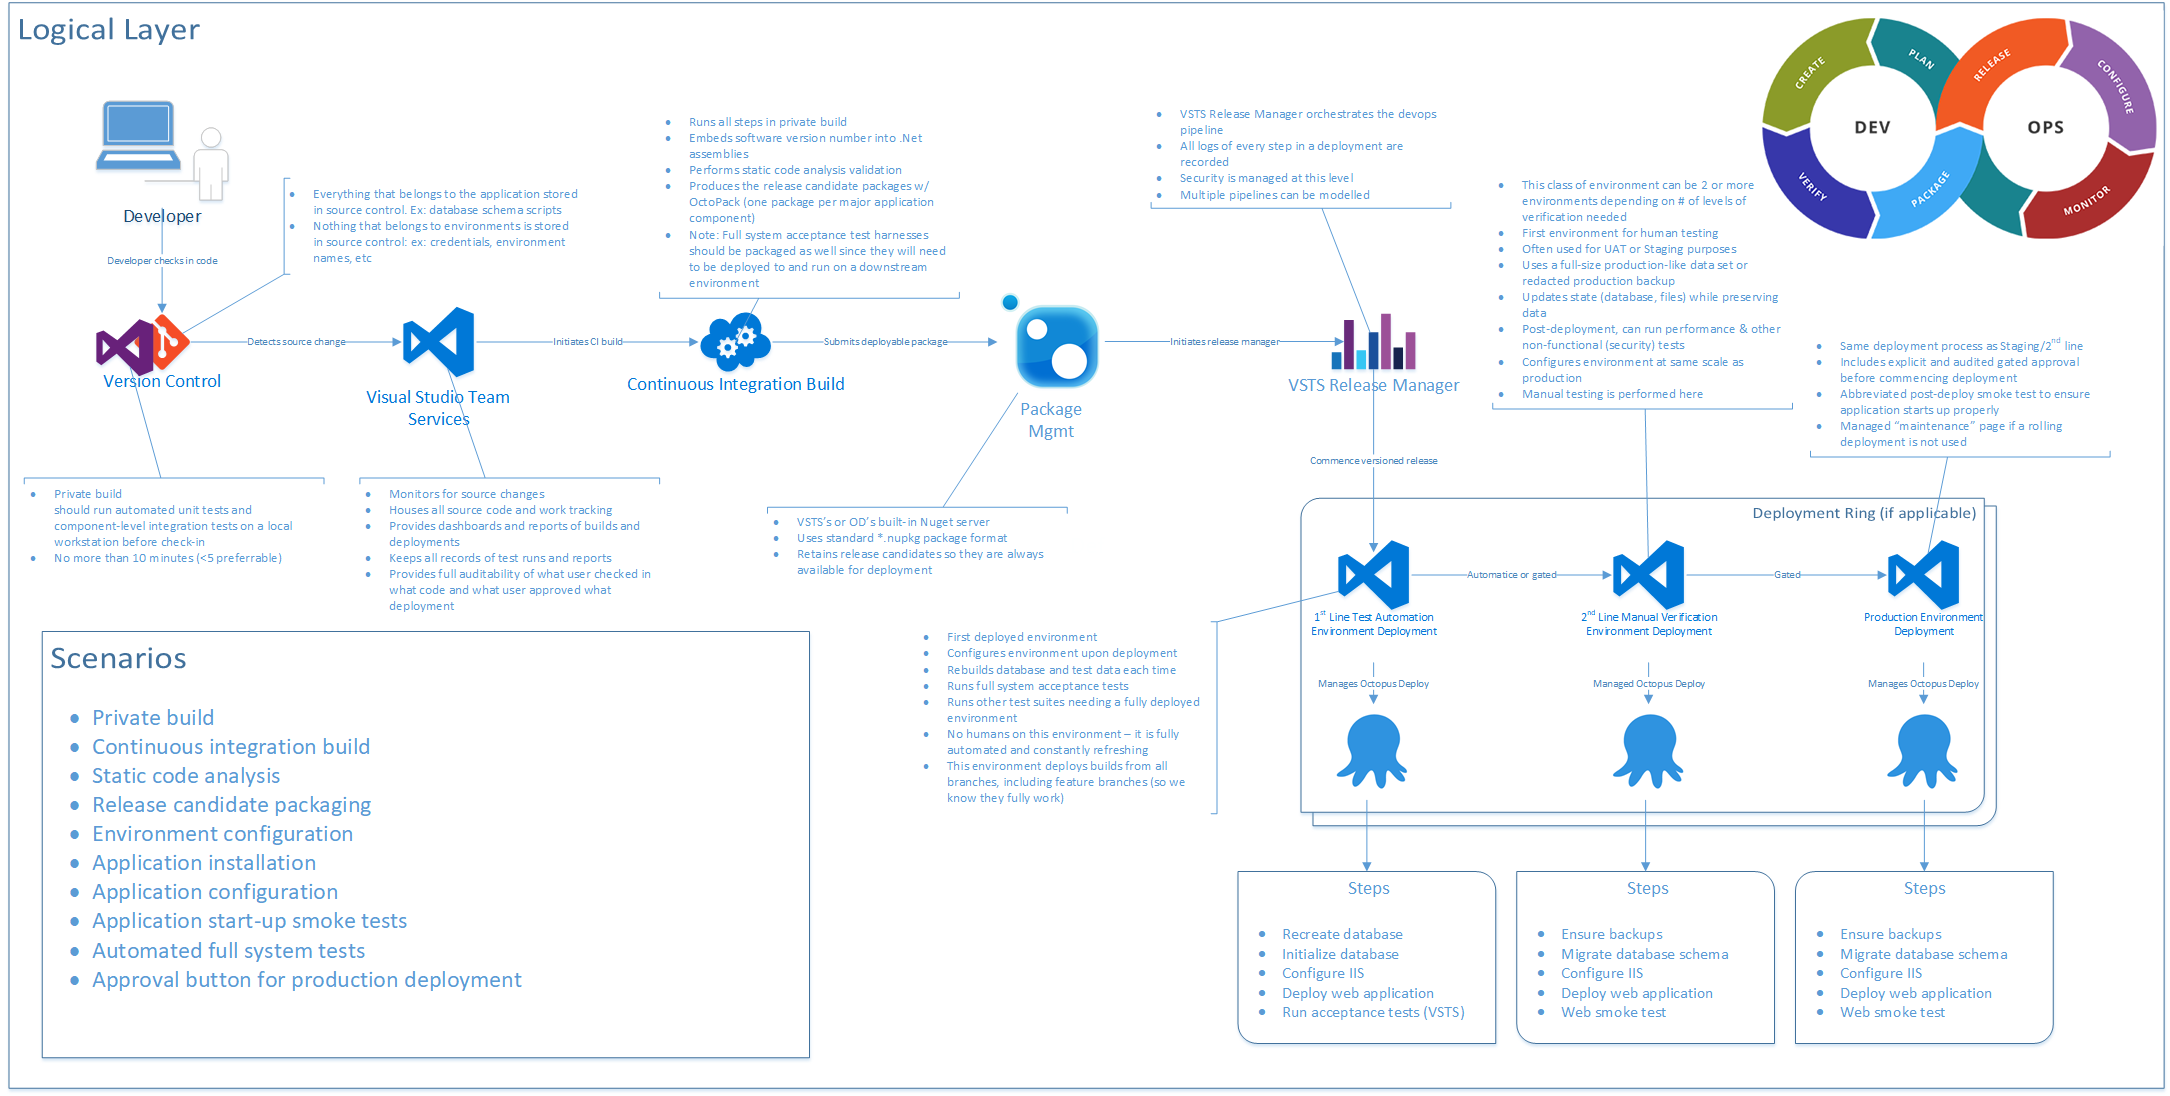
As I walk through this, I'll take the stages one at a time.
Version Control
First, you must structure your Version Control System properly. In today's world, you're using Git. Everything that belongs to the application should be stored in source control. That's the guiding principle. Database schema scripts should be there. PowerShell scripts to configure environments should go there. Documents that outline how to get started developing the application should go there. Once you embrace that principle, you'll step back and determine what exceptions might apply to your situation. For instance, because Git doesn't handle differences in binary files very well, you may elect not to store lots and lots of versions of very big Visio files. And if you move to .NET Core, where even the framework has become NuGet packages, you may elect not to store your /packages folder like you might have with .NET Framework applications. But the Git repository is the unit of versioning, so if you have to go back in time to last month, you want to ensure that everything from last month is correct when you pull it from the Git repository.
Everything that belongs to the application should be stored in source control.
Private Build
The next step to configure properly is the private build. This should run automated unit tests and component-level integration tests on a local workstation. Only if this private build works properly and passes should you commit and push your changes to the Git server. This private build is the basis of the continuous integration build, so you want it to run in as short a period of time as possible. The widely accepted industry guidance is that it should run for no more than ten minutes. For new applications that are just getting started, 45 seconds is normal and will show that you're on the right track. This time should include running two levels of automated test suites: your unit tests and component-level integration tests.
Continuous Integration Build
The continuous integration build is often abbreviated “CI Build.” This build runs all the steps in the private build, for starters. It's a separate server, away from the nuances of configuration on your local developer workstation. It runs on a server that has the team-determined configuration necessary for your software application. If it breaks at this stage, a team member knows that they need to back out their change and try again. Some teams have a standard to allow for “I forgot to commit a file” build breaks. In this case, the developer has one shot to commit again and fix the build. If this isn't achieved immediately, the commit is reverted so that the build works again. There's no downside to this because in Git, you never actually lose a commit. The developer who broke the build can check out the commit they were last working on and try again once the problem's fixed.
The continuous integration build is the first centralized quality gate. Capers Jones' research, referenced above, also concludes that three quality control techniques can reliably elevate a team's Defect Removal Efficiency (DRE) up to 95%. The three quality control techniques are testing, static code analysis, and inspections. Inspections are covered later in a discussion of pull requests, but static code analysis should be included in the continuous integration build. Plenty of options exist, and these options integrate with Azure DevOps Services very easily.
The CI build also runs as many automated tests as possible in ten minutes. Frequently, all of the unit tests and component-level integration tests can be included. These integration tests are not full-system tests but are tests and that validate the functionality of one or two components of the application that require code that calls outside of the .NET AppDomain. Examples are code that relies on round trips to the database or code that pushes data onto a queue or file system. This code that crosses an AppDomain or process boundary is orders of magnitude slower than code that keeps only to the AppDomain memory space. This type of test organization heavily impacts CI build times.
The CI build is also responsible for producing the versioned release candidate package. Whether you package your application components in NuGet packages or zip files, you need organized packaging. Each package needs to be named and numbered with the build version. Because you're only building this once, regardless of how many environments you deploy to, it's important that this package contains everything necessary to provision, configure, and install the application component on downstream environments. Note that this doesn't include credentials or environment-specific settings. Every assembly inside this package must be stamped with the build number. Make sure you use the right command-line arguments when you compile so that all produced assemblies receive the build number. The following snippet shows an example of this with parameters configured as PowerShell variables.
dotnet build $syource_dir\$projectName.sln -nologo
        --no-restore -v $verbosity -maxcpucount
        --configuration $projectConfig --no-incremental
        /p:Version=$version
Package Management
Because you're producing release candidate packages, you need a good place to store them. You could use a file system or the simple artifacts capability of Azure DevOps but using the rock-solid package management infrastructure of NuGet is the best current method for storing these. This method offers the API surface area for downstream deployments and other tools, like Octopus Deploy.
Azure DevOps Services offers a built-in NuGet server as Azure Artifacts. With your MSDN or Visual Studio Enterprise subscription, you already have the license configuration for this service, and I recommend that you use it. It allows you to use the standard *.nupkg (pronounced nup-keg) package format, which has a place for the name and a version that can be read programmatically by other tools. It also retains release candidates so they're always available for deployment. And when you need to go back in time for a hotfix deployment or reproduction of a customer issue, you always have every version.
Test-Driven Development Environment (TDD Environment)
The first of the three types of environments in a DevOps pipeline is the TDD environment. You might also call it the ATTD environment if you have adopted Acceptance Test-Driven Development. This is the environment where no humans are allowed. Once your pipeline deploys the latest release candidate, your suites of automated full-systems tests are unleashed on this environment. Some examples of full-system tests might be:
- Web UI tests using Selenium
- Long-running full-system tests that rely on queues
- ADA accessibility tests
- Load tests
- Endurance tests
- Security scanning tests
The TDD environment can be a single instance, or you can create parallel instances in order to run multiple types of test suites at the same time. This is a distinct type of environment, and builds are automatically deployed to this environment type. It's not meant for humans because it automatically destroys and recreates itself for every successive build, including the SQL Server database and other data stores. This type of environment gives you confidence that you can recreate an environment for your application at any time you need to. That confidence is a big boost when performing disaster recovery planning.
The TDD environment is a distinct type of environment, and builds are automatically deployed to this environment type.
Manual Test Environment
Manual test environments are an environment type, not a single environment. Organizations typically have many of these. QA, UAT, and Staging are all common names for this environment type, which exists for the manual verification of the release candidate. You provision and deploy to this environment automatically, but you rely on a human to check something and give a report that either the release candidate has issues or that it passed the validations.
Manual test environments are the first environment available for human testing, and if you need a Demo environment, it would be of this type. It uses a full-size production-like set of data. Note that it shouldn't use production data because doing so likely increases the risk of data breaches by exposing sensitive data to an increased pool of personnel. The size and complexity of the data should be similar in scale to production.
During deployments of this environment type, data isn't reloaded every time, and automated database schema migrations run against the existing database and preserve the data. This configuration ensures that the database deployment process will work against production when deployed there. And, because of the nature of this environment's configuration, it can be appropriate for running some non-functional test suites in the background. For instance, it can be useful to run an ongoing set of load tests on this environment as team members are doing their normal manual validation. This can create an anecdotal experience to give the humans involved a sense of whether or not the system feels sluggish from a perception point of view.
Finally, this environment type should be configured with similar scale specs as production, including monitoring and alerting. Especially in Azure, it's not quite affordable to scale up the test environment just like production because environments can be turned off on a moment's notice. The computing resources account for the vast majority of Azure costs; data sets can be preserved for pennies even while the rest of the environment is torn down.
Production Environment
Everyone's familiar with this environment type. It's the one that's received all the attention in the past. This environment uses the exact same deployment steps as the manual environment type. Obviously, you preserve all data sets and don't create them from scratch. The configuration of monitoring alert thresholds will have its own tuning, and alerts from this environment will flow through all communication channels; previous environments wouldn't have sent out “wake-up call” alerts in the middle of the night if an application component went down.
In this environment, you want to make sure that you're not doing anything new. You don't want to do anything for the first time on a release candidate. If your software requires a zero-downtime deployment, the previous environment should have also used this method so that nothing is tested for the first time in production. If an off-line job is taken down and transactions need to queue up for a while until that process is back up, a previous environment should include that scenario so that your design for that process has been proven before it runs on production. In short, the deployment to production should be completely boring if all needed capabilities have been tested in upstream environments. That's the goal.
Deployment to production should be completely boring if all needed capabilities have been tested in upstream environments.
Production Monitoring and Diagnostics
Production monitoring and diagnostics isn't an independent state but is a topic that needs to apply to all environments. Monitoring and operating your software in Azure isn't just a single topic. There's a taxonomy of methods that you need in order to prevent incidents. Recently, Eric Hexter made a presentation on this topic to the Azure DevOps User Group, and that video recording can be found at https://youtu.be/6O-17phQMJo. Eric goes through the different types of diagnostics including metrics, centralized logs, error conditions, alerts, and heartbeats.
Tools of the Professional DevOps Environment
Now that I've covered the capabilities that need to be a part of a professional DevOps environment, let's discuss how to use what Microsoft and the marketplace have to offer. Figure 10 shows the physical(runtime) environment view of this environment.
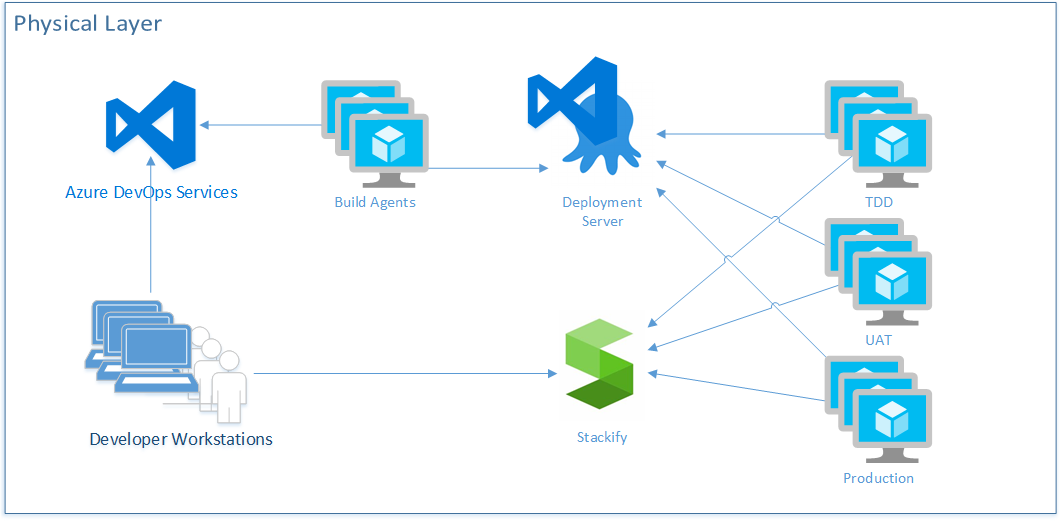
In Figure 10, you make a sample selection of marketplace tools that complement Azure DevOps Services. The Visual Studio and Azure marketplaces offer a tremendous array of capable products, and you'll want to select and integrate the ones that fit your software architecture. In this configuration, you see that Azure DevOps Services will be what developers interact with by committing code from their workstations, making changes to work items, and executing pull requests. You're specifying that you'll have your own virtual machines as build agents in order to provide more speed to the build process.
You'll also use the Release Hub in Azure DevOps in conjunction with Octopus Deploy as your deployment capability. Although Azure Pipeline is increasing its breadth of support for all kinds of deployment architectures, Octopus Deploy was the original deployment server for the .NET ecosystem, and its support is unparalleled in the industry at the moment. You show that you have deployment agents at the servers that represent each of your environments, and that they call back to the deployment server rather than having the deployment server call through the firewall directly into each server. Then you have specified Stackify as an APM tool collecting logs, telemetry, and metrics from each environment. Your developers can then access this information. Obviously, this architecture shows an environment very light on PaaS. Although new applications can easily make heavy use of PaaS, and I encourage it, most developers also have an existing system that requires a great deal of work in order to shift the architecture to free itself from VM-based environments. Professional DevOps is not only for greenfield applications. It can be applied to all applications.
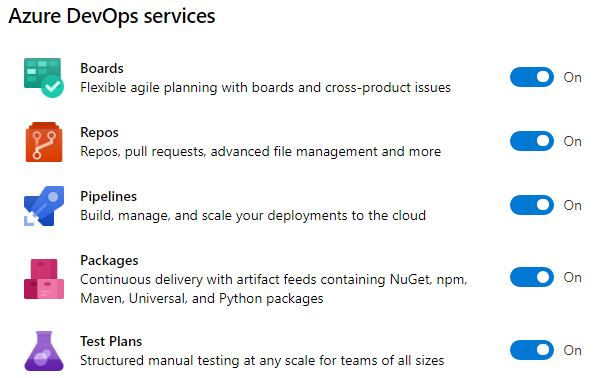
Azure DevOps Services
On September 10, 2018, Microsoft pulled the trigger on a major release that included the segmentation of its popular product, Visual Studio Team Services (VSTS). It broke VSTS into five products and has named this family of products Azure DevOps. The five new products are:
- Azure Pipelines: Supports continuous integration builds and automated deployments
- Azure Repos: Provides source code hosting for a TFVC repository and any number of Git repositories
- Azure Boards: Organizes work and project scope using a combination of backlogs, Kanban boards, and dashboards
- Azure Test Plans: Integrates tightly with Azure Boards and Azure Pipelines by providing support for automated and manual full-system testing, along with some very interesting stakeholder feedback tools
- Azure Artifacts: Provides the capability to provision your team's own package feeds using NuGet, Maven, or npm
The independent service that's been receiving lightning-fast adoption since early September is Azure Pipelines. Especially with the acquisition of GitHub, the experience to set up a build for a code-base stored in GitHub is simple and quick.
Azure Subscription
In order to set up your DevOps environment, you need an Azure subscription. Even if all your servers are in a local data center, Azure DevOps Services runs connected to your Azure subscription, even if only for billing and Azure Active Directory. Using your Visual Studio Enterprise subscription, you also have a monthly budget for trying out Azure features, so you might as well use it.
The Azure subscription is a significant boundary. If you're putting your application in Azure, you really want to think about the architecture of your subscriptions and your resource groups. There will never be only one. In fact, even if you attempt to put all your applications in a single subscription, you'll quickly find out that the subscription wasn't designed to be used that way. The subscription is a strong boundary of security, billing, and environment segmentation. Some rules of thumb when it comes to deciding on when to create a new subscription or resource group are:
- A subscription that houses the production environment of a system should not also house an environment with lesser security controls. The subscription will only be as secure as its least secure resource group and access control list.
- Pre-production environments may be grouped together in a single subscription but placed in separate resource groups.
- A single team may own and use many Azure subscriptions, but a single subscription should not be used by multiple teams.
- Resource groups should be created and destroyed rather than individual resources within a resource group.
- Just because you're in the cloud doesn't mean that you can't accidentally end up with “pet” resource groups; only create resources through the Azure Portal in your own personal subscription that you use as a temporary playground. See Pets vs. Cattle which I heard about from Jeffrey Snover.
- Resource groups are good for grouping resources that are created and destroyed together. Resources should not be created through hand-crafting. The analogy of Pets vs. Cattle can be applied to Pet Azure subscriptions where things are named and cared for by a person rather by a process or automated system.
If you're putting your application in Azure, you really want to think about the architecture of your subscriptions and your resource groups.
Visual Studio 2017
You can certainly start with Visual Studio Community, but Visual Studio Enterprise will be what you want to use in a professional DevOps environment. You'll need to do more than just write C# code. You'll need to have a holistic tool set for managing your software. As an example, the industry-leading database automation tool ReadyRoll (now SQL Change Automation) from Redgate is bundled right into Visual Studio Enterprise. This makes it a breeze to create automated database migration scripts. You'll also want to equip your IDE with some extensions from the Visual Studio marketplace. Of course, ReSharper from JetBrains is a favorite.
Configuring Azure DevOps for the Professional DevOps Environment
Now that you've looked at the capabilities of the professional DevOps environment and a mix of tools that can be a part of it, you'll drill down into each product within the Azure DevOps family and set it up in the proper way. You'll certainly want to customize the configuration, but your suggested configuration works great in 80% of the cases. If you've already read the book “The Phoenix Project” by Kim, Spafford, and Behr, you'll recognize the “three ways of DevOps” implemented as you read through this section. Once you have your Azure DevOps project created, take a glance at your project settings and select the products that you'd like enabled.
In Figure 11, you can see that for the purposes of this article, I have all of the products enabled. For your team, you'll want to equip them with the Visual Studio Enterprise subscription (formerly called MSDN Premium) so that they have licensing for all of the products. You'll need them.
Azure Boards Makes Work Visible
Within the first way of DevOps is the principle of “make work visible.” Azure Boards is the tool of choice for modeling the shape of your work. Azure Boards uses Work Items to track a unit of work. A work item can be of any type and has a status as well as any number of other fields you'd like. As you think about your hierarchy of work, don't immediately start creating work items using the built-in sample hierarchy. Instead, think about the work that you already do and the parent-child relationships between some of the types of work. For example, in a marketing department, the structure in Figure 12 may be appropriate.
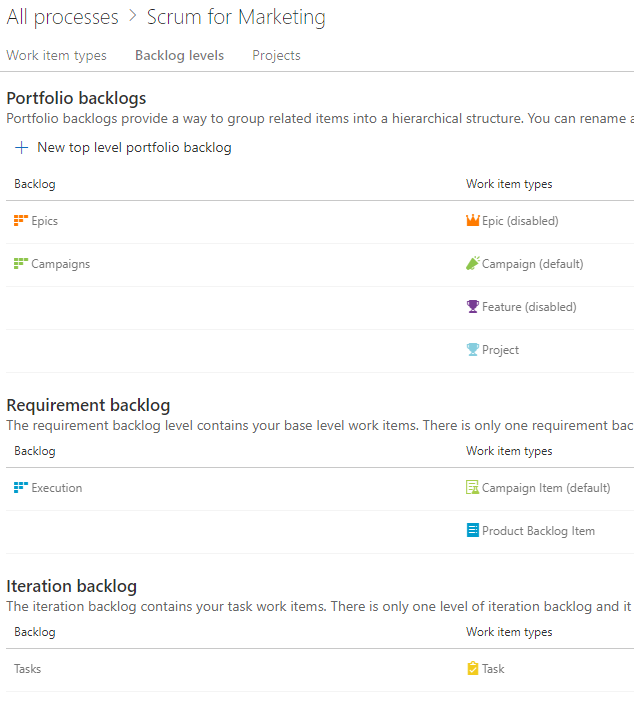
This marketing department has decided that they only need three levels of work. A Campaign can have multiple Campaign Items or Product Backlog Items. A Campaign Item and a Product Backlog Item can have multiple Tasks. At the top level, they can track at the Campaigns level or the Execution level. An individual iteration or sprint is tracked with Tasks. You can have any number of higher-level portfolio backlogs if you need higher levels of groupings. Even while the built-in process template includes Epic > Feature > Product Backlog Item, you'll quickly outgrow this because it won't match your organization. You need to disable most of the built-in work item types and create your own so that you can name them and put only the fields and the progression of statuses that make sense into your teams' environments.
You may think of several work types to get the creative juices flowing in order to capture the model of your organization's world. Notice that I didn't say “design the model.” Your model already exists. You need to capture the nouns and the verbs of your existing reality and make Azure Boards represent what's already there. If you capture the wrong model, it won't fit, and your co-workers will have a hard time tracking their work because it just won't make sense. So, consider the following types:
- Business initiatives
- Marketable features
- Plannable work to budget, schedule, and funding
- Individual tasks to get done
This becomes the foundation of your usage of Azure Boards going forward. You'd never think of starting a new application with the Northwind or AdventureWorks database schema. Those tables were chosen by someone else. That model just doesn't fit the nature of the data you're trying to store. In this same way, the schema of the built-in process templates won't fit your organization. You need to load your own model. Once you have your model, you need to specify the process of each major entity (work item). For example, if you were writing an article or a book, you might create a Chapter work item and specify the status progression on the Kanban board like that shown in Figure 13.
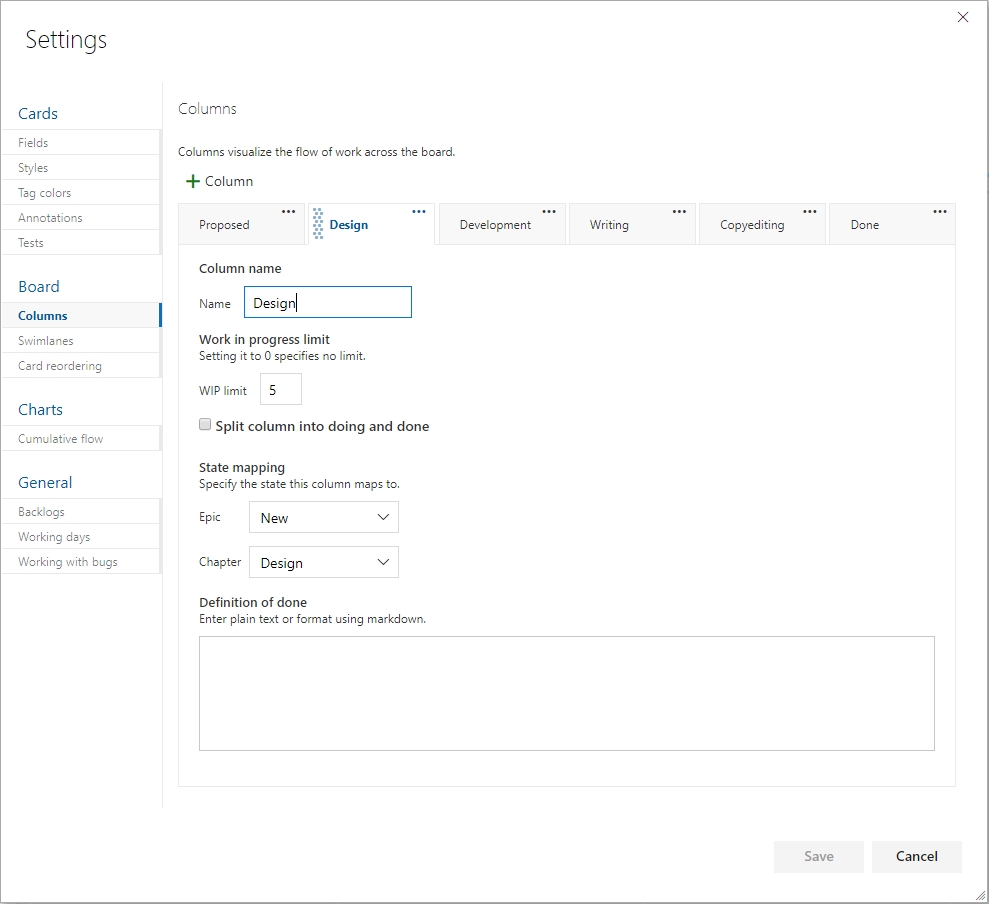
By determining ahead of time what the process is that takes a certain level of work item from creation to done, you organize your team. Each state, or board lane, should be owned by a type of role. For example, if you have a stakeholder designated as the person who'll give the go-ahead on the sketch of a screen before it's developed, that stakeholder should have a column where they own the work within it. Each work item is represented by a visual card on the Kanban board, and the cards in their column are theirs to work.
If the stakeholder does nothing, cards pile up in that column, and nothing is developed because of the bottleneck in that column. A dashboard report can bring this to light on a daily basis so that no column has too much work in it. The stakeholder's job would be to either approve the sketch of the screen or initiate a conversation to fix it. In no case would you want a bad screen to be coded. That would be worse. By creating a good number of columns, mapped to the states of the work item, you can move the work through a known process where every column has a type of role responsible for performing a known set of work and then forwarding the work in process WIP to the next column. From a quality control perspective, every person starting on work has the obligation for inspecting the WIP to see if the work is ready for them yet. If something's missing, you stop the line and get it corrected before propagating the error further downstream.
For the purposes of software teams, the level of backlog that's prepopulated with Product Backlog Items in the case of the Scrum process template, or User Stories in the case of the Agile process template, is the appropriate level for doing branches and pull requests as well as designed test cases, as you'll see a bit later in the article. Iterations or sprints can be planned with work items from this level. Then, tasks can be organically created, completed, or destroyed day by day. It's often good to make plans based on the lowest backlog level and then break those down into tasks as needed on an ad-hoc basis during the sprint.
Azure Repos Tracks All the Code
Azure Repos is the version control system in the Azure DevOps family. It supports the old TFVC format of source control and also an unlimited number of private or public Git repositories. There are import tools for migrating existing code repositories. Azure Repos not only works with Visual Studio, but it also works with any other Git client, such as TortoiseGit, which is one of my favorites.
In setting up your Git repository in the professional way, there are some principles to keep in mind. First, your team will likely have multiple repositories, unless you ship only one product. The architecture of your software will also have something to do with the granularity of your repository design. For example, if you deploy your entire system together and the architecture doesn't support deploying only a subset of the system, it's likely that you will put the entire system into a single Git repository. As an organization, you may have multiple software teams. Here are some rules of thumb for determining repository segmentation:
- One team can own multiple repositories, but one repository cannot be effectively owned by multiple teams.
- Don't use spaces in Azure DevOps project names. These spaces become %20 in the Git URL and that causes problems down the road.
- Use one branching pattern. Branch for features off the master. Don't attempt to branch only a child path.
- When importing TFVC or Subversion, don't maintain a structure where sub-repositories are designed with multiple independent applications. Break them apart. See the sidebar for more on this.
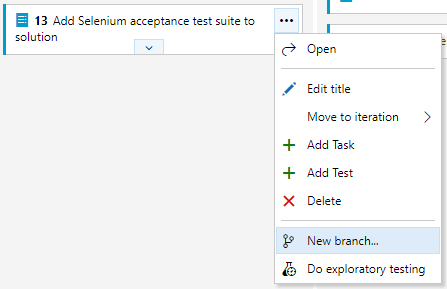
Some of the features of Azure Boards integrate very nicely with Azure Repos. Branching, commit linking, and Pull Requests work very nicely and should be used because they automate the tracking of the progress. In Figure 14, you can see how quickly you can begin a Backlog Item and start a branch from the master for work on that item.
In Figure 15, you see that your branch will be linked to the work item and initiated off master.
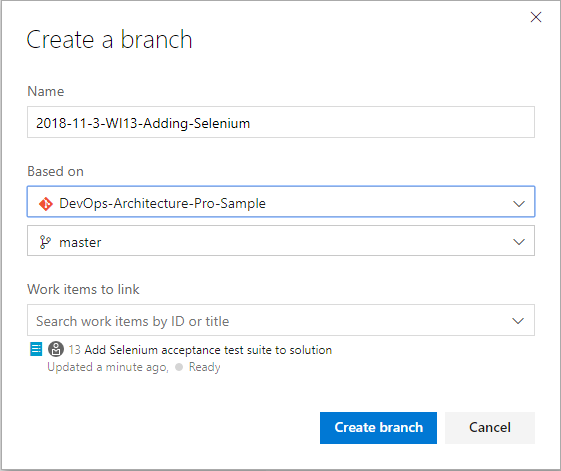
It's important that the team creates a naming convention for branches because none is provided. I suggest embedding the create date somehow as well as the work item number so that it ‘s easy to identify when viewed in a list. Old branches become stale and risky, so you don't want to keep branches around for long. Adding this information will keep that a part of the team culture.
When committing to the Git repository, add #WINUMBER to the commit message. This automatically links the commit with the work item. The User Story or Product Backlog Item is the proper level to work linking commits. As a team, agree on this level or choose another and be consistent. After the piece of work is finished, work on this branch is done, and this branch can serve as a package of code changes to be merged back to the master. Ideally, in the normal course of a day, and with a team of four engineers, several branches will be created, and several branches will be pull-requested back in. In this manner, branches are being created and destroyed daily while the number of branches that exist on a daily basis is always less than the number of team members.
As a team, agree on the level for linking commits. Be consistent.
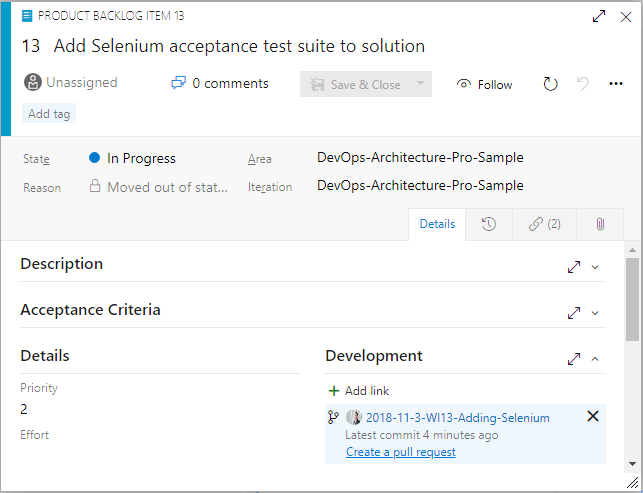
The easiest way to complete a sprint work item is to initiate the pull request from the work item itself. Even though the operation will execute within Azure Repos, the workflow on the Kanban board is more streamlined than it is from within your Git client, even if you're using the Visual Studio Team Explorer pane. Figure 16 shows where to initiate your pull request.
There's often a discussion about what to store in the application's Git repository. The short answer is “store everything.” Absolutes are never right. (Except for in the previous sentence.) However, you do store almost everything in your Git repository, including:
- Database schema migration scripts
- Azure Resource Manager (ARM)
JSONfiles - PowerShell scripts
- Tests
- Build scripts
- Images
- Content assets
- Visio architecture blueprints
- Documentation
- Dependencies, including libraries and tools
Given that there are some exceptions not to store, I'll go through a few of the items required for developing software that you don't store in your Git repository. You can see that the items on this list are already impractical to store. Although it may be technically possible to store some of these items, the pain starts to become a losing trade-off in risk.
- Windows, the obvious one
- Visual Studio or VSCode, even if it's possible to run it straight from disk
- Environment-specific data and configuration. This doesn't belong to the software; it belongs to the environment
- Secrets. They are secret, so you shouldn't know them anyway
- Large binary files that change very frequently, such as files from Autodesk products like AutoCAD and Revit
I want to address .NET Core specifically because the architecture of the .NET Framework has some fundamental differences here. With .NET Framework applications, the framework versions are installed on the computer as a component of the operating system itself. So it's obvious that you don't check it in. You check in only your libraries that your application depends on. If you need 7Zip or Log4Net, you obtain those libraries and check them into your Git repository because you depend on a particular version of them. With the advent of package managers, the debate has raged over when to not check in packages from npm or NuGet. That argument isn't settled, but for .NET Framework applications, my advice has been to check in all your dependencies, including packages.
This fundamentally changes with the architecture of .NET Core. With .NET Core, the framework isn't installed as a component of the operation system. The framework is delivered by NuGet to the computer running the build process. Furthermore, .NET Core libraries that are packaged as NuGet components have been elevated to framework status and are delivered in exactly the same way as .NET Core SDK components are. Therefore, my advice for .NET Core applications is to leave the defaults in place and don't commit the results of the dotnet.exe restore process into your Git repository. Under active development, this mix of SDK components and other NuGet packages will change quite a bit. Once the system reaches maturity and the rate of change slows, it may be appropriate to move and commit the packages folder in order to lock in that mix of dependencies given that package managers don't absolutely guarantee that the same mix of dependencies will be restored next month or next year. If you want to evaluate this for yourself and determine your risk tolerance, you can examine the packages easily by application by adding a Nuget.config file to your solution with the following configuration.
<?xml version="1.0" encoding="utf-8"?>
<configuration>
    <config>
        <add key="globalPackagesFolder"
             value=".\packages" />
    </config>
</configuration>
Before you move on from Azure Repos, you must discuss the proper structure for a Git repository. Although you may make a different pattern work for you, the following generally works for most Visual Studio applications. Figure 17 shows the top-level folder structure of an Azure Repos Git folder structure.
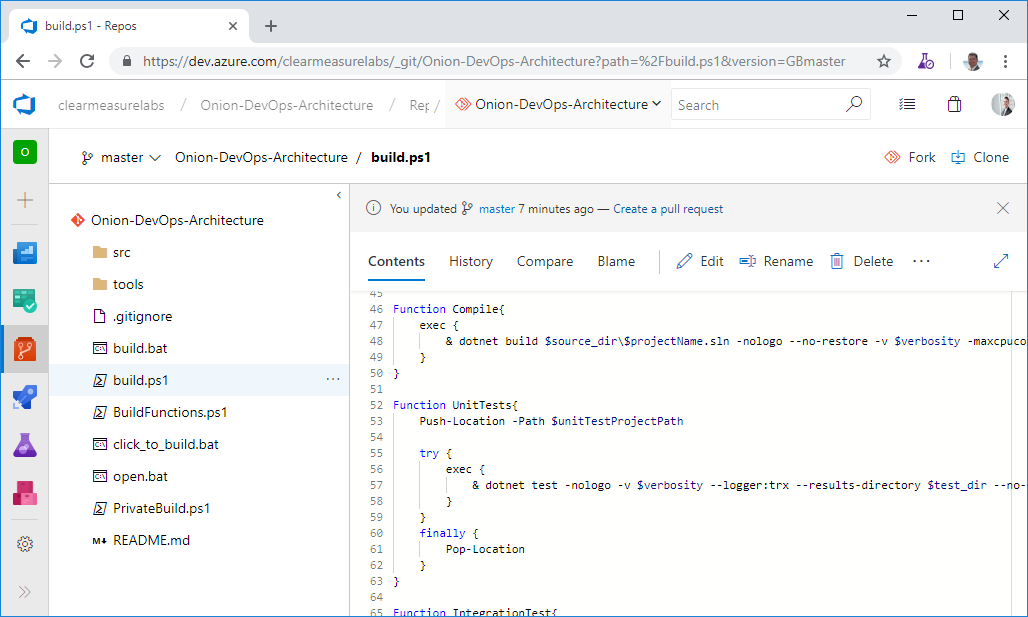
You can see some directories and some script files at the top level. Notice that you don't see a Visual Studio solution at the top level. That's intentional. Let's take the directories and files that you need in a properly organized Git repository.
- /src/: The application code is in this directory, beginning with the solution file. This is a common convention in multiple programming platforms
- /tools/: Any tools needed for the build process go in this directory. Common needs are 7Zip, Octo.exe, etc.
- /build.ps1: This is the private build script. Whether you name it this or not, you need your private build script in the top-level directory
- /click_to_build.bat: A mouse-friendly helper that adds an “& pause” to the build script so that the console window remains open for the examining of the build output
- /open.bat: A mouse-friendly helper that opens the Visual Studio solution via a double-click
- /build/: This directory is automatically created and destroyed by the build script. It shouldn't be committed to source control
Azure Pipelines Builds and Deploys the Software
Azure Pipelines are gaining wide adoption because of the compatibility and ease with which an automated continuous delivery pipeline can be set up with a software application residing anywhere. From GitHub to BitBucket to your own private Git repository, Azure Pipelines can provide the pipeline. There are four stages to continuous delivery, as described by the 2010 book, Continuous Delivery: Reliable Software Releases through Build, Test, and Deployment Automation, by Farley and Humble. These stages are:
- Commit
- Automated acceptance tests
- Manual validations
- Release
The commit stage includes the continuous integration build. The automated acceptance test stage includes your TDD environment with the test suites that represent acceptance tests. The UAT environment, or whatever name you choose, represents the deployed environment suitable for manual validations. Then, the final release stage goes to production where your marketplace provides feedback on the value you created for it. Let's look at the configuration of Azure Pipelines and see how the product supports each part of continuous delivery.
Professional Continuous Integration in the Build Hub
Earlier in the article, you saw how the Quickstart templates didn't provide the needed parts of continuous integration. Let's walk through the parts necessary to achieve continuous integration using the Build Hub of Azure Pipelines. If you'd like to follow along by cloning the code, please follow the link associated with this article on the CODE Magazine website.
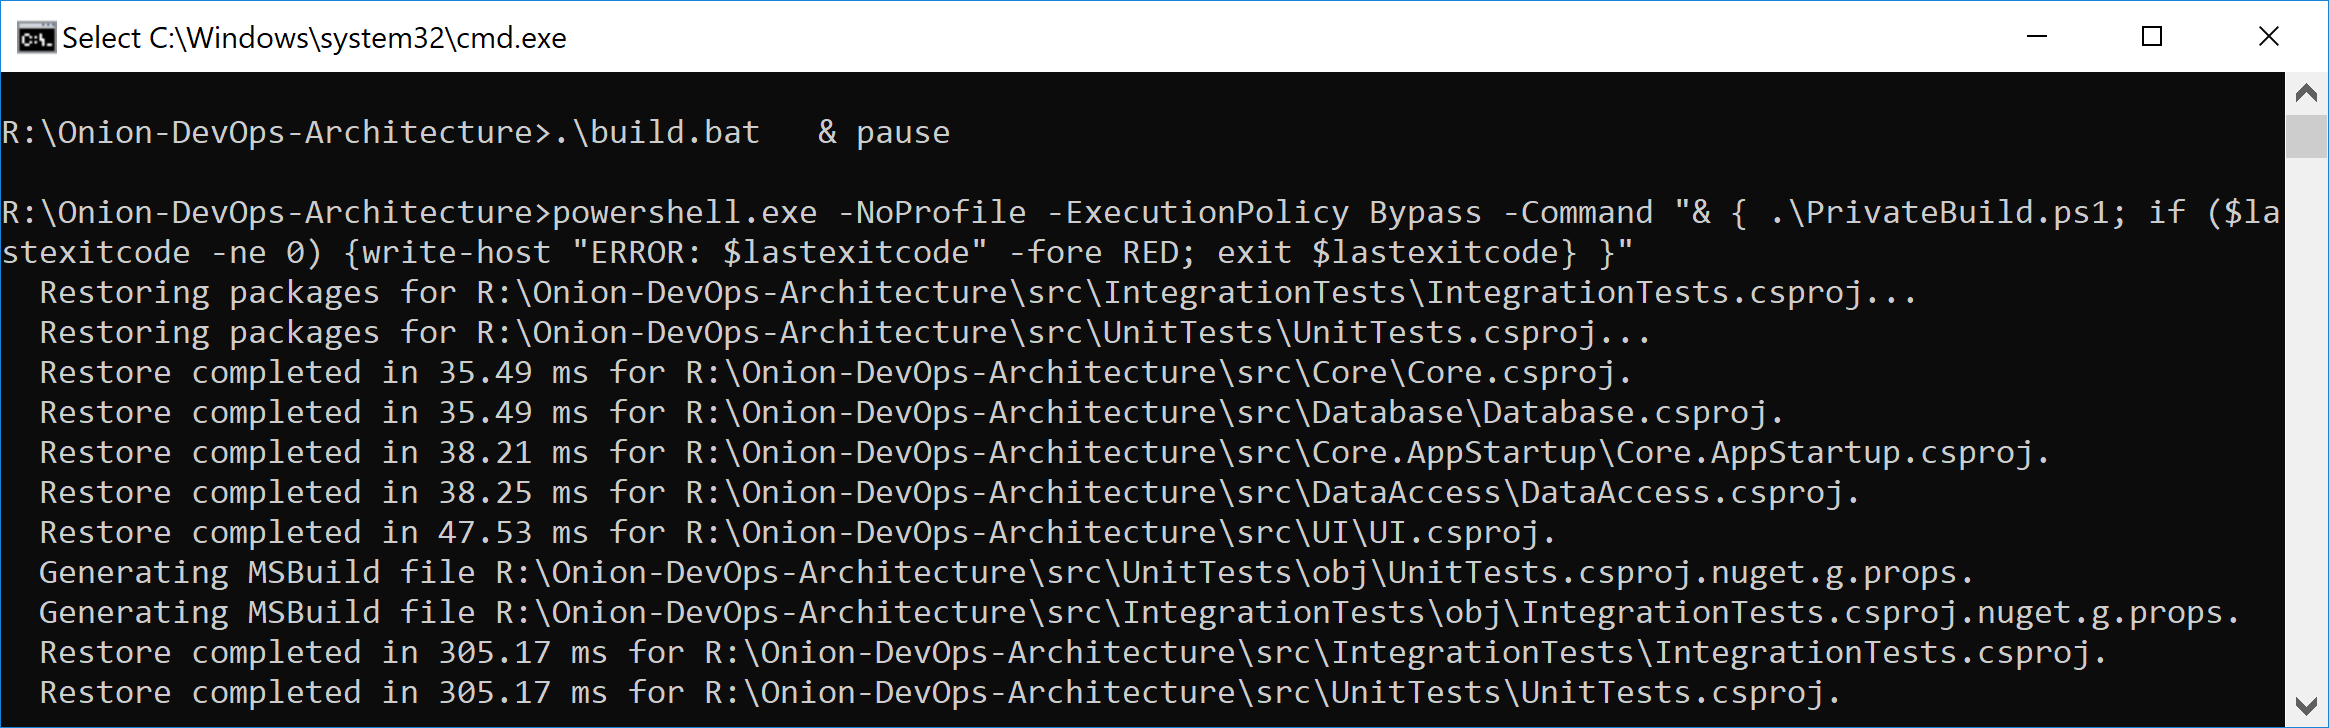
Before you create a CI build configuration in Azure Pipelines, you must have your private build. Attempting to create a CI build without this foundation is a recipe for lost time and later rework. Listing 1 shows your complete private build script. You can see that you restore, compile, create a local database, and run tests. The first time you clone the repository, you'll see quite a bit of NuGet restore activity that you won't see on subsequent builds because these packages are cached. Figure 18 shows the dotnet.exe restore output that you'll only see the first time after clicking click_to_build.bat.
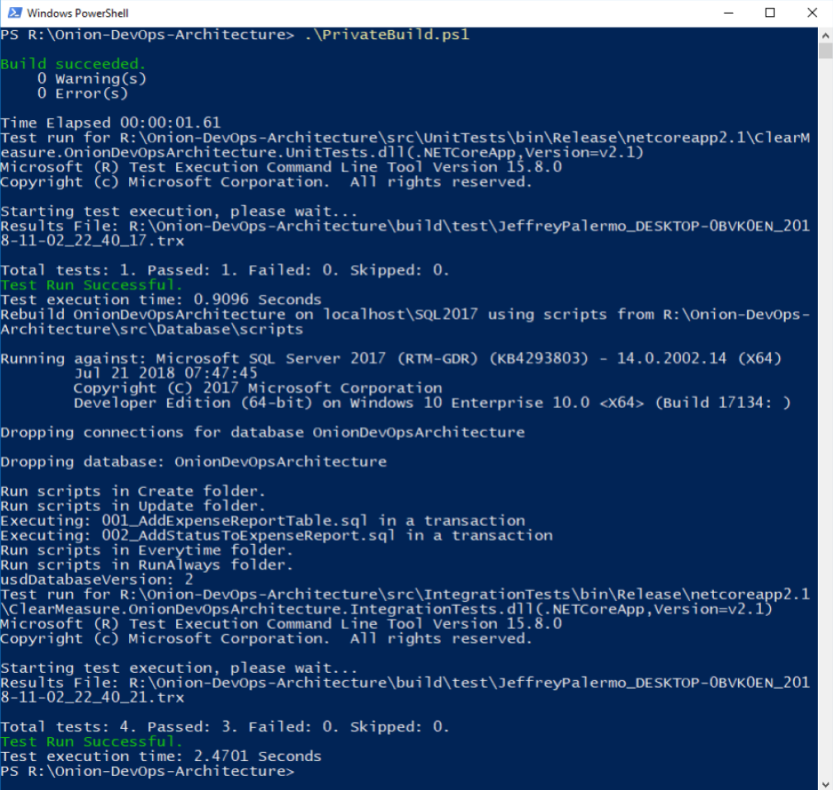
In the normal course of development, you'll run build.ps1 over and over again to make sure that every change you've made is a solid, stable step forward. You'll be using a local SQL Server instance, and the build script will destroy and recreate your local database every time you run the script. Unit tests will run against your code. Component-level integration tests will ensure that the database schema and ORM configuration work in unison to persist and hydrate objects in your domain model. Figure 19 shows the full build script executive with “quiet” verbosity level enabled.
This is a simple private build script, but it scales with you no matter how much code you add to the solution and how many tests you add to these test suites. In fact, this build script doesn't have to change even as you add table after table to your SQL Server database. This build script pattern has been tested thoroughly over the last 13 years across multiple teams, hundreds of clients, and a build server journey from CruiseControl.NET to Jenkins to TeamCity to VSTS to Azure Pipelines. Although parts and bits might change a little, use this build script to model your own. The structure is proven.
Now that you have your foundational build script, you're ready to create your Azure Pipeline CI build. As an overview, Figure 20 shows the steps you use, including pushing your release candidate packages to Azure Artifacts.
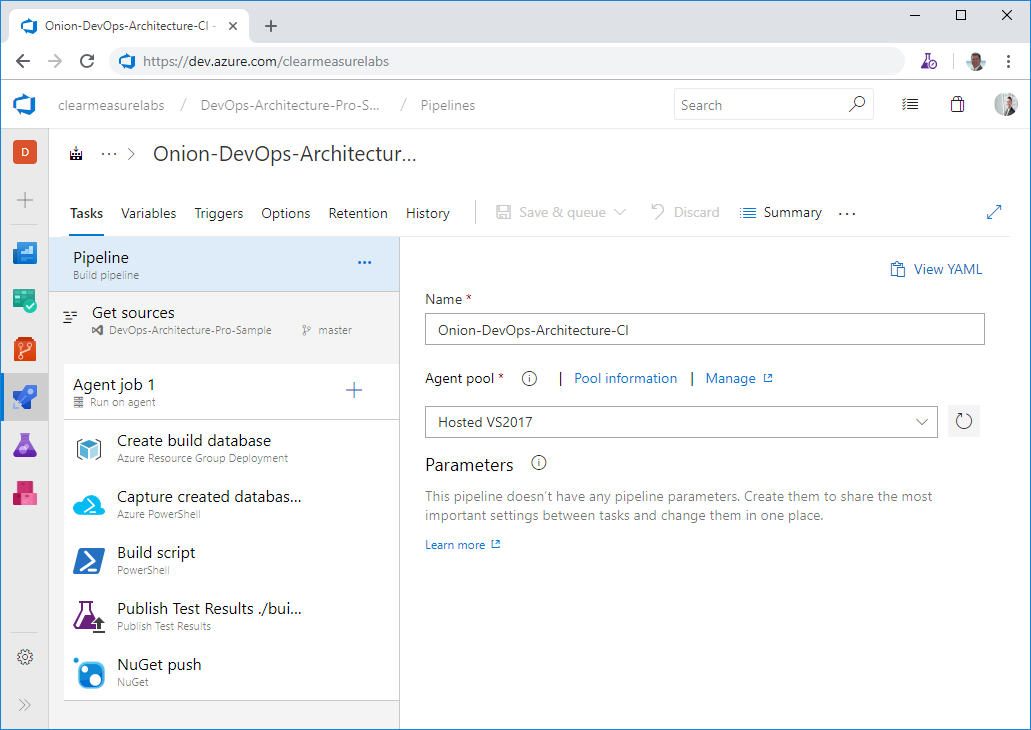
I've left the defaults that don't need to be customized, but let's go through the parts that are important. First, you'll choose your agent pool. I've chosen Hosted VS2017 because this software will be installed on the Windows kernel, so it's important that it be built with Windows as well. Next, I need to set up the environment for the execution of the PowerShell build script. This means that I need a SQL Server database. Given that the hosted build agents don't have a SQL Server installed on them, I'll need to go elsewhere for it. You can use an ARM script to provision a database in your Azure subscription so that your integration tests have the infrastructure with which to test the data access layer. I'll review where these Infrastructure as Code assets are stored in the section below, entitled Integrating DevOps Assets.
Rather than moving through many too many screenshots and figures, I've exported this build configuration to YAML, and you can see it in Listing 2. I'll highlight some of the key configuration elements that are often overlooked. After the creation of a database that can be used by the integration tests, you want to ensure that your compilation steps handle the versioning properly. After all, the purpose of this build is to create a release candidate. The candidate for release must be versioned and packaged properly and then run through a gauntlet of validations before you'd ever trust it to run in production. As you call your PowerShell build script, you call the command with the following arguments:
./build.ps1 ; CIBuild
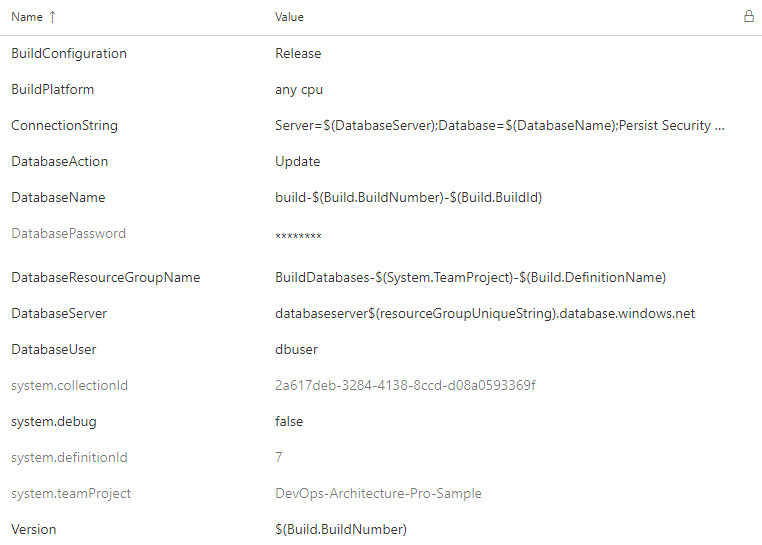
Even though there is only one explicit parameter, all of the build variables are available to any script as environment variables. Figure 21 shows the variables you have configured for this build.
Remember earlier in the article the emphasis I made on proper versioning in the build process? If you'll recall in the build script shown in Listing 1, you arrange some PowerShell variables before you begin executing the functions. The build configuration and version are captured here:
$projectConfig = $env:BuildConfiguration
$version = $env:Version
In this way, you can call dotnet.exe properly so that every DLL is labeled properly. See the command line arguments used as you compile the solution:
Function Compile{
    exec {
        & dotnet build $syource_dir\$projectName.sln
        -nologo --no-restore -v $verbosity
        -maxcpucount --configuration $projectConfig
        --no-incremental /p:Version=$version
        /p:Authors="Clear Measure"
        /p:Product="Onion DevOps Architecture"
    }
}
The build script also runs tests that output .trx files so that Azure Pipelines can show and track the results of tests as they repeatedly run over time. Finally, you push the application in its various components to Azure Artifacts as .nupkg files, which are essentially .zip files with some specific differences.
In addition to the steps of the build configuration, there are a few other options that should be changed from their defaults. The first is the build number. By default, you have the date embedded as the version number. This can certainly be the default, but to use the Semver pattern (https://semver.org/), you must change the “Build number format” to the following:
1.0.$(Rev:r).0
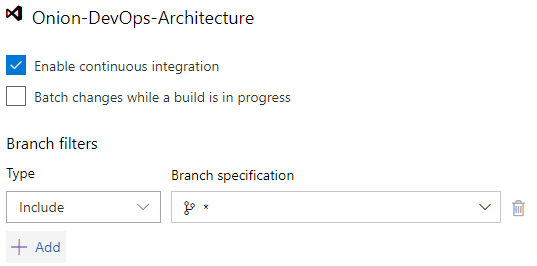
Additionally, as you enable continuous integration, you're asked what branches should be watched. The default is the master branch, but you'll want to change that to any branch. As you create a branch to develop a backlog item or user story, you'll want commits on that branch to initiate the pipeline as well. A successful build, deployment, and the full battery of automated tests will give you the confidence that it's time to put in your pull request. This setting is tricky and not quite obvious. As you click in the “Branch specification”, you'll type an asterisk * and hit the Enter key. Figure 22 shows what you should see.
A useful dashboard widget can be the Build history widget shown in Figure 23.
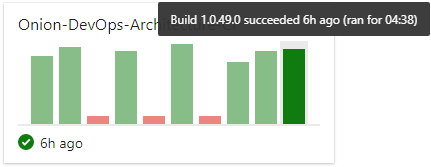
This is a simple solution, but your build time is already up to four minutes and 38 seconds. Yes, your build runs in a minute locally. This is because of the hosted build agent architecture. As soon as you have your build stable, you'll want to start tuning it. One of the first performance optimizations you can make is to attach your own build agent so that you can control the processing power as well as the levels of caching you'd like your build environment to use. Although hosted build agents will certainly improve over time, you must use private build agents in order to achieve the short cycle time necessary to move quickly. And the three minutes of overhead you incur just for the privilege of not managing a VM isn't a good trade-off at the moment.
Although hosted build agents will certainly improve next year, you must use private build agents now in order to achieve a 1- to 2-minute CI build, complete with database and tests.
Azure Artifacts Manages Release Candidates
Azure Artifacts is an independent product, but it's used in conjunction with Azure Pipelines. It's the storage service for the release candidate components produced by the continuous integration build. The application for this article has three deployable components that are built and versioned together:
- Website user interface (UI)
- Database
- Integration tests
The first two can be obvious, but you may be wondering about the integration tests. This deployable package contains test data and testing scripts that are also used to properly set up the TDD environment. You factor it into a separate deployable component because it does need to be deployed to an environment in your pipeline, but it's not a part of the actual software application that will make its way to the production environment.
Earlier, I stressed how important versioning is in a DevOps pipeline. In Figure 24, you inspect the release candidate packages.
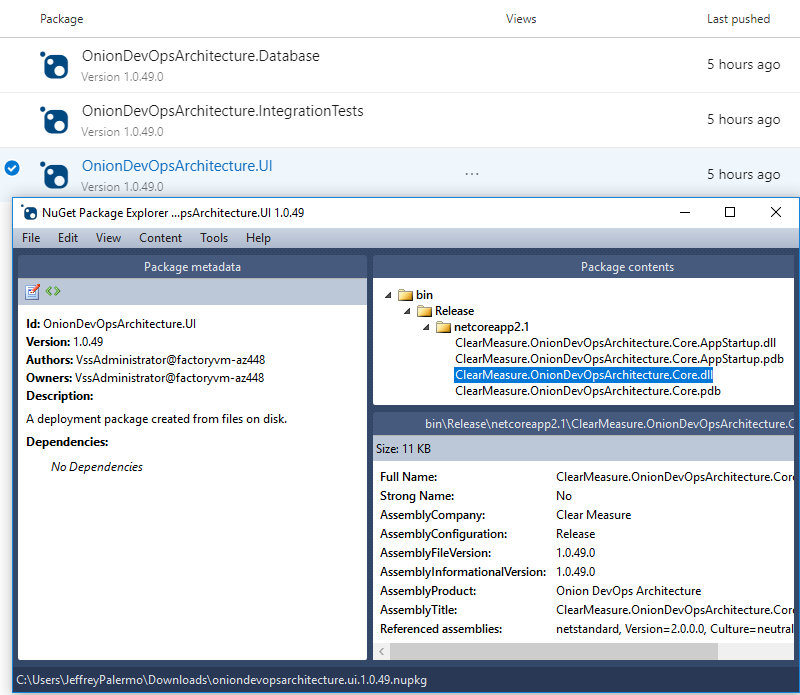
Because the proper version number is now embedded into every assembly, your code has access to it. Whether you display it at the bottom of the screen or include it with diagnostics telemetry or logs, you'll use the version number to know whether a problem or bug was on an old version or the current one. Without the version number, you fly blind. Don't try to use date and time stamps to decipher what build you're working with. Explicitly push the version number into every asset.
Explicitly push the version number into every asset.
Professional Automated Deployments with the Release Hub
Now that you've properly packaged release candidates, you can use the Release Hub of Azure Pipelines to model your environment pipeline and configure deployments. You can define multiple deployment pipelines that use a single build as a source of release candidates. In this example, you're targeting Azure PaaS services for the runtime environment of your application. As the builds are released to your deployment pipeline, you'll see something similar to Figure 25.
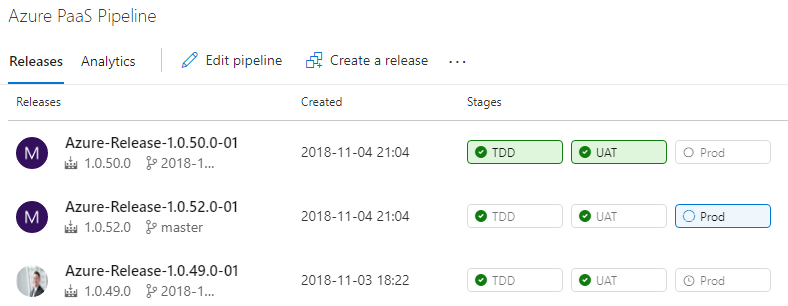
Earlier in this article, I discussed the three distinct types of environments in a DevOps pipeline. In your organization, you may need multiple instances of one or more of the environment types, but in the application here, you have one environment per type for demonstration purposes. Figure 26 shows the environments configured in a series.
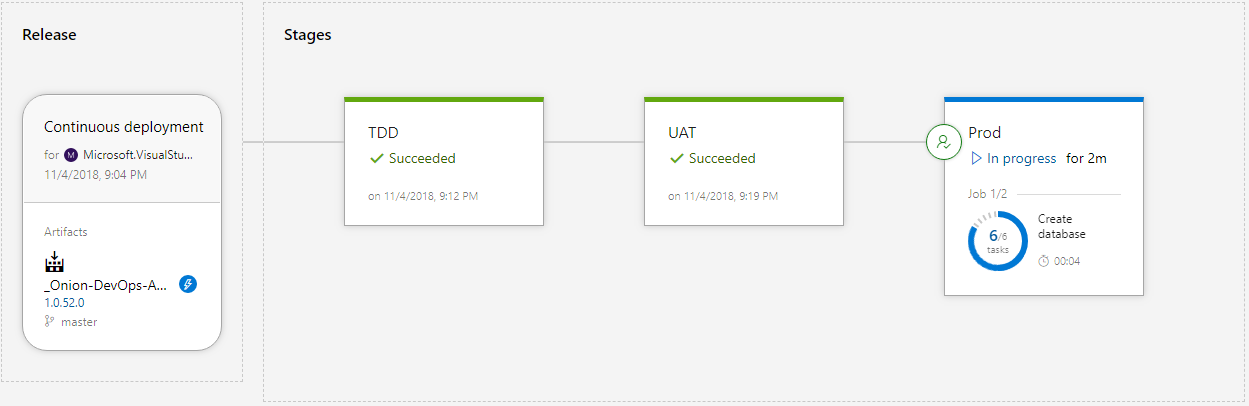
The source of the release configuration is a continuous integration build. The version number of the release inherits the build number. In most cases, you'll configure your environments in series, starting with the TDD environment, then UAT, then Production. Your names may be different. The software is built and packaged exactly once, and the release candidate, in the form of NuGet packages, is deployed to each successive environment. Let's see how to configure the Release Hub.
The source of the release configuration is a continuous integration build. The version number of the release inherits the build number.
Figure 27 shows how to enable builds to trigger a release.
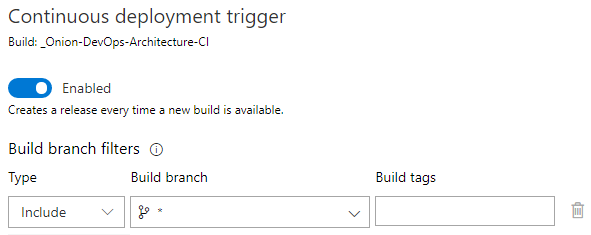
It's important to configure the Build branch for every branch. If you don't, your feature branch builds won't trigger a release, and you won't be able to use your full-system test suites to validate these builds before executing your pull request.
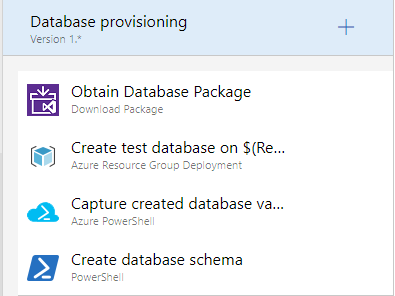
When you edit the deployment process for an environment, you'll want to make sure that the steps are the same from environment to environment. The best way to do this is to structure the deployment steps like you would a PowerShell script. That is, you factor the steps into functions that are called Task groups. Figure 28 shows the deployment process for your environments.
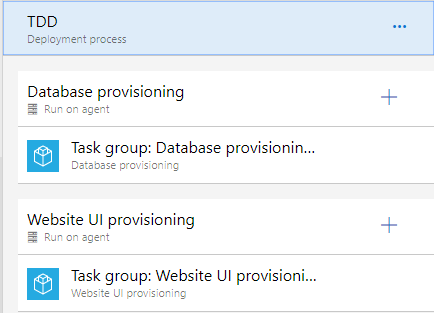
You use task groups so that you don't violate the DRY principle (Don't Repeat Yourself) when specifying what steps should happen per environment. Because you have three environments, you don't want to copy and paste steps across environments.
When you look into the task groups for the deployment of each of your application components, you see the individual steps. Figure 29 drills down into the individual steps needed in order to deploy the database.
These same steps can run on every environment because the behavior varies by the parameters that are passed in. For instance, in your TDD environment, you want to destroy the database and recreate it from scratch. In the UAT and Production environments, you want to preserve your data. A variable dictates which of these paths is taken per environment. Figure 30 shows the full list of variables used by this release configuration.
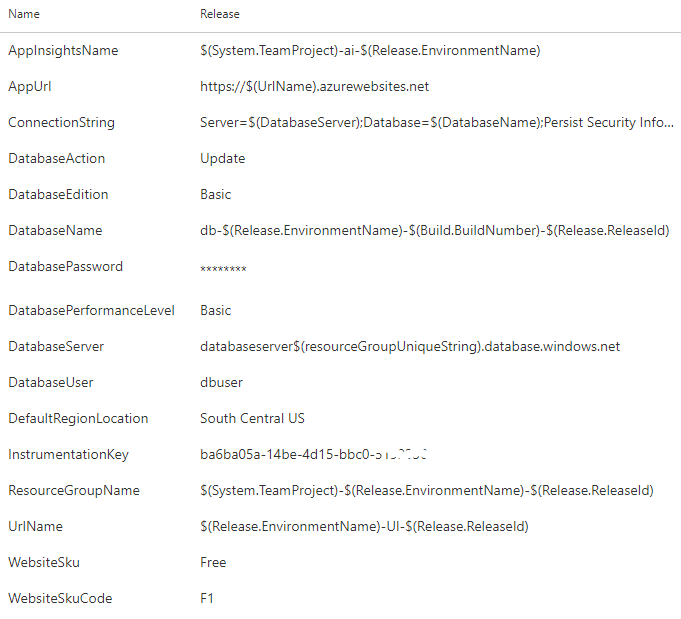
Take a critical look at the values of the variables. This is true for the build variables, and it's true for release variables as well. Some of the values are scalar values, but many of the values are templated patterns. Because you're going to be creating many releases, you need values that are going to be resilient to the repetitive nature of DevOps. You also need a variable scheme that's going to be resilient to the inherent parallelism of deploying release candidates from multiple branches, all at the same time. Because of this dynamic, you can't assume that only one release will be deploying at a time. Each of these values need to be unique, so you assemble the values based on properties of the release itself, the environment you are deploying to, and the component of the application being deployed. You'll want to have a design session with your team to determine how to dynamically build your variables.
Because you're going to be creating many releases, you need values that are going to be resilient to the repetitive nature of DevOps.
Engage Stakeholders with Azure Test Plans
In a professional DevOps environment, you have quality control steps in every stage. You don't want to pass problems downstream. When it comes to manual testing, you don't want to leave it to the end. In his book, “Out of the Crisis,” W. Edwards Deming writes, “quality cannot be inspected into a product or service; it must be built into it.” When you only test something after it has been built, you're essentially attempting to inspect what has been built and then assume that quality will be the result.
How, then, can you ensure quality? By baking a quality control step into every stage. For example, when defining the work, you can “test” the requirements or the concept or the idea by specifying the steps of a functional test. This forces you to validate that you understand what's to be built and the detailed behavior that should exist. If you can't specify exactly how you would test the feature before it's built, you'll have discovered a defect in the description or understanding of the feature. Proceeding on to code would be fruitless because the defect in the requirements or analysis would then be propagated downstream. Often, the defect is magnified by the assumptions that would have to be made in the coding process.
In this section, I won't cover all the capabilities of Azure Test Plans, but I will highlight some of the universally useful capabilities. Figure 31 shows how you can specify the test criteria for an application feature before the coding step.
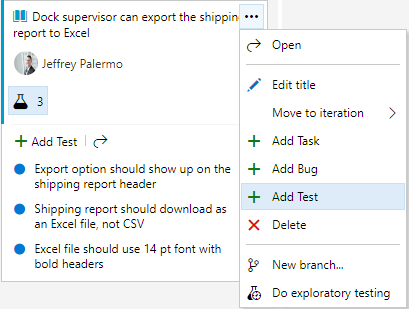
The tests for the software behavior are important pieces of information. The coding time is normally reduced when the test cases are explicitly spelled out. And the method of attaching them to the work item keeps it very simple and fast. There's no need for a cumbersome test plan document when the equivalent of bullet point items can bring clarity to the expected behavior. Additionally, many of the specified tests likely can be codified into automated test cases, so only a subset of the tests will have to be manually verified with every build.
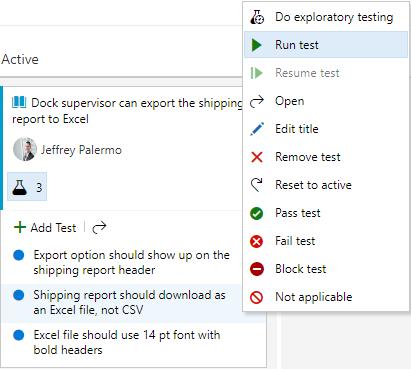
In order to run these tests, you can just use another right mouse-click. Figure 32 shows the mechanism to use to begin your manual test session.
When you run the test, Azure Test Plans is going to pop up an additional browser pane that aids you as you exercise the software. Figure 33 shows the Test Plans Runner.
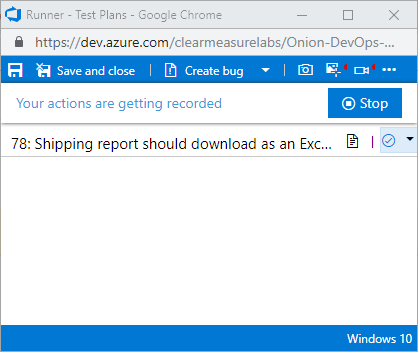
Notice the red indicator in the top right of the pane. I've selected both the video camera and the screenshot icons and enabled them. These toolbar items enable screen recording and the capturing of user actions, respectively. As I'm testing the application, Azure Test Plans is recording the screen and taking a screenshot of the area around my mouse any time I perform a click. Then, if I find anything wrong, I can create a bug right there from the toolbar and attach my user actions as well as a complete video of what I was doing. It even includes an option to record audio from my microphone if I elect to narrate my actions. This can be used to record a demo of a feature or for a stakeholder to report exactly the experience they are seeing. Figure 34 shows the test session automatically recorded.
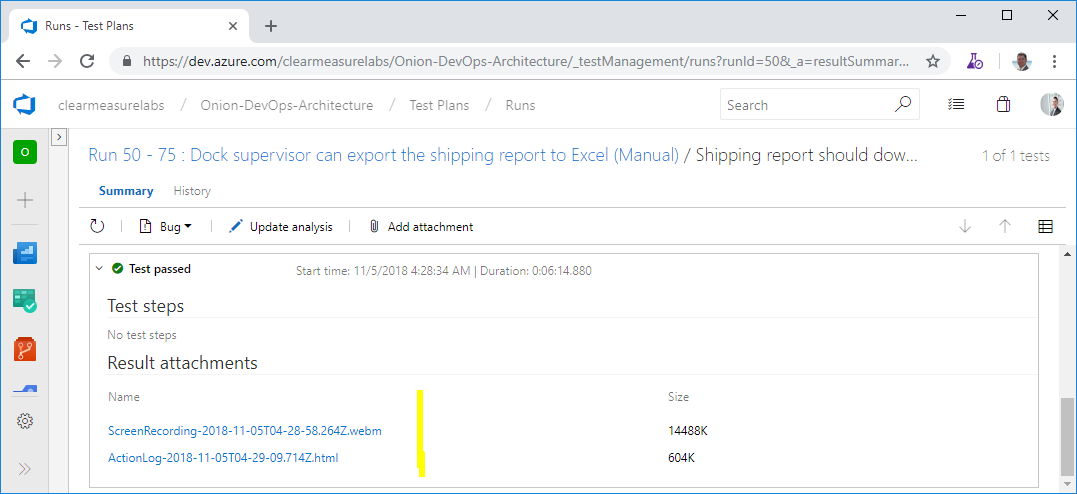
Regardless of whether or not the stakeholder records a bug, the capture of the screen and actions is recorded in Azure Test Plans. If this is habitually done, stakeholders have a very easy time providing feedback. When they encounter a bug, they don't have to go back and reproduce it. All they have to do is log it, and the reproduction steps have already been captured. The stakeholder doesn't even have to remember what he was doing.
Another option exists for exploratory testing of software application. This is done through the Test & Feedback tool, which is a Google Chrome or FireFox extension. You can install it for yourself at https://marketplace.visualstudio.com/items?itemName=ms.vss-exploratorytesting-web. Once you connect it to your Azure DevOps organization, you can click the “play” icon and start capturing your exploratory testing session. Your stakeholders should do this when they begin running the software through its paces. Figure 35 illustrates how to specify the work item that is being reviewed.
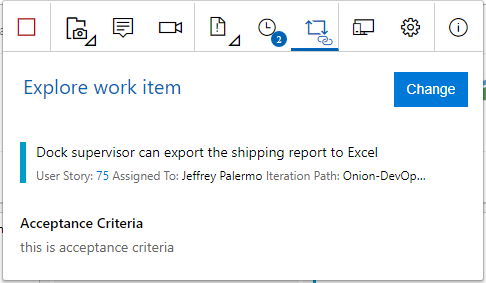
Just as in the previous workflow, a full audio and video capture runs seamlessly as the stakeholder narrates what he's doing as he moves through the application. This is especially useful to capture subjective feedback and observe the user experience even in the absence of feedback. You may have ideas on how to streamline the experience of some features just by seeing the sequence of clicks and types that a stakeholder uses in order to perform a transaction. As your stakeholders adopt the Test & Feedback tool, encourage them to use the journaling feature to write any notes that come to mind. All of this is seamlessly captured by Azure Test Plans.
Using Onion Architecture to Enable DevOps
You've seen how the Azure DevOps family of products can enable a professional DevOps environment. You have seen how to use Azure Repos to properly store the source for an application. You've made all of your work visible using Azure Boards, and you've modeled your process for tracking work and building quality into each step by designing quality control checks with every stage. You've created a quick cycle of automation using Azure Pipelines so that you have a single build deployed to any number of environments, deploying both application components as well as your database. You've packaged your release candidates using Azure Artifacts. And you've enabled your stakeholders to test the working software as well as providing exploratory feedback using Azure Test Plans.
Each of these areas has required new versioned artifacts that aren't necessary if DevOps automation isn't part of the process. For example, you have a build script. You have Azure ARM templates. You have new PowerShell scripts. Architecturally, you have to determine where these live. What owns these new artifacts?
What is Onion Architecture?
Onion Architecture is an architectural pattern I first wrote about in 2008. You can find the original writing at https://jeffreypalermo.com/2008/07/the-onion-architecture-part-1/. There are four key tenets of Onion Architecture:
- The application is built around an independent object model.
- Inner layers define interfaces. Outer layers implement interfaces.
- The direction of coupling is toward the center.
- All application core code can be compiled and run separately from the infrastructure.
Figure 36 shows an extended model of Onion Architecture that represents the pattern extended for the DevOps world.
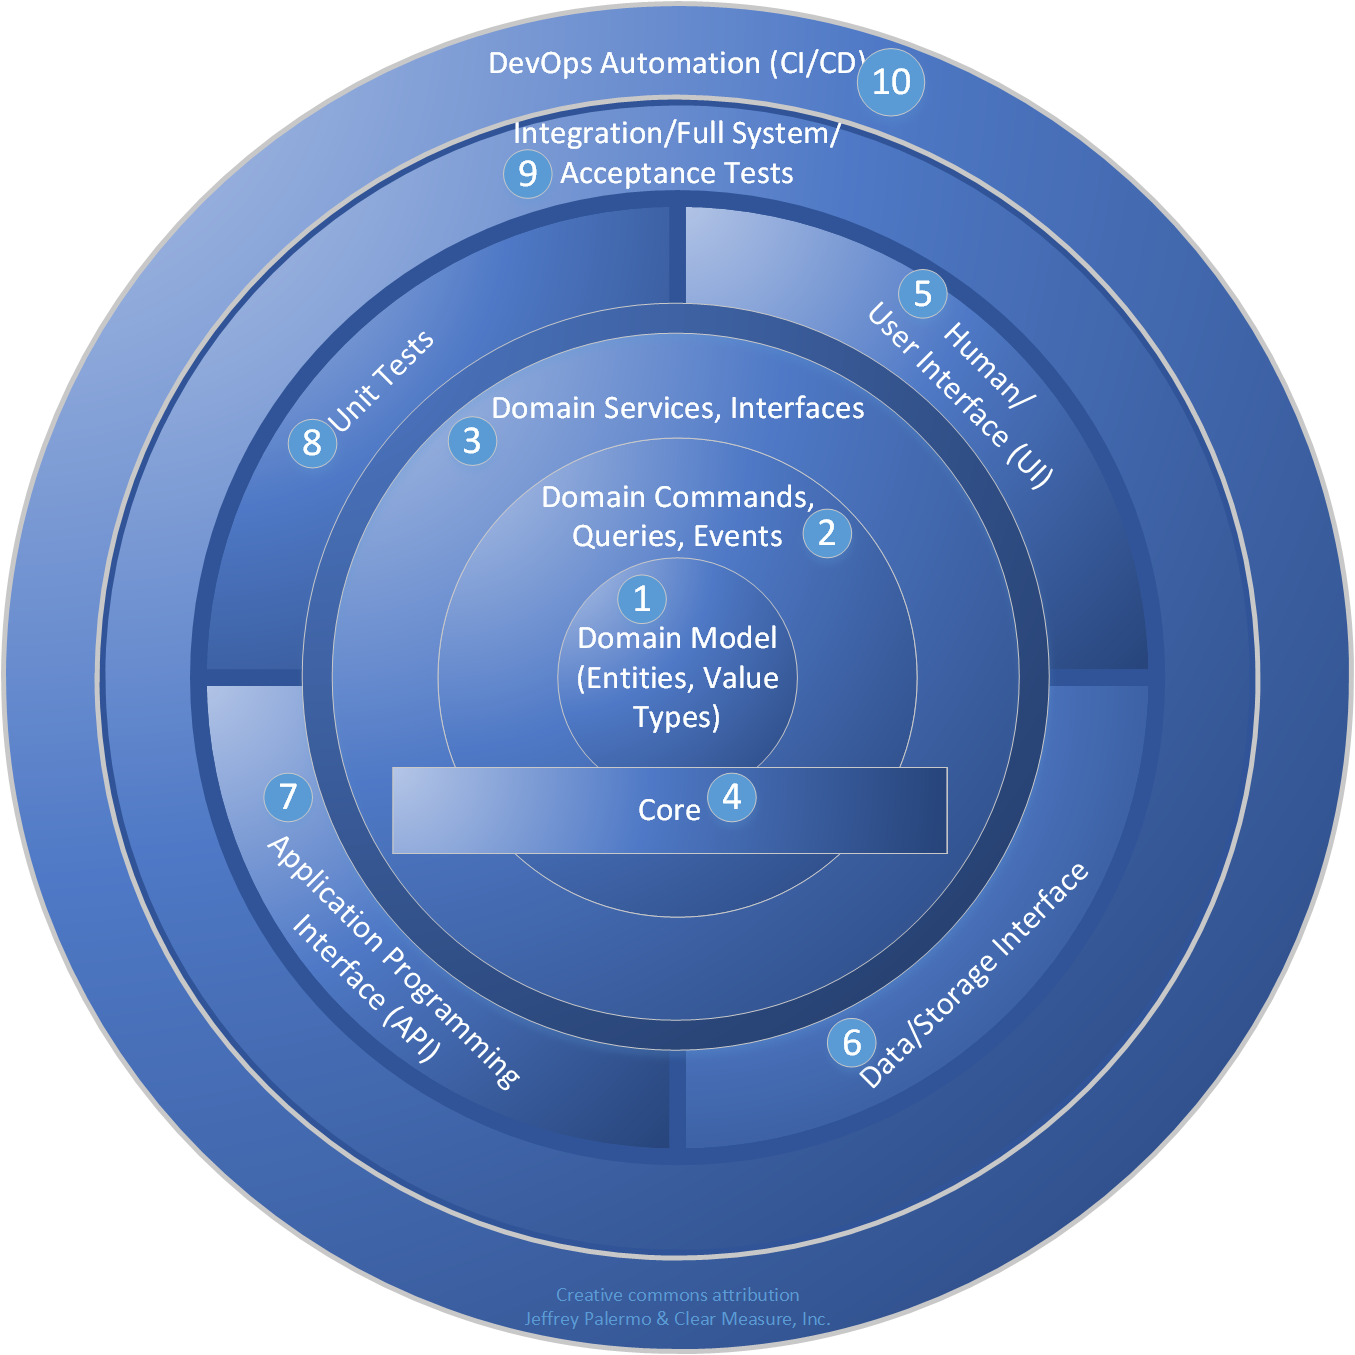
The core is familiar, with entities, value types, commands, queries, events, and domain services. The core also defines interfaces that must be fulfilled by types of infrastructure. The interfaces in the core are C# interfaces or abstract types. The parts of this model are as follows:
- Domain model objects are at the very center. They represent real things in the business world. They should be very rich and sophisticated but should be devoid of any notions of outside layers.
- Commands, queries, and events can be defined around the core domain model. These are often convenient to implement using CQRS patterns.
- Domain services and interfaces are often the edge of the core in Onion Architecture. These services and interfaces are aware of all objects and commands that the domain model supports, but they still have no notion of interfacing with humans or storage infrastructure.
- The core is the notion that most of the application should exist in a cohesive manner with no knowledge of external interfacing technologies. In Visual Studio, this is represented by a projected called “Core.” This project can grow to be quite large, but it remains entirely manageable because no references to infrastructure are allowed. Very strictly, no references to data access or user interface technology is tolerated. The core of the Onion Architecture should be perfectly usable in many different technology stacks and should be mostly portable between technology such as Web applications, Windows applications, and even Xamarin mobile apps. Because the project is free from most dependencies, it can be developed targeting .NET Standard (netstandard2.x).
- Human interfaces reside in the layer outside the core. This includes Web technology and any UI. It's a sibling layer to data access, and it can know about the layers toward the center but not code that shares its layer. That is, it can't reference data access technology. That's a violation of the Onion Architecture. More specifically, an ASP.NET MVC controller isn't allowed to directly use a DbContext in a controller action. This would require a direct reference, which is a violation of Onion Architecture.
- Data interfaces implement abstract types in the core and be injected via IoC (Inversion of Control) or a provider. Often, code in the data interfacing layer has the capability to handle a query that's defined in the Core. This code depends on SQL Server or ORM types to fulfill the needs of the query and return the appropriate objects.
- APIs are yet another interfacing technology that often require heavy framework dependencies. They call types in the core and expose that functionality to other applications that call.
- Unit tests exercise all the capabilities of the core and do so without allowing the call stack to venture out of the immediate AppDomain. Because of the dependency-free nature of the core, unit tests in Onion Architecture are very fast and cover a surprisingly high percentage of
applicationfunctionality. - Integration tests and other full-system tests can integrate multiple outer layers for the purpose of exercising the application with its dependencies fully configured. This layer of tests effectively exercises the complete application.
- DevOps automation. This code or sets of scripts knows about the application as a whole, including its test suites, and orchestrates the application code as well as routines in the test suites that are used to set up configuration or data sets for specific purposes. Code in this layer is responsible for the set up and execution of full-system tests. Full-system tests, on the other hand, know nothing of the environment in which they execute and, therefore, have to be orchestrated in order to run and produce test reports.
The above is an update on Onion Architecture and how it has fared over the past decade. The tenets have been proven, and teams all over the world have implemented it. It works well for applications in professional DevOps environments, and the model above demonstrates how DevOps assets are organized in relation to the rest of the code.
Implementing Onion Architecture in .NET Core
The Visual Studio solution that implements Onion Architecture in .NET Core looks quite similar to the structure used for .NET Framework applications. Figure 37 shows the Solution Explorer within Visual Studio.
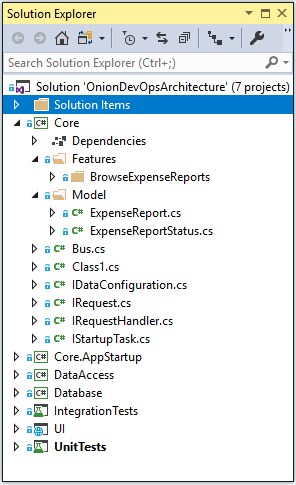
The biggest project in the Visual Studio solution should be the core project. This project will have most of your classes and most of your business logic. By strictly preventing extra framework dependencies from being referenced by this project, you keep your code safe for the long run. You prevent your business logic and domain model from becoming tangled in code specific to Web frameworks, ORMs, or reading and writing files or queue messages. All of the latter tend to change at a rapid clip. If you let your code become coupled to them, your application will have a short shelf-life. You, dear reader, have probably been exposed to an application where if they were to remove all of the user interface and data access code, there would be no code left. This is because of these dependencies are tangled together. This is called spaghetti code - a tangled mess of logic and dependencies. In sharp contrast, Figure 38 shows the direction of dependencies in your Onion Architecture implementation.
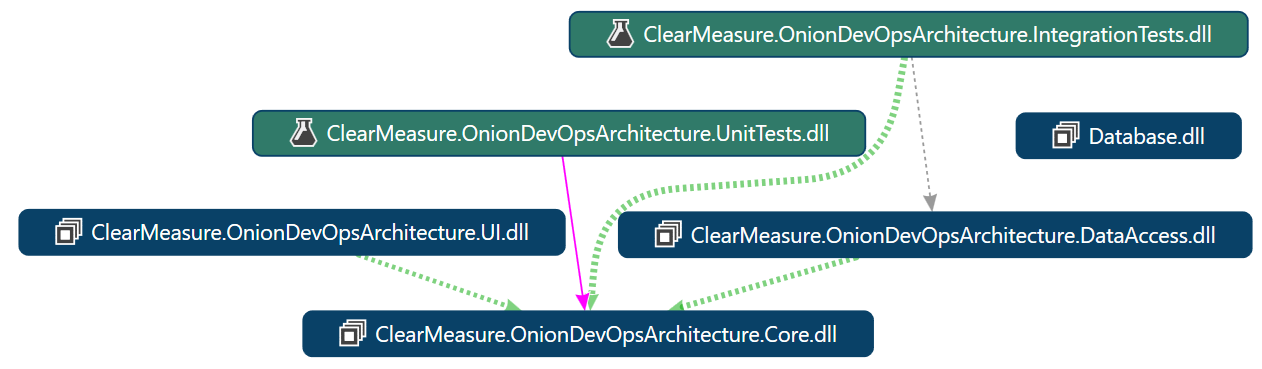
Pay special attention to the DataAccess assembly in Figure 38. Notice that it depends on the core assembly rather than the other way around. Too often, transitive dependencies encourage spaghetti code when user the access code references a domain model and the domain model directly references data access code. With this structure, there are no abstractions possible, and only the most disciplined superhuman software engineers have a chance at keeping dependencies from invading the domain model.
Integrating DevOps Assets
There are some new files that need to exist in order facilitate automated builds and deployments. These need to be versioned right along with the application. Let's discuss what they are and convenient places for them. You've already covered the build script, build.ps1. Listing 1 shows the full code for your PowerShell build script. Let's go through each new DevOps asset and the path of each:
- /build.ps1: contains your private build script
- /src/Database/DatabaseARM.json: contains the ARM template to create your SQL Server database in Azure
- /src/Database/UpdateAzureSQL.ps1: contains your automated database migrations command
- /src/Database/scripts/Update/*.sql: contains a series of database schema change scripts that run in order to produce the correct database schema on any environment
- /src/UI/YoubsiteARM.json: contains the ARM template to create your app service and website in Azure
For the full source of any of these files, you can find them at the included code link for this article on the CODE Magazine website. In a professional DevOps environment, each pre-production and production environment must be created and updated from code. These DevOps assets enable the build and environment automation necessary in a professional DevOps environment.
Conclusion
You've now seen how to progress from just getting started to assembling a professional DevOps environment. You've seen how quickly you can start using some of the advantages of Azure DevOps. You've also seen how quickly you bump into the limitations of the Quickstarts. You've explored a bit of the history of DevOps as well as a long-term vision for your DevOps environment. You moved through each product in the Azure DevOps family, and you explored how the Onion Architecture enables applications to use the DevOps structure. This article has equipped you with the method and file templates to create your own professional DevOps environment for your application, regardless of whether it's a new application or one that's over a decade old. Insist on an insanely short cycle time, with quality control steps at every stage, and you'll soon start to benefit from the quality and speed that DevOps can bring to your organization.