


All right, I'm going to get a lot of hate for this, but do you know what browser I use as my default browser? Safari. There. I said it. Not Edge, not Chrome, not Firefox. Safari. Look, I have my reasons. I'm deep into the Apple ecosystem, and I really appreciate the performance that Safari offers over any other browser. And then there are features such as keychain synch, passkeys, Apple Pay, etc., that only Safari offers.
But when it comes to debugging stuff, I despise Safari dev tools. I only use Safari dev tools when I absolutely must. The dev tools I still prefer to use are those built into the Chrome browser. And, I understand, Edge dev tools are now also quite similar. Let me put it this way; I'm happy to use either Edge or Chrome, but my muscle memory still takes me to Chrome.
In this article, I'd like to share with you some beyond-the-obvious tips and tricks when it comes to debugging HTML pages and JavaScript in Chrome.
What Are Dev Tools?
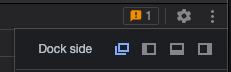
Although I want to focus on the less obvious but highly useful tips, I must get this out of the way. The main characters in this article are the dev tools, so I must introduce the main character and how to launch it. Dev tools are built into the Chrome browser. You can launch the browser and simply launch them with a short cut key (F12 on Windows or CMD_OPT_i on a Mac). Dev tools may launch either docked to a side in your browser or they can be free floating. This behavior can be toggled via the triple dot menu on the top right hand corner of dev tools, as shown in Figure 1.
As you can see, dev tools are fairly involved. They're organized into various tabs, such as Elements, Console, Sources, Network, Performance, and so much more. Within each tab, there's a specific user interface designed for that section. Each of these sections is loaded with tips and tricks. Some are obvious, like you can use the console window to run arbitrary JavaScript commands in the scope of the page. Or you can use the Network tab to record network activity.
I'll assume that you've used dev tools in the past and are generally familiar with basic usage of dev tools already, so I won't focus on a 101 introduction of dev tools in this article. My focus will be on some of the interesting arcane tricks, some of which will (hopefully) pleasantly surprise you and be a part of your dev tricks going forward. Let's get rolling.
Supercharge with the Command Menu
One of the biggest frustrations I have with the dev tools is simply how powerful they are and how many commands and possibilities they have. Seriously, don't get me wrong, you need all those facilities to do your work, but if someone wrote an end-to-end book on every feature in dev tools, they'd probably never finish the book. Sometimes I remember that there's a way to do something in command tools, but I just can't remember where that particular command was.
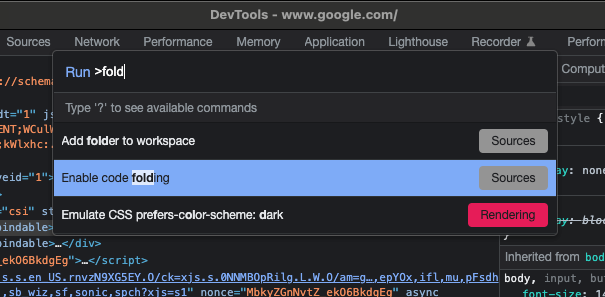
For instance, when trying to understand another coder's code, I frequently find code folding useful. I vaguely remember that there was a feature in Chrome that's off by default, to allow me to enable code folding. To be honest, I've no idea where to toggle that feature from, but I know I can easily find it using the command menu. Simply press CMD_SHIFT_P on Mac or CNTRL_SHIFT_P on Windows to show the command menu and find “Enable code folding” from there. This can be seen in Figure 2.
As soon as you enable code folding, you'll notice that all logical blocks of code shown to you can be collapsed or expanded. For instance, if you have an if/then/else statement, you can collapse the “if” part so you can focus on the “else” part. Or you can collapse a large switch statement, or function, or really any logical part of your code.
Load Any File Quickly with the Open Dialog
Modern websites are skyscrapers built with sticks, twigs, and cards stuck together with chewing gum and spit. You know that is an accurate description. There are days I'm amazed that this even works, but it does. Just visit www.google.com, for instance, go to the sources tab, and start looking at what it took to build that simple page with a textbox and an image. There are literally hundreds of files there, from all sorts of domains, with all sorts of extensions.
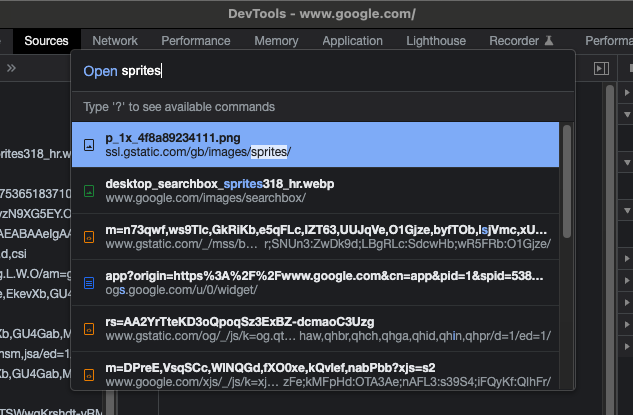
The problem this causes is finding a particular file on a large complex page can be tedious. But you can greatly simplify your task by simply hitting CMD_P on Mac or CTRL_P on Windows to launch the open dialog. This launches a VS code-like open file experience, and you can simply type the name of the file to search for what you are looking for and easily open it. This can be seen in Figure 3.
Prettify JavaScript Files
JavaScript is complex as it is, but before it's shipped to a production application, it's minified. This means that all variable names are munched up into as small names as possible, and all whitespace and return characters are removed unless absolutely necessary to keep. The end result is that the file ends up being obfuscated so your logic can't be stolen. And it's smaller, so it loads faster. And it runs faster because it's smaller and more optimized. You can pretty much assume that any production application, including yours, will use minified JavaScript.
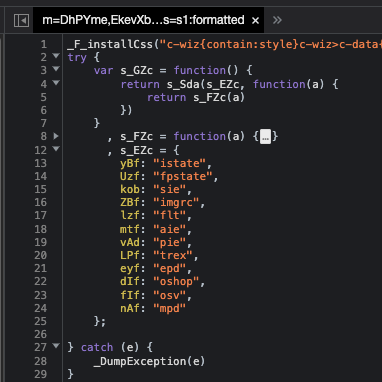
The one big disadvantage is that such files become impossible to debug. The solution is pretty simple. At the bottom of any JavaScript file, you'll find a curious looking button, as shown in Figure 4.
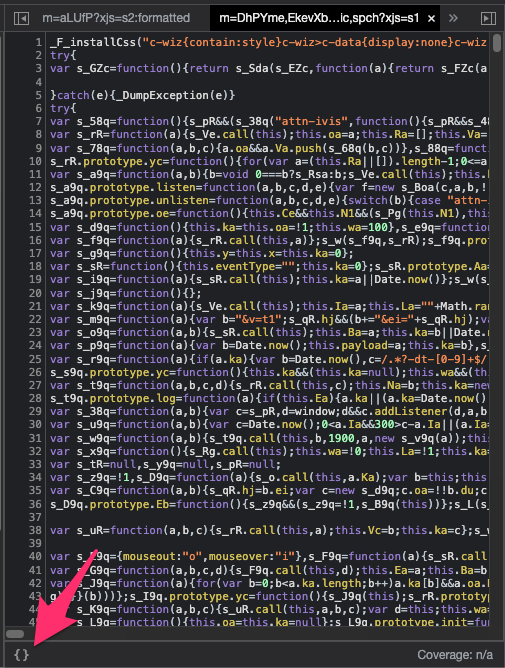
Click on that button and voila! Just like magic, you get all the indentation, whitespace, and tabs back. Now enable code folding using the previous command menu tip, and you can start understanding the logic of this complex file. The same file after prettifying and enabling code folding looks like Figure 5.
Your Personal CodePen
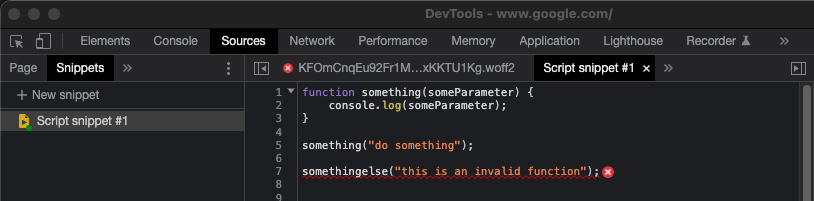
JavaScript is a weird language, and no matter how good you are at it, you're never really good at it. When we work on complex JavaScript applications, we frequently want to try out things. Typically, we use sites such as codepen.io for this. Those sites work great, especially when you wish to share code among friends. But did you know that there's a CodePen equivalent built right inside of dev tools? The advantage is obviously that you can now store the .js snippets on your disk. It's called the snippet editor.
To access the snippet editor, go to the sources tab, click the >> menu, and look for Snippets. Here, you can manage your code snippets, as can be seen in Figure 6.
Although this is great, you may be wondering about a serious limitation here. These snippets are just JavaScript, but our websites are frequently made up of HTML, CSS, and so much more. Well, it's no issue. The idea is that you can have a bunch of these helper snippets on your disk that you can use for quick debugging helper functions, etc. But you can also pair them with any other kind of file you wish.
For instance, I went ahead and stored the above snippet to a directory called temp, and in the same Sources tab to the left of snippets, there's another tab called Filesystem that allows you to add a local folder to a given site. You'll be shown a warning like that in Figure 7.

The advantage now is that you can store any kind of file on your local file system. You can edit it in VSCode as you wish. And you can see the results directly in the production site without deploying to the server. I've found this tip extremely helpful in not only diagnosing issues, but also creating a bunch of helper functions. For instance, if a site has a bunch of download links, I could easily write a helper script with UX, if necessary, to help me download all files quickly. Or I could easily insert a debugging rendering UX with charts and graphs driven completely from the local operating system.
Keep an Eye on a Value
Let's say that you're writing a programming game and are trying to narrow down on a difficult bug. Almost like you wish you had four hands as you played the game, you wish to keep an eye on the value of a variable or expression. I know what you're thinking: You can set a watch variable, right? The problem is that watch will only work if something is in scope and, effectively, in debug mode.
There's another way. The JavaScript console lets you literally keep an eye on an expression. Let me explain with an example.
Let's say you have a complex JavaScript method, as below.
(Math.random() + 1).toString(36).substring(7);
Running this generates a random set of characters every time. And you wish to be able to keep an eye on the output of this as you interact with the page, or maybe not even interact with the page. Here's how you do it.
You open the dev tools and navigate to the console tab. Here, click on the “eye” to create a live expression, as shown in Figure 8.
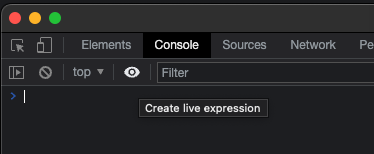
In the text box, go ahead and place your live expression text. This could be a variable or the output of a function. Now, Chrome dev tools pins this value on the top and updates it constantly. This is a great way for you to keep an eye on a value as the value changes.
The Chrome tool pins the value on the top and updates it constantly, allowing you to keep an eye on the value as it changes.
Screenshot Large Pages
Okay, this next one is a pretty amazing tip that I've seen developers install tools for or do all kinds of gymnastics for. Little do they know, this is built right inside of Chrome. Sometimes you have a long page, and no matter how big your monitor is, it requires you to scroll. What if you want to take a screenshot of the entire page, including the areas that aren't visible? Like I said, I've literally seen developers painfully scroll, take pictures, and stitch them together.
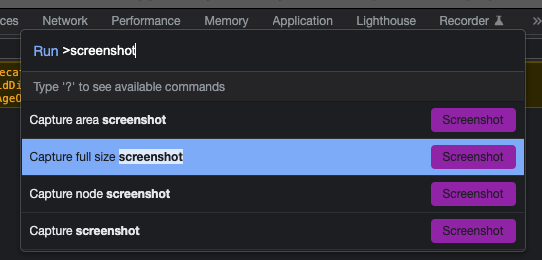
But it's built right into Chrome. Again, just open dev tools and press CMD_SHIFT_P (Mac) or CTRL_SHIFT_P (Windows) and choose to do a “full size” screenshot, as shown in Figure 9. Doing so creates a screenshot of the entire page and downloads it.
Now feel free to play around with the other options as well. I especially like the “node screenshot” option, where you can first select an element using dev tools and choose to take a clean screenshot of only that node and its children. This is great for documentation and emailing and really takes the hassle out of taking clean screenshots of complex page elements.
Play with HTTP Requests
Chrome dev tools have an interesting Network tab that lets you do quite a bit. At its very basic, it lets you record your HTTP traffic going back and forth. Because this occurs in the user's context, you can even see HTTPS traffic. This, of course, is great for debugging issues. Sometimes you still need to branch out to Fiddler or Wireshark when you wish to capture OS-level traffic or act as reverse proxy, but 90% of the time, Chrome dev tools are enough for most of my needs.
Hidden here, though, are bunch of really cool tricks.
First is the Preserve log checkbox, as shown in Figure 10.
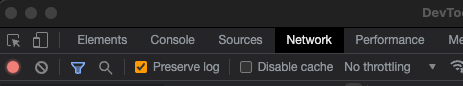
By checking this checkbox, the log doesn't get cleared out every time you move page to page. I find this especially useful when diagnosing authentication issues because a typical sign-in process does go through multiple pages.
In Figure 10, you can also see the Disable cache and the Throttling UX. Those are great to diagnose hard client-side problems and get caching out of the picture, and to simulate low bandwidth situations.
Below this UX and not visible in the screenshot are a number of other tools. If you don't see the filters, click on the funnel icon shown in blue shown in Figure 10. For instance, in a large network log, you can separate out the traffic you're concerned about by using various filtering capabilities. For instance, you can limit the UX to just XHRs, or just Docs, so all those CSS/JS downloads don't interfere with your view.
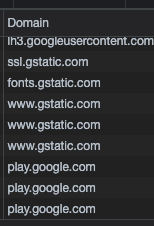
In the actual network log, you can see a number of other interesting things. First, you can right-click and choose to hide/show information as columns. Sometimes I like to make the domain visible to eliminate issues coming from my site vs. others. This can be seen in Figure 11.
Another interesting set of columns can be seen in Figure 12. The size column is essential to know if your caching strategy is working as intended. This can be a make or break for both functionality and performance. Time lets you see which requests are too slow. You can clearly see that the stuff that comes from cache vs. network is hundreds of times faster. This is great because you can now easily zero in on where your bottlenecks are and see if you can cache them.
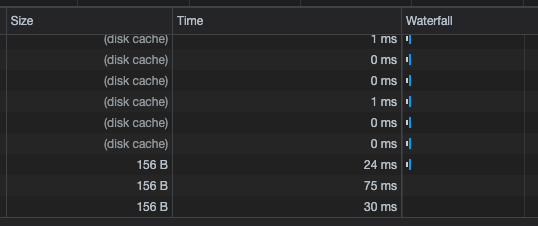
And finally, the waterfall lets you identify opportunities for parallelizing the requests to reduce the overall time. The screenshot in Figure 12 is for the google.com home page. As you can see, they've done a great job at optimizing their home page, and why wouldn't they? They probably have a team of engineers dedicated to fine tune every nanosecond of this operation. Given how many times www.google.com is served a day, just caching 100 bytes probably means a million dollars or something ridiculous for them.
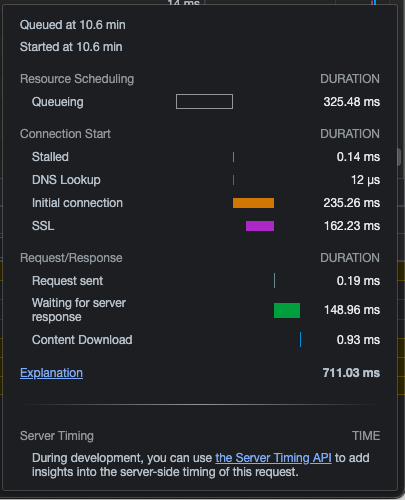
Speaking of performance, if you hover over any network request, you can see a pretty nice breakdown of where the time was spent, in addition to the total time. This can be seen in Figure 13.
Network tools are essential not just for performance but also for debugging your APIs. For instance, you can right click on any request and choose to copy a number of details. A common example is when I have a REST call with an access token, and I wish to debug my API, but don't want to go through the UX to get a request to my API. I can easily copy its cURL and simply replay it from the command line as many times as I wish until the token expires, of course. Or, even better, I can edit the request slightly and replay it. This can be seen in Figure 14.
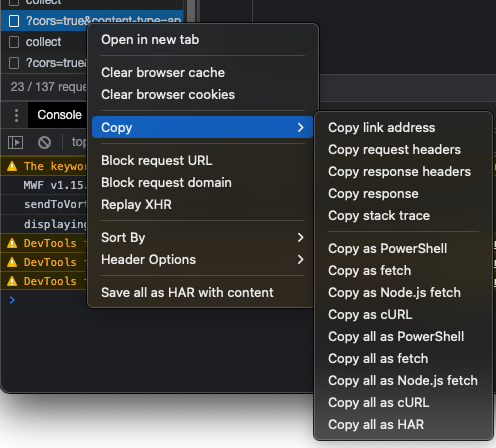
This really simplifies my task both for debugging and documentation.
Finally, you can also import/export the entire network trace as a HAR file and mail it to your friend for debugging. Be careful though, the HAR file contains sensitive information, like passwords. But you can open the HAR file in notepad first and clean out all passwords, etc., if you're concerned before mailing it out. Again, be wary that passwords can be removed, but tokens could be valid for some duration. Realize that what you're emailing contains sensitive information. I prefer to do this only for dev environments.
Record User Journeys
Frequently, you're trying to debug issues that require you to traverse specific flows in the page. This may involve login, clicking around on certain links, page refreshes, etc. You may want to share such user journeys with the team. Or perhaps you wish to track a hard-to-measure performance issue that spans multiple pages or replay such a journey under different network throttling situations.
All of this is possible via Chrome dev tools. To do so, visit the recorder tab in dev tools, and choose to start a new recording. Then simply interact with the page and the recorder records all your actions. Once recorded, you can rename the recording, or import/export it as a puppeteer script, to use it for acceptance tests. Or you can choose to replay that script with performance measurement under different network conditions.
Bonus Tip: Dark Mode
This one isn't a developer tip but more of a productivity tip. There was a time when I used to be an MS Office and Microsoft products junkie. Well, not anymore. Over the past few years, I've gradually become more and more cross-platform both in terms of business tools and dev tools. Look, I don't have a horse in this race and I'll use whatever tool is right for the job.
The other thing that has changed is age. Although my passion for technology is still there, I now use an 120hz OLED screen to reduce glare and flickering. And my eyes are thankful for it. Seriously, these are things I never paid any attention to just 10 years ago. But life slaps you fast. I really enjoy using dark mode on an OLED screen, it really cuts down all eye stress.
So it really irks me that in the year 2023, we still don't support dark mode in Google Docs. Especially when working late at night when every other app supports dark mode, and I open a Google Doc, I feel like a vampire exposed to sunlight. Heck, you can read the operating system settings and see if the user prefers dark mode, and y'know, just render it?
Here's a trick I use to support dark mode in Chrome, even when the underlying product doesn't support dark mode.
In the bookmarks bar, I create a bookmark. You can name the title whatever you want, personally I like to have a convenient emoji like the sun or something simple that doesn't take up too much space on the bookmarks bar.
In the URL, I put the code shown in Listing 1 (the line breaks are for readability). You probably want to run it through a minifier and turn it into a single line of text. Or you can grab a copy and paste-able version from here https://winsmarts.com/dark-mode-in-chrome-without-extensions-36418f57fe34.
Listing 1: Dark mode script.
var head = document.getElementsByTagName('head')[0];
javascript: function addcss(css) {
    var s = document.createElement('style');
    s.setAttribute('type', 'text/css');
    s.appendChild(document.createTextNode(css));
    head.appendChild(s);
} addcss(
    "html{filter: invert(1) hue-rotate(180deg)}");
    addcss("img{filter: invert(1) hue-rotate(180deg)}");
    addcss("video{filter: invert(1) hue-rotate(180deg)}");
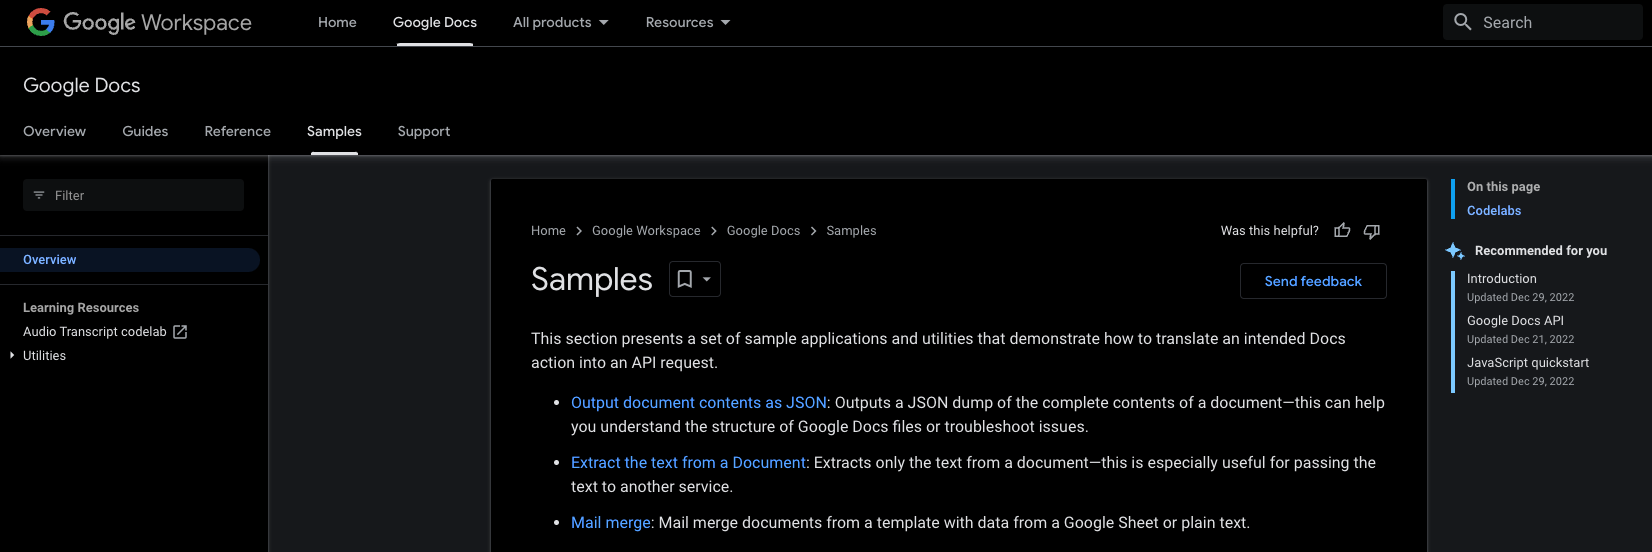
Now, visit any site that doesn't support dark mode. For instance, I visited https://developers.google.com/docs/api/samples. Once you're subjected to the harsh sunlight vampire style, click the bookmark you just created. It immediately turns it into a nice and readable version in dark mode, as shown in Figure 15.
I know there are extensions that can do this for me automatically, but I'm always wary of extensions. They're the equivalent of running JS code on all your secure pages, which isn't a great idea. So although I can't autorun dark mode, at least I can switch to it with ease and read with comfort.
I use this technique quite a bit, and it's really helped me across many products. I highly recommend you trying it, if you're a dark mode fan like I am.
Summary
A developer's life isn't easy. We deliver complex functionality through HTML and JavaScript, and we need some tools to help us out. Chrome dev tools are very powerful and have a seemingly infinite number of features. I'm frequently amazed at the new things I learn and discover every day.
I could easily come up with another 10 tips. Although the tools have grown organically, they do seem well thought out and solve some very hard problems. Sometimes I wonder how large the Chrome dev tools team is.
What are some of your favorite Chrome dev tool tricks? Would you like to see more such tricks?
Do let me know. Until next time, happy debugging.