SQL Server Reporting Services (SSRS) remains the bread-and-butter tool for creating reports, charts, and even dashboard portals in Microsoft database environments. Considering the bells and whistles and eye-popping visualizations in newer self-service reporting products and third-party tools, SSRS remains a strong option for many reporting environments. One way to fortify SSRS's spot at the table is to maintain a steady and accessible knowledge base stream, which helps to address scenarios where the solution isn't obvious for a new SSRS developer. As a trainer and technical mentor, I regularly receive questions that begin with, “I'm trying to do something in SSRS.”
This article covers seven such questions that I've addressed in the last year. Some of the topics are those I regularly face as a developer, and a few were so esoteric that I had to do some digging!
What's on the Menu?
Here are the topics for today:
- A simple solution for creating multiple report objects that stretch vertically
- Conditionally suppressing repetitive report subtotals
- An advanced example of LookupSet and custom VB code
- Launching an SSRS report from .NET with multiselect parameter values
- Launching a child SSRS report in a separate browser window/tab
- Conditional aggregations
- Cross-filtering redux (from an SSRS article I wrote in the May/June 2016 issue of CODE)
Before I begin, I want to make a few points. First, in this article, I'll abbreviate SQL Server Reporting Services as SSRS. I'll also refer to the SSRS designer as SSDT, which is short for SQL Server Data Tools for BI (formerly Business Intelligence Development Studio, or BIDS for short).
Second, I've kept the examples very simple, so I can focus on the mechanics of whatever tip/workaround I'm covering.
Finally, all of these tips will work with SSRS 2008R2 (which Microsoft released in 2010) and newer versions, including SSRS 2016. Most will work on prior versions as well.
#1: A Simple Solution for Creating Multiple Stacked Report Objects That Stretch Vertically
Have you ever struggled with a problem only to eventually learn that the solution was easy? That's how I felt last year when I dealt with the following situation. I needed to create a report with a table on the left and two charts stacked vertically on the right. At runtime, the table could display two rows or hundreds of rows or anything in between. I wanted the charts to stay fixed, even though the table expanded vertically. Figure 1 shows what I wanted to create in the SSDT designer.
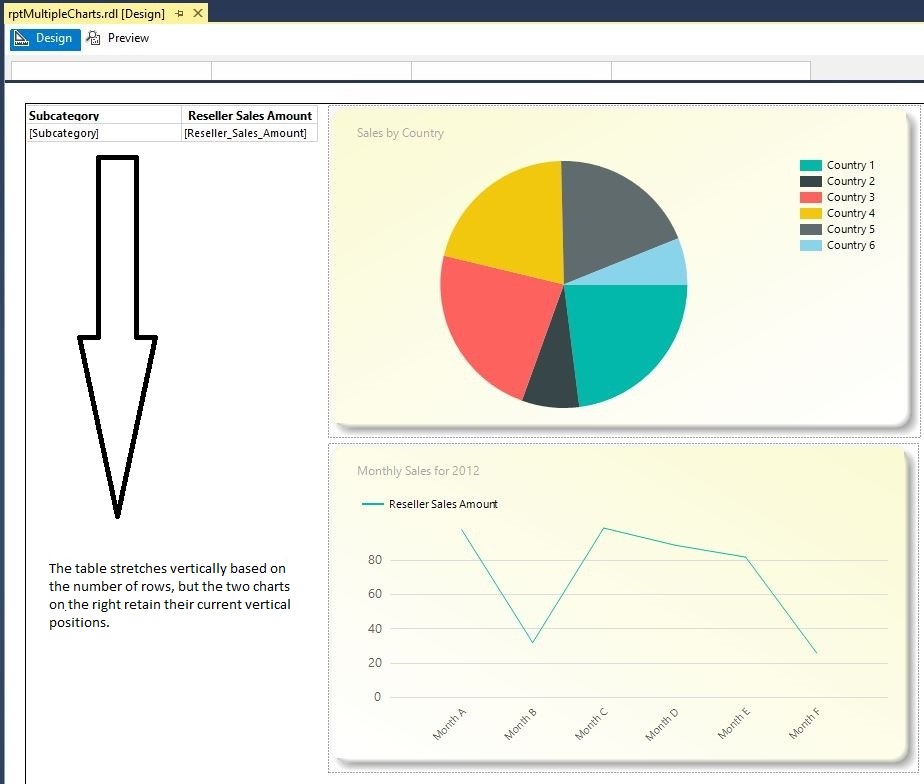
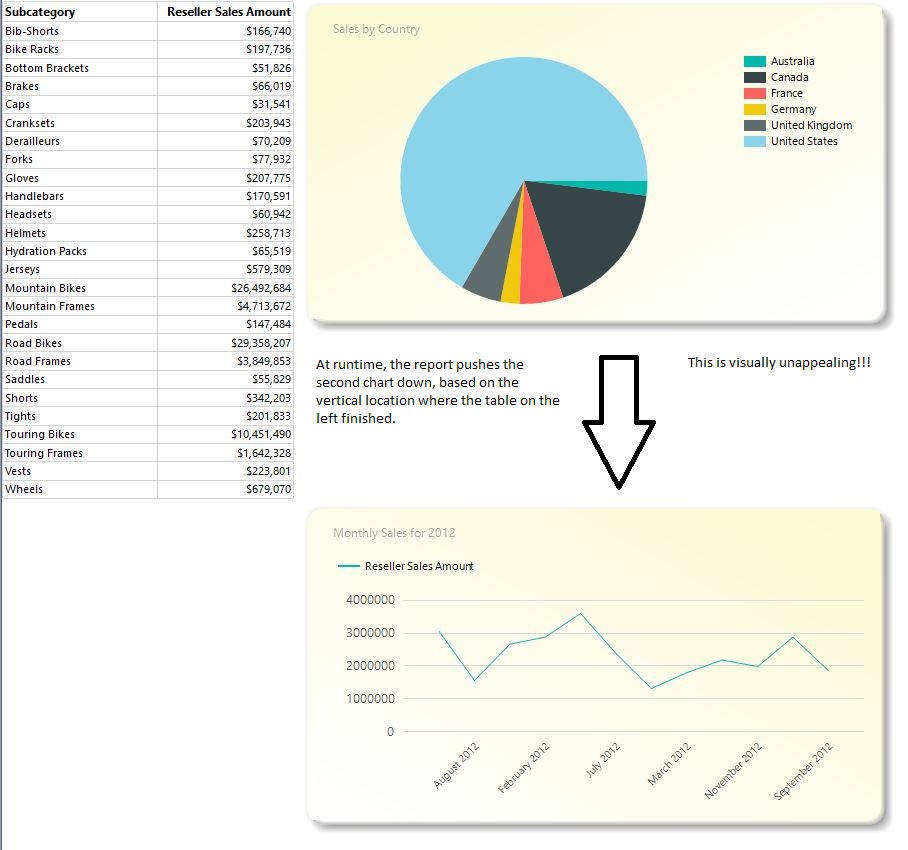
Unfortunately, when I previewed the report (or deployed the report to an SSRS server and viewed the report in a browser), the report had pushed the second chart down (Figure 2), based on the vertical location at the table's end. I wanted the second chart to remain in a fixed location. The two halves didn't match. If you're going to create a dashboard, you don't want one element affecting the location of others for no good reason. If you're looking for visual appeal, you don't want a cavernous space where information ought to be.
How can you keep the position of the charts fixed while allowing the table to expand vertically?
Here's one solution. Because the SSRS engine ultimately renders the report as HTML, the key is to construct the report the same way you'd construct an HTML page. Although the SSDT designer toolbox doesn't contain items like Frames, the toolbox does contain something similar: a rectangle object. As it turns out, the rectangle object easily solves the problem!
I dragged a rectangle object into the designer and placed the table completely inside the rectangle (making sure to stretch the rectangle vertically to cover the height of the second chart). Then I previewed the report (Figure 3). Voila! When the user runs the report, SSRS generates the HTML source using frames to essentially protect/fix the position of the other charts.
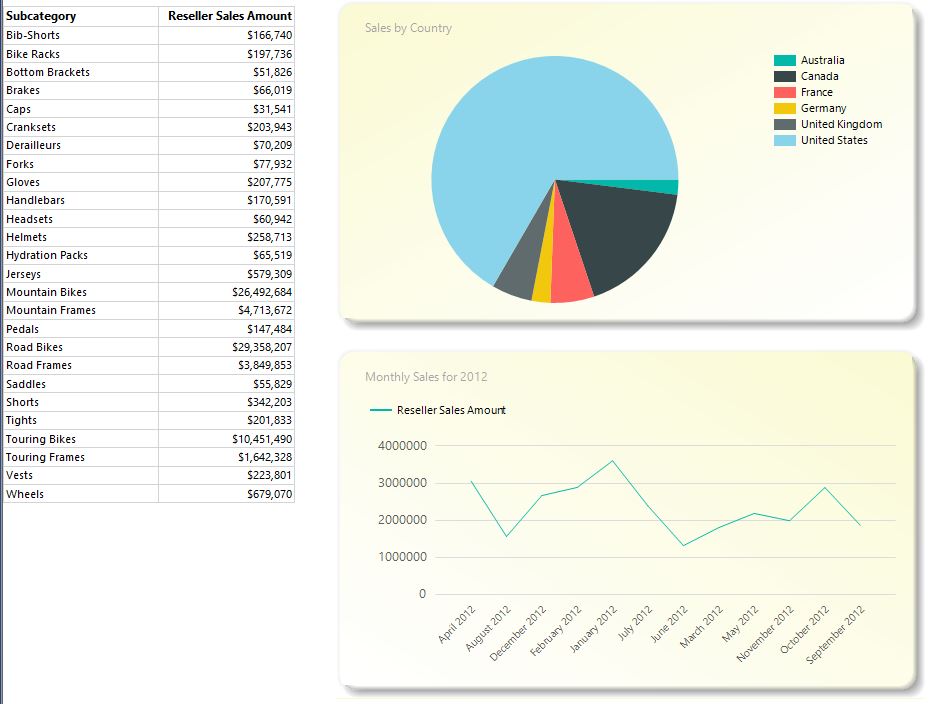
This was an important solution for me because I was building a dashboard page to demonstrate that developers could use SSRS to create attractive visualizations. You might need to experiment with the placement and size of the rectangle and the number of rectangles to create for your own purposes. Just remember that the rectangles protect report objects outside the rectangle so that you can lock their positions.
I was building a dashboard page to demonstrate that developers could use SSRS to create attractive visualizations, so it had to look good.
#2: Conditionally Suppressing Repetitive Report Subtotals
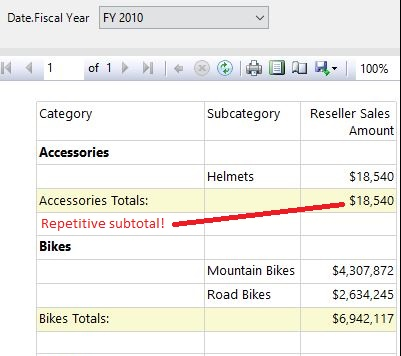
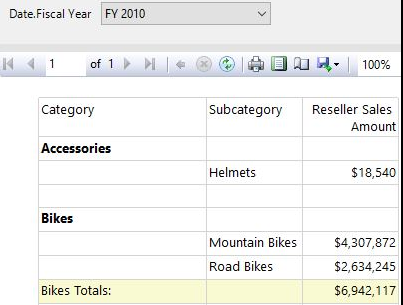
A developer asked me how to suppress repetitive subtotals; he needed to know how to suppress a subtotal when the group only contains one row. Figure 4 shows an example of this. The second group value (Bikes) contains two types of bikes and therefore requires a subtotal of sales. But the first group (Accessories) only contains one specific accessory and arguably doesn't require a subtotal on sales, as the subtotal amount is the same as the sales for the single accessory. The subtotal wastes vertical space on the report, which might be undesirable if the report contains many such instances. That raises the question: Can you conditionally suppress the group footer subtotal row if the group contains only one product subcategory?
Fortunately, you can suppress repetitive subtotals based on a condition. In Figure 5, I access the visibility property of the subtotal row and add an expression to hide the row if the count of distinct subcategories in the current group equals 1.
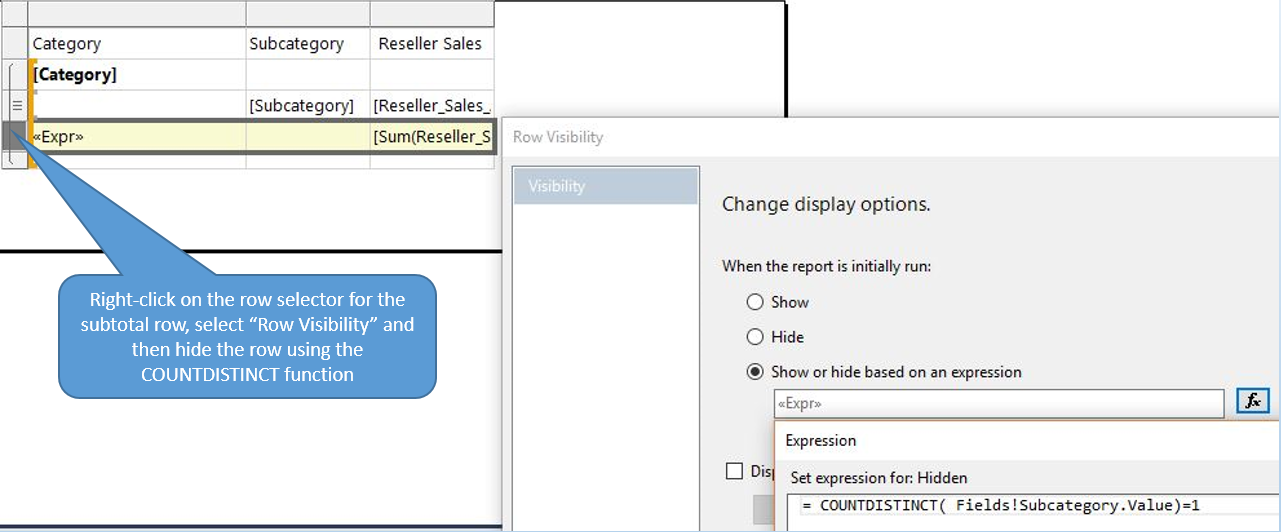
The expression itself uses the COUNTDISTINCT function in the SSRS expression language. If you're wondering why you need the COUNTDISTINCT function as opposed to a simpler COUNT function, the reason is because the raw result set could contain many transactional rows for the single subcategory and the report might be summarizing by subcategory (and then category). In that case, you want to know if you have more than one distinct subcategory value within the current category group.
= COUNTDISTINCT( Fields!Subcategory.Value)=1
After you set the row visibility condition, you now see the desired output (Figure 6).
I have two additional notes. First, someone might say, “why didn't you just place the subtotals in the group header, which you're always going to show anyway?” Depending on the report format, that might be a valid point. However, that leads to the second point. You might be looking at a matrix-style output, where the report spreads the values across the columns axis. In that instance, the report might not use column group headers and might only show totals, so you'd still need to conditionally suppress the totals.
Certainly, not every report with groups and subtotals needs to suppress unnecessary totals. I've known financial accountants who demanded the opposite: subtotals in all instances, regardless of the data. However, it's good to be able to configure output based on expressions, even for infrequent situations.
#3: An Advanced Example of LookupSet with a Dash of VB Code
In an ideal world, every report would query a single database, return the results into one dataset, and then use the report format to effortlessly display the information from that one single dataset.
Unfortunately, sometimes you must deal with less than ideal situations. Suppose you have to create a report where some of the data comes from one source (maybe SQL Server) and the rest from a completely different area (such as an XML or JSON feed). Maybe you have no option but to join the data together back in SQL Server. The two sources contain a common definition, such as a product subcategory and you need to join the data together inside the report.
Figure 7 shows such an example. The report contains two datasets: a primary dataset (dsInternetSales) and a secondary dataset (dsResellerSalesMonthly2012). Both datasets contain a common column (SubCategory). The primary dataset contains one row per category. The secondary dataset contains one row per category/month. You want to show each row from the primary dataset and then sum the sales from the secondary set for each category.
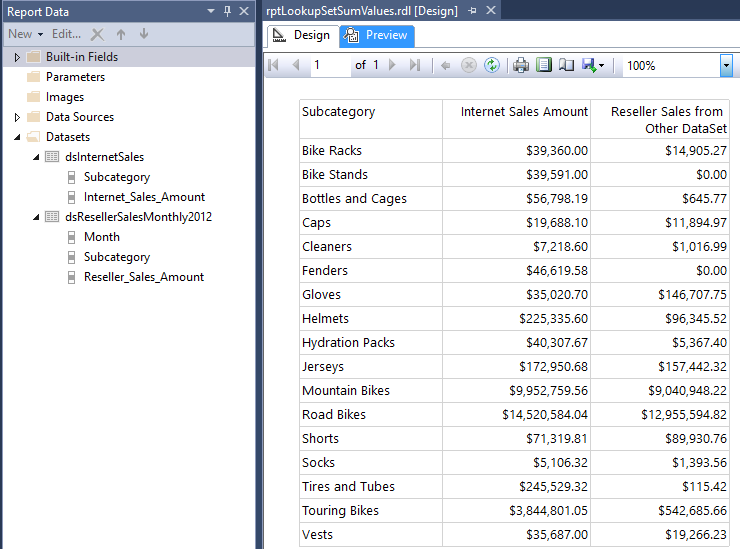
In a prior lifetime (i.e., more than ten years ago), I used Crystal Reports heavily. Crystal Reports allows developers to visually relate multiple result sets, thus making the report you need a breeze to create. Unfortunately, the SSRS report designer doesn't provide any kind of visual interface to relate multiple datasets. Furthermore, by default, the primary SSRS report objects (table, matrix, and chart) operate on the concept of a single primary dataset.
In the spring of 2010, Microsoft released SSRS 2008R2, which provides two functions called Lookup and LookupSet. You can use these functions to simulate a basic lookup/join between two datasets based on a common key. Lookup allows you to take a single value from one dataset and return a single column value from a second dataset, based on matching a common column value. You can only use Lookup for 1x1 relationships between the two datasets.
In this instance, you can't use Lookup because the secondary dataset contains multiple rows (by month) for each common product subcategory. Instead, you must use LookupSet, which allows you to retrieve multiple values from the secondary dataset.
Here's the syntax you'll use for LookupSet. You need to provide four pieces of information:
- The field value for the common column (Subcategory) in the primary dataset
- The field value for the common column in the secondary dataset, which is often the same name as the first parameter (so again, Subcategory)
- The column you want to retrieve from the secondary dataset (Reseller Sales)
- The name of the secondary dataset
LookupSet(Fields!Subcategory.Value,
          Fields!Subcategory.Value,
          Fields!Reseller_Sales_Amount.Value, "dsResellerSalesMonthly2012")
Your work isn't done yet**. LookupSet** returns a collection/array of the reseller sales amounts for any one subcategory. You need to sum the values to show for each subcategory. Can you wrap the LookupSet call inside an SSRS aggregation function like SUM? Unfortunately, no. The SSRS SUM function won't recognize collections that LookupSet returns.
Can you wrap the LookupSet call inside an SSRS aggregation function like SUM? Unfortunately, no.
Microsoft provides one more feature to use. You can write a custom VB function to scan through the collection. You can call the function and pass the collection that LookupSet returns, and the function can manually sum the values. To enter this code, go into the Report Properties window, choose the Code tab, and then enter this custom VB function.
Function SumLookupColumn
    (ByVal itemCollection As Object()) As Decimal

Dim sumResult As Decimal = New Decimal()
sumResult = 0
For Each ColumnItemValue AS Object In ItemCollection
sumResult += Convert.ToDecimal(ColumnItemValue)

NEXT
Return sumResult

End Function
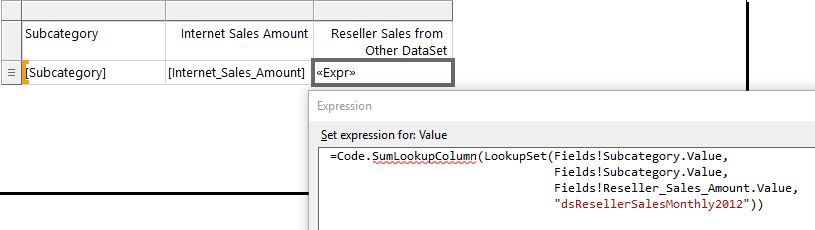
Now you can put it all together. In the textbox expression, you can call LookupSet and wrap it inside the VB function call. Notice that you use the Code.SumLookupColumn notation to reference the VB function, and then you pass the results of the LookupSet function to the VB function.
=Code.SumLookupColumn
    (LookupSet(Fields!Subcategory.Value,
               Fields!Subcategory.Value,
               Fields!Reseller_Sales_Amount.Value, "dsResellerSalesMonthly2012"))
Figure 8 shows the textbox expression for the column/cell where you want to retrieve the sum of sales from the secondary dataset.
Here, you used both SSRS expressions and custom VB code to accomplish a task.
#4: Launching an SSRS Report from .NET with Multiselect Parameter Values
Occasionally, I need to launch an SSRS report from inside an ASP.NET webpage. If the report requires parameter values, I need to pass in the parameters manually, using an SSRS Parameters object. Fortunately, this isn't terribly difficult. I covered this back in the July/August 2011 issue of CODE Magazine (http://www.codemag.com/Article/1108101).
Suppose you need to programmatically pass multiple values to a single parameter object. That's a bit more involved (and not as well-documented), because SSRS parameter objects have specific data type requirements for multiple values.
For this example, you have a report where the user selects multiple years, and the report shows sales for those years. Listing 1 provides a full example where you launch a report from an ASP.NET webpage (using the .NET Report Viewer control) and pass in multiple values to a CalendarYear parameter.
Listing 1: Loading a report from ASP.NET with multiple parameter values
string ReportPath = "/SSRS_Samples/rpt11_TopProductsAndCitiesolap";

// set the report server
ReportViewer.ServerReport.ReportServerUrl =
    new System.Uri("http://desktop-tpghorf/ReportServer_SQL2016");

ReportViewer.ServerReport.ReportPath = ReportPath;

ReportViewer.ProcessingMode = Microsoft.Reporting.WebForms.ProcessingMode.Remote;

// Want to run report for 2 years. Create a collection of years

List<string> ListOfYears = new List<string>();
ListOfYears.Add("[Date].[Fiscal Year].&[2011]");
ListOfYears.Add("[Date].[Fiscal Year].&[2012]");

// Now create a string array from the collection
string[] aYears = ListOfYears.ToArray();

List<ReportParameter> ReportParmList = new List<ReportParameter>();

// Pass the string array as a parameter to the SSRS parmeter list
ReportParmList.Add(new ReportParameter("FiscalYear", aYears));
ReportViewer.ServerReport.SetParameters(ReportParmList);

ReportViewer.Visible = true;
The ASP.NET application might store the set of selected years in a List collection called ListOfYears. Unfortunately, SSRS can't read a list collection as a parameter value. SSRS can, however, read string arrays. So you need to create a string array, populate the string array from the list collection, and then pass the string array to the SSRS parameters collection.
string[] aYears = ListOfYears.ToArray();

List<ReportParameter> ReportParmList = new List<ReportParameter>();

ReportParmList.Add(new ReportParameter("FiscalYear", aYears));

ReportViewer.ServerReport.SetParameters(ReportParmList)
Here's an area where .NET developers (understandably) find SSRS a bit disconcerting - they can't directly pass .NET objects, such as Lists or Table Types, into an SSRS report. Although workarounds usually exist, the frustration is understandable.
Some .NET developers (understandably) find SSRS a bit disconcerting in that they can't directly pass .NET objects, such as Lists or Table Types, into an SSRS report.
#5: Launching an SSRS Report in a Separate Browser Window/Tab
SSRS developers can configure parent/child report relationships so that users can click on a cell/textbox or plotted chart point on a parent report, and launch a child report based on the context of the selected data in the parent report. Many developers use this as part of drill-down scenarios where they can pass parameters from the parent report to the child report.
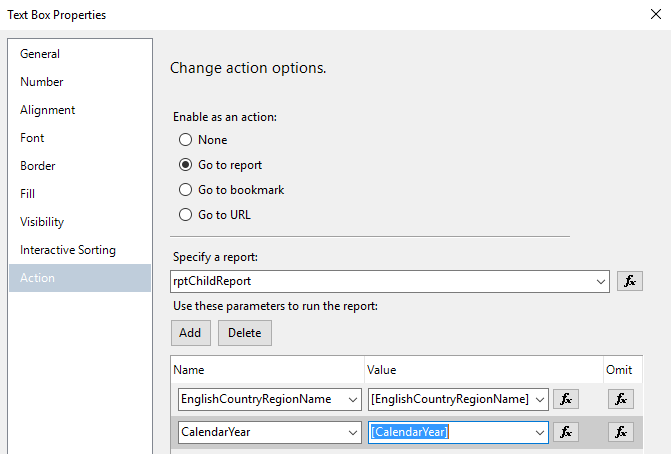
Figure 9 shows the SSDT interface where you can configure an SSRS child report to launch from a parent SSRS report. In this example, the main report shows sales by country and year, and the child report shows more detailed sales information for the specific country/year that the user selected on the main report. The child report contains parameters for country and year, and the main report auto-populates those values from the main report.
The SSDT interface allows you to select the parameters for the child report, and then map them from the available columns in the primary dataset of the parent report. In the example in Figure 9, you pass the Country and Calendar Year from the parent report dataset (based on the row the user selects) to the parameter values that the child report expects. Presumably, the child report will show additional transactional data for the specific Country/Calendar Year from the parent report.
At runtime, when the user clicks on a cell or plotted point to launch a child report, SSRS overlays the parent report with the child report. SSRS also adds a toolbar option in the child report at runtime to navigate back to the parent report.
So far, so good. Now it's time for the challenge!
Recently, someone asked me if SSRS could open up a new browser window/tab for the child report, instead of overlaying the parent report. That way, the user could easily tab between the parent and child report, instead of only seeing one report at a time.
Unfortunately, when you use the specific SSDT Report Action options in Figure 9, at runtime, SSRS only launches the child report on top of the parent report. SSRS doesn't provide an option to launch the child report as a separate tab at runtime.
The good news is that there's a workaround, albeit it a tricky one. Instead of using the SSDT interface to configure the child report in the designer, you can “go rogue” and generate a URL that calls a JavaScript function to open a new browser tab and invoke the child report. In Figure 10, instead of selecting the child report directly in the SSDT designer, I've generated a URL with an SSRS expression.
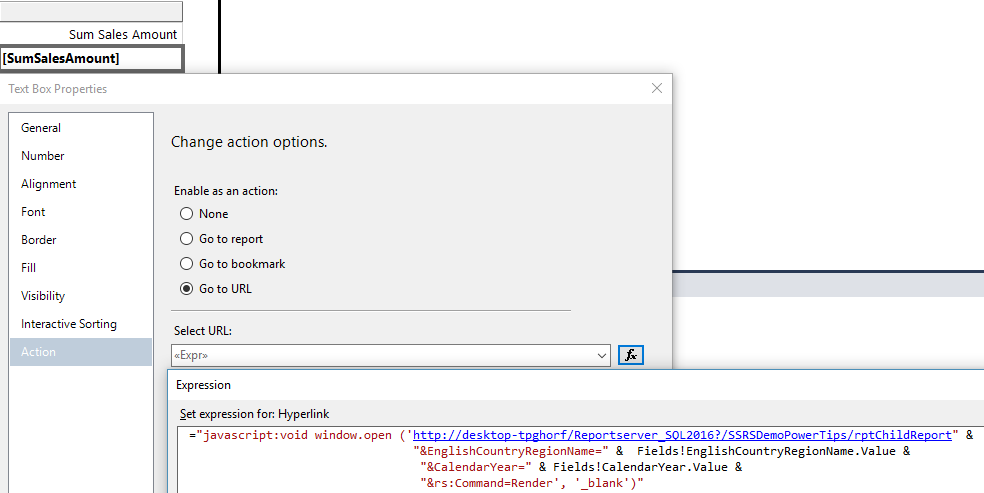
The SSRS URL expression calls JavaScript to open a new window, where I specify the name of the SSRS report server, the report folder, and the report. Then I pass in the values for the parameters. Finally, at the end, I include the _blank option to force the parent report to open a new browser tab. (Note: Given how long the SSRS server name and child report name can be, you might consider reading the server name and child report name from a configuration table, and then mapping it to a hidden parameter.)
="javascript:void window.open (' <fullname>  " &
"&EnglishCountryRegionName=" &
    Fields!EnglishCountryRegionName.Value &
"&CalendarYear=" &
    Fields!CalendarYear.Value &
"&rs:Command=Render', '_blank')"
This isn't exactly a mainstream function, so please test it across all browsers that your users might launch. It works for default settings, but there's no guarantee that it will work with all browsers and browser settings. If you do a Web search on “SSRS” and “new browser tab,” you'll likely find dozens of variations on the JavaScript I've listed here.
Some variations open a new browser window and set the size/dimensions of the browser, and other variations handle the report server and parameters a bit differently. There is no one-size-fits-all solution, as (again) this isn't a mainstream function. So to borrow from the famous YMMV acronym, your specifics may vary. Still, this can be a workable solution for opening up multiple report tabs.
Please test this feature across all browsers your users might launch.
#6: Conditional Aggregations
Here's another example where SSRS expressions can help you. Figure 11 shows a basic report that summarizes sales by year. The report shows a final total and then two custom expressions, highlighted in yellow. The first summarizes sales for specific years (which users have asked you to show AFTER the final total), and the second shows sales for specific years as a percentage of the total. You have no ability to modify the procedure that creates the result set, so you have to use the report to add the two custom calculations shown in yellow.
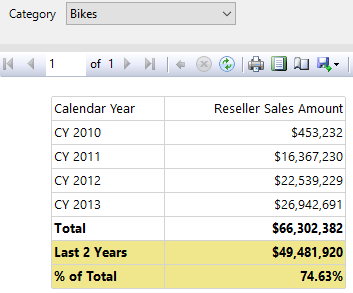
For the first expression (that summarizes the data for 2012 and 2013), you can place an IIF function inside a SUM function to conditionally summarize the reseller sales amount based on the two highlighted years. Otherwise, you simply sum a zero amount. Note that I've used the CDEC function to convert the data aggregated to a decimal, which wouldn't be necessary on a basic SUM expression. This is to align to a common data type in the custom aggregation.
=sum ( iif (
     Fields!Calendar_Year.Value = "CY 2012" or
     Fields!Calendar_Year.Value = "CY 2013",
         CDEC(Fields!Reseller_Sales_Amount.Value),
             CDEC(0.00)))
For the second expression, I can refer to the two textboxes by name (using the ReportItems collection) to come up with a percentage.
= ReportItems!txtTotalLastTwoYears.Value /
     ReportItems!txtFinalTotal.Value
#7: Cross-Filtering Redux
In the May/June 2016 issue of CODE Magazine (http://www.codemag.com/Article/1605111), I showed a tip to produce cross-filtering effects in SSRS reports. In the example, I showed how you can create a report so that a user can click on one plotted point of a chart to filter (or change the visual display of) another chart on the same page. Self-service BI tools, such as Power BI, advertise this feature heavily as a core function, so I wanted to show that you can use SSRS to achieve the same general functionality.
I won't repeat all the text from the original article tip, because you can go read it. Suffice it to say that I used a combination of hidden parameters, SSRS expressions, and report actions (to relaunch the report with new filter settings) to implement cross-filtering. Granted, the effect can take a second or two, and Power BI's cross-filtering refresh happens instantly. However, using SSRS, you can build whatever cross-filtering logic you want, whereas with other tools you might have less control.
I've used this pattern (hidden parameters, SSRS expressions, and report actions) extensively over the last few years to build SSRS dashboard pages with cross-filtering effects.
I've used this pattern (hidden parameters, SSRS expressions, and report actions) extensively over the last few years to build SSRS dashboard pages with cross-filtering effects. Microsoft's implementation of HTML5 in SSRS 2016 also enhances the display. This is a compelling topic, as it helps developers to make an argument that SSRS can produce results that are comparable to those from other dashboarding tools. I've silenced a few SSRS nay-sayers when they see the results and admit, “wow, you did this with SSRS?”