Recent polls show that nearly fifty percent of applications with reporting functionality use Crystal Reports, and about twenty percent use SQL Server Reporting Services.
This article will cover some of the major reporting tasks that developers face, and how the two reporting tools (Crystal and SQL Server Reporting Services) handle the tasks. Finally, I’ll provide a sneak preview at the next scheduled releases of both products (the next version of Crystal Reports and SQL Server Reporting Services 2008).
The 411 on Crystal Reports and SQL Server Reporting Services
Crystal Reports has had eleven versions spanning twenty years. The first three versions of the product were Crystal Services, back in the 1980’s. Seagate Software (which was renamed Crystal Decisions) acquired the product for Crystal Reports versions four through nine. Business Objects acquired the product for versions 10 and 11. Business Objects is currently working on the next version of Crystal Reports. Surveys estimate that Crystal Reports currently owns slightly more than 50% of the developer reporting market.
When using the Crystal Reports push model, make sure to account for EVERY report database object at runtime.
Most Crystal Reports (for ease in this article I’ll usually just refer to the product as Crystal) users are application developers, although some corporate power-users occasionally build internal reports using Crystal.
I’ve written two prior CoDe Magazine articles on Crystal Reports: the Jan/Feb 2007 issue (www.code-magazine.com/Article.aspx?quickid=0701031) and the Jan/Feb 2005 issue (www.code-magazine.com/Article.aspx?quickid=0501071). Both articles present many tips for integrating Crystal Reports into .NET applications. I’ve also written a book published by Apress, Pro VS 2005 Reporting with SQL Server and Crystal Reports.
I’m going to try to minimize duplication of content from prior articles on Crystal Reports. However, I do want to mention that the January 2007 issue presents a reusable library for common reporting tasks. Listing 1 shows some examples of how easy it is to use the library for setting report data sources, previewing, printing, and exporting reports. You can find the download for this library on my site, at www.commongroundsolutions.net\CGSCrystalTools.zip
Microsoft released the first version of SQL Server Reporting Services (SSRS 2000) in 2004, and then released SQL Server Reporting Services 2005 a year later with the release of SQL Server 2005. Microsoft will release a third version of SQL Server Reporting Services (SSRS 2008) when they release SQL Server 2008.
Both Web application developers and power users/business analysts use SQL Server Reporting Services (which I’ll refer to as Reporting Services or SSRS). In fact, Microsoft promotes Reporting Services as part of their Business Intelligence solution.
Neither Crystal nor SSRS is a full object-oriented report writer. They are object-based with a rich object model, and feature a certain amount of cascading. Additionally, Crystal supports CSS themes. However, OOP enthusiasts will need to lower their expectations and adjust to the fact that neither product supports true object-oriented features.
While difficult to accurately quantify, SSRS contains roughly 70-75% of the functionality of Crystal Reports. Some SSRS users/developers may view this as remarkable that a product in its second version would even be that close to a product with a much longer history. Others may react less philosophically if the remaining 25-30% includes key missing functionality.
While I’ve written a book on Crystal Reports and generally prefer Crystal Reports, I’m also quite impressed with what Microsoft has accomplished in a fairly short time period. The objective of this article is not to lobby for use of one over the other. (I’ve used both over the last year.) The purpose of this article is to present the differences between the two products and also to document important reporting features that exist in one product versus another. Some companies have decided to switch from Crystal to SSRS, and others are contemplating the switch: therefore, it’s very important to know what functionality may be lost during the process.
What’s on the Menu?
Using the current versions of both reporting products (Crystal Reports XI and SQL Server Reporting Services 2005), I’ll cover the following reporting tasks:
- Report creation
- Report data sources
- Report sections and groups
- Formatting and formula options
- Page control options
- Report parameters and global report variables
- Subreports
- Charts
- Drilldown capabilities
- Exporting reports
- Programmatic access
- Previewing in Windows Forms or in the browser
- Matrix and Cross-Tab objects
Tip 1: Creating Reports
For experienced users, creating new reports may seem almost as mundane as creating a new Word document or a class file; however, new users usually need some sort of guide to create a basic report structure.
Creating New Reports in Crystal
You can create new Crystal files either in Visual Studio 2005 (by adding a new item and selecting Crystal Reports as the item type), or by using the standalone Crystal product. The Crystal designer in Visual Studio 2005 contains most of the functionality of the standalone product.
Crystal provides three options for creating reports:
- You can use the new report wizard that helps to define a data source and build the general report layout.
- You can start with a blank report.
- You can create a report from an existing report. This option is helpful if you have a template report that you wish to use as the basis for all future reports.
With the second or third option, you’ll eventually need to establish a design-time data source for the report.
Generally, a new report will contain a report header and footer section, a page header and footer section, and a detail band. You can add sections and groups based on the report requirements, which I’ll cover throughout this article. The Crystal designer contains a WYSIWYG previewer-and in many instances, you can actually modify report elements while in preview mode. A saved Crystal Report is a binary file in a propriety format. You can add reports as strongly-typed items to your Visual Studio project, or you can keep them outside your .NET project and use them as untyped reports.
Creating New Reports in SSRS
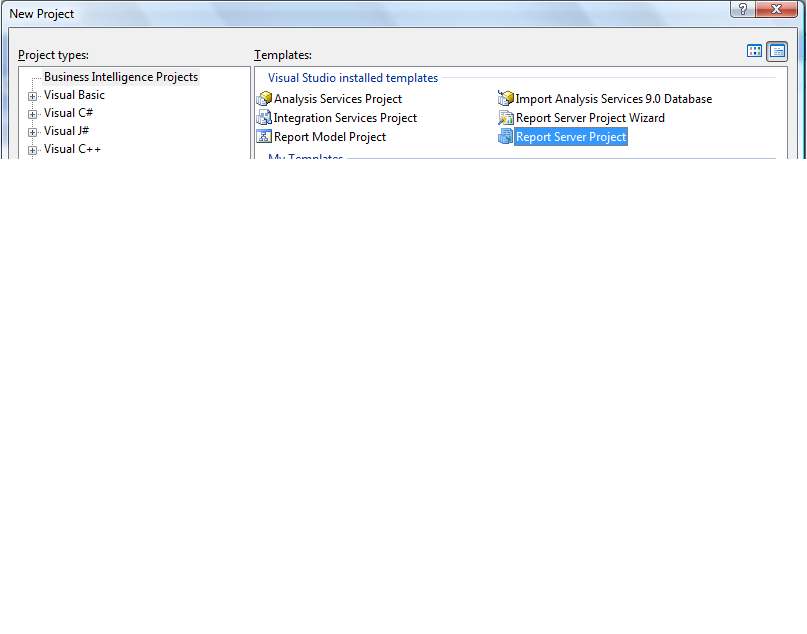
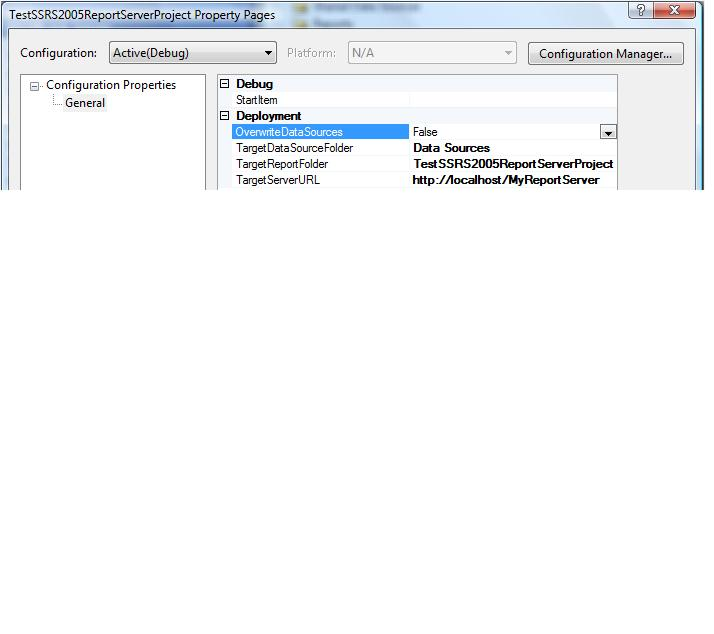
To create SSRS reports, first you must create a Business Intelligence project in Visual Studio 2005, and select Report Server Project from the list of installed templates (Figure 1). You’ll see the BI project type and the Report Server template if you have SQL Server 2005 and SSRS installed. After you create the new project, you can set target URL deployment and other options in the project properties dialog box (Figure 2). A Report Server project contains shared data sources and report files (Figure 3).

SSRS provides two options: You can use the Add New Report wizard (again, to define a data source and general layout), or you can start with a blank report. If you want to create reports from a base template report, you can manually make a copy of the file outside of Visual Studio (i.e., in Windows Explorer), and then go back to Visual Studio and add the copy as an existing item.
A blank SSRS report does not contain as many default sections as a Crystal report, but you can easily add sections (such as headers, a table layout, etc.). The design environment for SSRS contains three tabs: one for data definition, one for layout, and one for preview. Note that unlike Crystal, SSRS preview mode does not allow you to modify any formatting on the fly-you need to go back to the Design tab, make the change, and return to the Preview tab.
An SSRS report uses an extension of RDL (Report Description Language) and the file itself is an XML file. Some software companies have produced their own RDL designer. These companies include: Cizer, Panorama Software, Panscopic, and ProClarity. In some instances, these third-party RDL designers are part of the vendor’s BI solution.
Tip 2: Report Data Sources
A report is essentially an analytical view of the data-an extension of the UI. Therefore, it stands to reason that the relationship between reports and data is similar to the relationship between data-bound controls and data. You design a report against some type of representation of report data, and then run the report against a populated instance of the original representation.
Creating a Data Source in Crystal-the Push and Pull Models
Crystal allows you to specify a design-time data source (Figure 4) which can be a typed DataSet, a .NET class object, an OLE DB source, etc. This generally reflects Crystal’s support for what is commonly known as the report push model and report pull model. In the push model, developers will “push” data into an instance of the report, usually by means of typed DataSets or XML data, or by means of a custom collection (for example, a .NET List object). By contrast, the pull model describes a process where the report “pulls” data from an external data source (quite often, a database stored procedure).
Creating a Data Source in SSRS
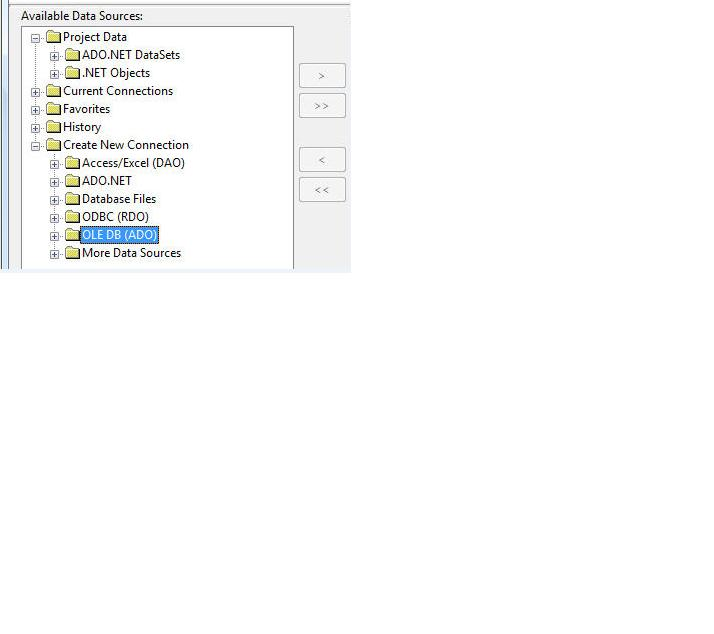
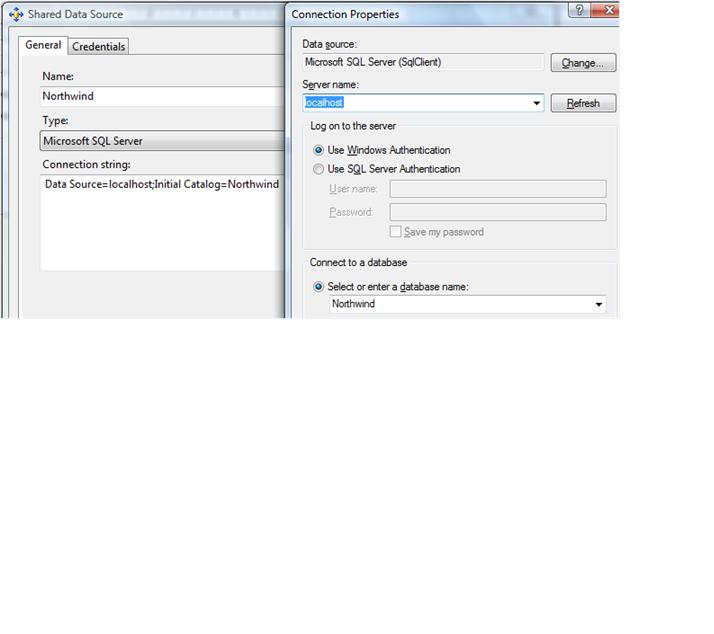
In SSRS, you can specify the data source for a report in one of two ways: You can add a shared data source to your report project, or you can add a specific data source that’s scoped to a specific report. Either way, SSRS provides you with a dialog box (Figure 5) to define your data source. Note the Type pulldown in Figure 5 (defaulted to Microsoft SQL Server): SSRS allows you to specify Microsoft SQL Server, SQL Server Analysis Services, Oracle, XML, or any OLE DB source as the data source for the report. (Yes, that’s right; you can specify an XML Web service as the data source for an SSRS report! I’ll cover that momentarily.)
Additionally, you can write a custom data extension to utilize your own .NET classes as a Data Source. Rod Paddock has written two excellent articles not only on implementing this, but also on integrating other .NET DLLs with SSRS. You can find his articles in the July/August 2004 and January/February 2007 issues of CoDe Magazine.
Do not confuse an ADO.NET DataSet with a SQL Server Reporting Services DataSet. An SSRS DataSet only holds one table.
Finally, in order to specify an XML Web service for the data source for an SSRS report, you have to follow two steps.
- You define the data source in the connection string as follows:
data source=http://localhost/test.aspx
- Use the code in Listing 2 for the query syntax (in the report dataset query).
Linking Tables in a Report Data Source
If you use stored procedures (or direct in-line SQL queries) directly as your data source, be aware both report products will only allow you to access the first table in the result set. So for both products, if you have stored procedures that return multiple result sets, the only way to access every table in the result set is to call the stored procedure once for every result set (usually not a very good approach).
In fact, the SSRS DataSet will only store one result set, period. If you need multiple result sets for your report, you either must create a Cartesian product in your SQL queries, or you must create multiple datasets for the report and use subreports to link the data from the datasets.
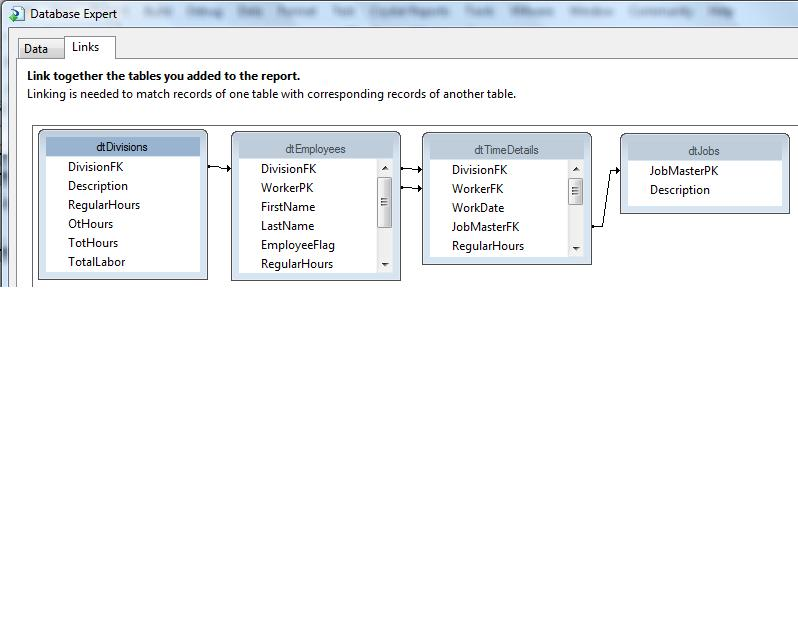
However, Crystal does allow multiple tables when you utilize the “push” model to push datasets/XML data into the report. (Crystal has a tables collection in a report’s database object.) So as long as you use the report push model, you can pass multiple tables into the report, and you can create linked relationships between the tables. Figure 6 shows the Links tab of the Database Expert dialog box, which allows you to define relationships between tables. Once you’ve done that, Crystal will allow you to place columns from multiple tables on the report body (respecting any relationships), without needing to use subreports.
Tip 3: Report Sections and Groups
Regardless of the specific product, almost all report writers will break a report apart into logical sections such as a header, footer, and detail area.
The report writer will allow you to add sections to the report, such as a logical group to represent a one-to-many relationship. For example, you might define a group that consists of a customer name in the group header, a list of orders for the customer in the detail area, and then a subtotal line for the customer in the group footer. Additionally, you might define multiple groups, such as a territory, all the customers within that territory, and then all the orders for that customer. In that case, you would have two group headers, one detail line, and two group footers. Regardless of the number of groups, a report can only have one detail band: if you need to display multiple levels of detail, you’ll need to build a subreport, which I’ll cover in Tip 7.
Sections and Groups in Crystal
An empty Crystal report contains a report header and footer, a page header and footer, and a report detail band. You can insert a group by right-clicking in the main report body, and then selecting Insert….group from the shortcut menu. You can also customize section behavior by right-clicking on any section divider and selecting Section Expert, which loads the Crystal Section Expert (Figure 7). The Section Expert lets you choose from these options for each section:
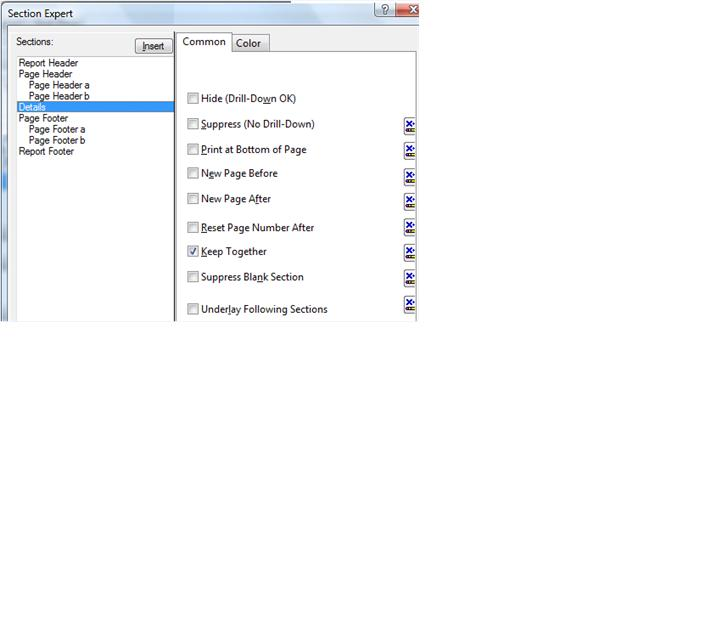
-
Hide. Allows you to implement drill-down capabilities (I’ll cover this more in Tip 9). -
Suppress. Allows you to conditionally suppress a section. -
Print at Bottom of Page. Forces Crystal to print a section at the bottom of the page, even if the preceding section (usually a detail band) finishes before the bottom of the page. You’ll usually use this for reports or forms where a section (such as a subtotal line) must print at the bottom of a page. -
New Page Before / New Page After. Allows you to force a page break before or after a section. For example, if you are generating a report of broker commissions by broker, you would want to start a new physical page for each broker, so that no brokers would be able to see information on a page for anyone else. -
Reset Page Number After. Typically you use this in conjunction with the New Page Before/After option, so that each new section starts with page one. -
Keep Together. This is one of the most powerful (and sometimes most misunderstood) options. Some reports contain sections that must stay together on the same page, such as a legal terms and conditions clause. This option ensures that if the section would otherwise split across pages, Crystal will start a new page early to fit the entire section. (Note that there is also a group option to keep an entire group together, which I’ll cover a little later.) -
Suppress Blank Section. This allows you to suppress a blank section. Have you ever tried to print addresses for a record where the second (or third) address line might or might not exist, where you don’t want blank spaces between the first address line and the city/state/zip? By inserting individual sections, placing each data column in a separate section, and checking this option ON, you can format the addresses the way you want them. -
Underlay Following Sections. A very powerful option that allows you to superimpose one section on top of the other. For example, you might have a pie chart in one section, and then a detail band that displays supporting data in the next section, and you want to display them side-by-side.
As for adding groups, Figure 8 and Figure 9 show the two-tabbed Crystal Insert Group dialog box. In this two-tabbed dialog box, Crystal allows you to define such items as whether the group is based on an existing column or a formula, the sort order, and whether the entire group should stay on one page.
Sections and Groups in SSRS
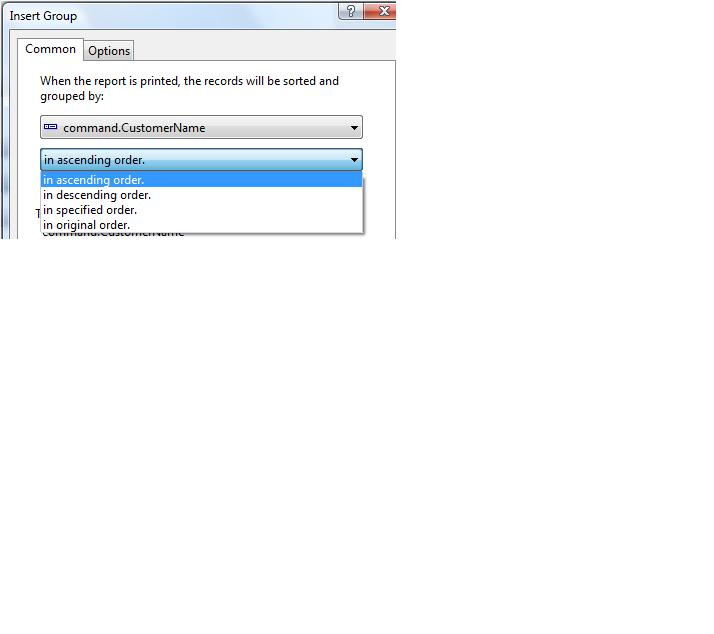
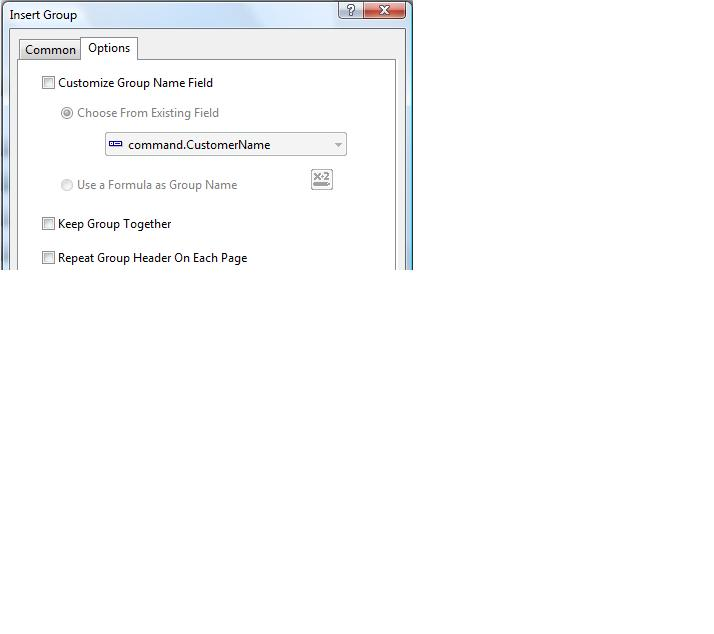
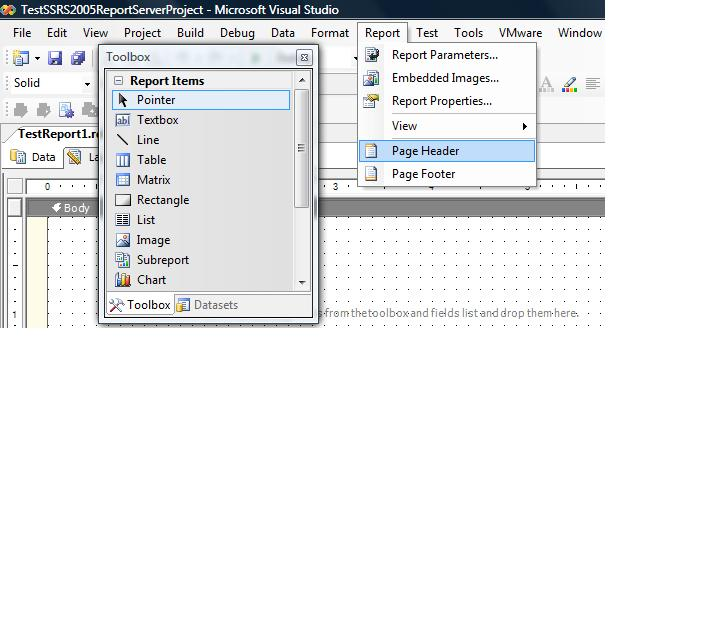
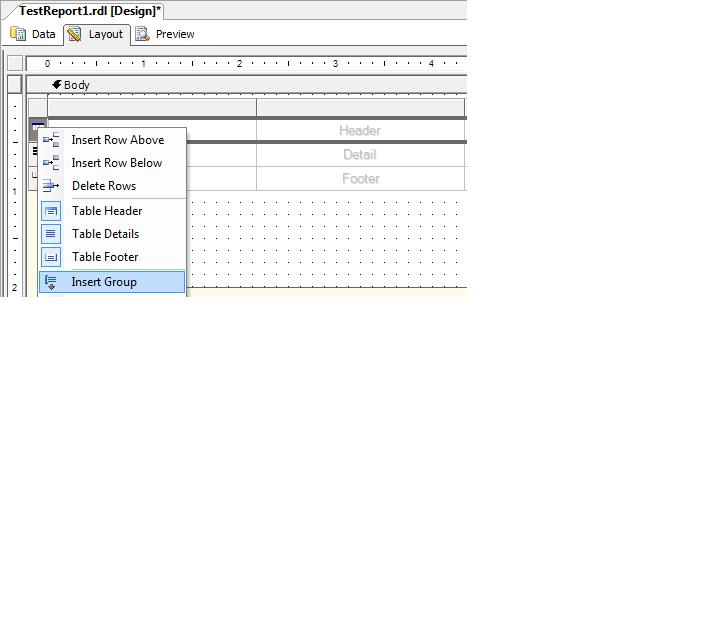
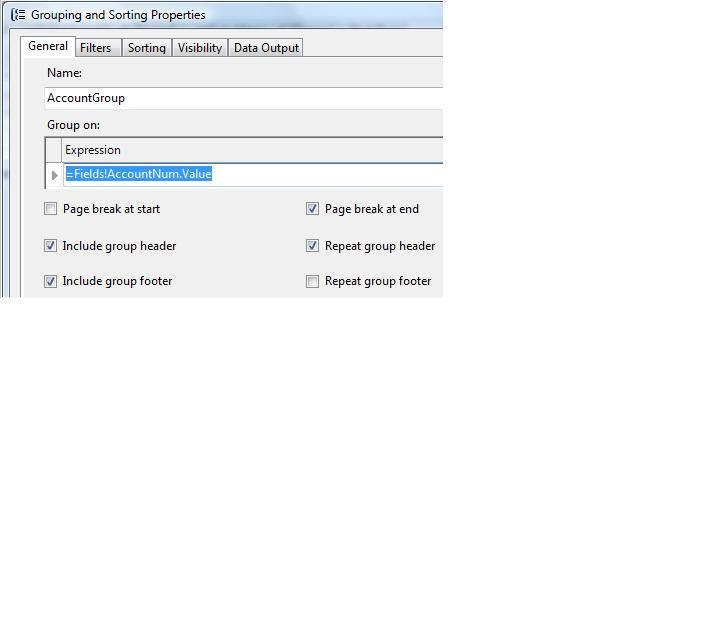
By default, an empty SSRS report starts with just that-an empty report. However, by using either the table or matrix report controls, and by inserting a page header/page footer (Figure 10), you can easily build a basic report. After you add either a table or matrix to the report body, you can define a group (which will insert a group header and group footer) by right-clicking in the row selector area and selecting Insert Group (Figure 11). SSRS will then display the Group Options (Figure 12). Note that SSRS does not provide the functionality to keep an entire group on a subsequent page.
One other note: Recently I conducted an SSRS training session where I created a report with two groups and intentionally defined the groups in the wrong order (to show how to correct it). I am so accustomed to the group selector bars in Crystal that let you visually drag the bars to reverse the order that I mentally assumed that SSRS has the same option. Unfortunately, it doesn’t! You’ll need to modify each group number manually in SSRS if you need to change the physical group sequences.
Tip 4: Formatting and Formula Options and Expressions
Rarely will you ever drag and drop data elements on a report and generate the report “as is.” Most of the time, you’ll need to format and decorate the content of the report. From items such as formatting dates and currency to dynamically highlighting content based on a condition, Crystal and SSRS offer many formatting options.
Formatting Options in Crystal
You can right-click on a report object to bring up the Format Editor dialog box, which provides a number of formatting options. I’ll describe the most common options:
-
CSS (Cascading Style Sheet). Specify a CSS class name to achieve a consistent appearance for report objects. -
Rotate Text. Rotate text at 90- and 270-degree angles. -
Watermarks. You can create a watermark image effect by inserting the image in the page header, and then setting “Underlay following sections” in the Section Expert for the page header. -
Tooltips. Crystal allows you to set tooltip text for a specific report item, which might be helpful if you have a complex report calculation that you want to explain to the user. The Reportviewer control also has a property called EnableToolTips, so that you can programmatically turn tooltips on or off. -
Suppressing Duplicates. Sometimes you may want to create the effect of a report group header without actually using a group. In these instances the data may contain duplicate information (such as a name, or account, etc.) where you only want to display the first occurrence of the data. This option will suppress all subsequent instances of duplicate values. -
Date Formatting and Numeric/Currency Formatting. Crystal provides a rich set of options to format date and numeric/currency data. Crystal provides two separate dialog forms for these two data types, with many checkbox options to format dates and numbers in many different ways. -
RTF/HTML Rendering. By default, Crystal renders field data as text; however, you may need to display content stored as rich text or HTML. If you right-click on a text object, go to the Format Object Editor, and navigate to the Paragraph tab, you’ll see a pulldown option for Text Interpretation with options for RTF and HTML. -
Conversions. Sometimes you may need to convert from one datatype to another. For instance, you may want to display a numeric field as text, but without any decimal positions. You can create a Formula Field that uses the Crystal function ToText() to represent the data, as follows:
' Returns a string value of a numeric column
' with zero decimals

ToText(MyTable.MyNumericVal,0)
-
Expressions/Calculated Fields. I generally discourage calculations in report writers and recommend instead that developers perform calculations in the process that creates the report result set (either in a stored procedure or in a business layer). Having said that, sometimes you may need to add a calculated element to a report. To do so, add a Formula Field into the report, enter the calculation in the Formula Field Editor, and drag the Formula Field onto the appropriate area of the report. -
Dynamic Formatting. If you need to show an area of the report in a different attribute based on a value, you can enter a formula expression for that attribute. For instance, if you want to set the color of a field object based on a value, you can enter the following formula:
if {MyTable.MyTotalCount} > 1 then
   crred
else
   crblack
- If you want to conditionally bold a field object, you can do the following:
if {MyTable.MyTotalCount} > 1 then
   crBold
else
   crRegular
Formatting Options in SSRS
For the items above, SSRS does not currently support CSS, text rotation, or RTF rendering. Here are the equivalent steps you would take in SSRS for the remainder of the items above:
-
Watermarks. SSRS doesn’t have direct support for a watermark. However, you can find a workaround on the SearchSQLServer site (<a href="http://searchsqlserver.techtarget.com/">http://searchsqlserver.techtarget.com/</a>) by searching on “watermark.” -
Tooltips. On the General Properties tab of a textbox, you can specify tooltip text. -
Hide Duplicates. On the General Properties tab of a textbox, you can hide duplicates. -
Date Formatting and Numeric/Currency Formatting. SSRS does not provide full-blown dialog boxes like Crystal to format dates and numeric data. Instead, you’ll need to enter a short formula or expression to format this type of data. For instance, you can use the built-in functions FormatCurrency and FormatDateTime as follows:
=FormatCurrency(Fields!Freight.Value ,2)

=FormatDateTime(Fields!ShippedDate.Value)
- Alternatively, you can enter Format Codes in the Format tab of the Properties window. The format codes for currency or short date are “C2” and “D0”, respectively.
-
Conversions. Just like Crystal, SSRS offers functions to convert from one data type to another. For example, you can use the STR function in the SSRS Expression Editor to convert from a numeric to a string. -
Expressions/Calculated Fields. Again, I discourage this, but if necessary, you can specify a calculation for a column in the column expression area. In addition, SSRS also offers functions for running totals, RunningValue, which you can optionally reset based on an existing report group. Finally, you can add a calculation that uses a value from a previously rendered textbox (Tip 6 will cover this a little more in detail):
=SUM(Fields!AmountDue) /
 ReportItems!OtherTextBox.Value
-
Dynamic Formatting. SSRS provides the same general support for dynamic formatting. In the two examples for setting color and font state, you can enter the following expressions in the Properties window:
=IIF( Fields!StandardPrice.Value<45,
             "Red", "Black" )

=IIF( Fields!StandardPrice.Value<45,
             "Bold", "Normal" )
Note that SSRS also offers a SWITCH statement if you need to evaluate more than one condition.
-
Defining a Hyperlink. If you want to define a textbox as a hyperlink, you can go to the Navigation tab of the Properties window, and define a hyperlink that will direct the end user to another Web page or even an e-mail address (by using mailto). This functionality exists for Crystal as well. An impressive feature is that both products will retain this hyperlink even when you export the report to a PDF!
Additionally, SSRS contains a formatting option that Crystal does not have-the ability to define a detail column so that the user can interactively sort on it. In reality, many reports have multiple levels of grouping and pre-defined sort orders that make the need for interactive sorting to be marginal at best; however, other types of detailed listings will benefit from this type of option.
Finally, SSRS allows you to add custom code to reports, either by embedding Visual Basic code directly into reports, or by adding externally created and compiled .NET assemblies. As I stated at the beginning of this article, Rod Paddock wrote an excellent article on this, in the January/February 2007 issue of CoDe Magazine.
Tip 5: Page Control Options
If you’ve ever built reports for insurance companies or financial institutions, you know how important it is to be able to manage page breaks. A client or employer might quickly lose confidence in a reporting solution (or the developer) if they hear a response of, “I don’t know how to do that” or “The report writer doesn’t give me the option of doing that.”
I’ve covered part of this back in the section on Sections and Groups, but this is such an important topic that it bears repeating. Crystal generally provides better support for page control through the Keep Together options for both individual report sections as well as entire report groups. While SSRS allows you to define a page break at the end of a group, it will not conditionally allow you to essentially implement “widow-orphan” protection to ensure that a group or section will fit on a page. SSRS does implement a Keep Together property for the rectangle control, as well as a certain level of page control through the use of subreports, though those who have used the Keep Together function in Crystal are not likely to consider this an elegant workaround.
Tip 6: Global Report Variables and Report Parameters
Most report writers track and expose system variables that reflect the report’s run-time environment. Developers often need to annotate a report with such information as current database, page count, current user running the report, etc. Additionally, developers need the ability to define run-time parameters for the report. Both report products provide these capabilities, albeit in slightly different ways.
Global Variables and Parameters in Crystal
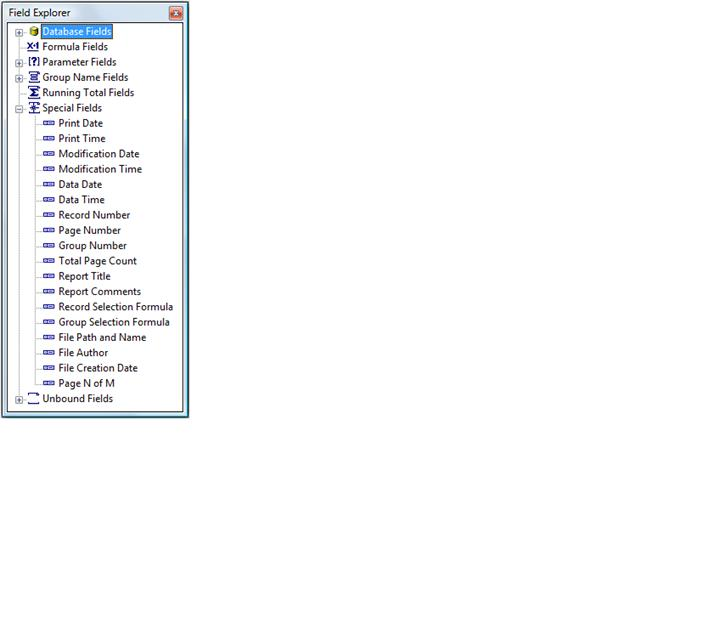
Crystal refers to these as Special Fields. Figure 13 shows all of the Special Fields that Crystal provides. This includes common variables like “Page N of M” for page numbering along with other variables for general report annotation.
Global Variables and Parameters in SSRS
SSRS breaks apart all report variables into the following categories:
-
Fields. All of the columns that are available for the current DataSet. -
Globals. Page number variables, Execution Time, Report Name, etc. Note that you cannot place a page number variable anywhere other than a page header or page footer in SSRS. -
User. The current User ID running the report. -
Parameters. Any parameters you’ve defined for the report. -
ReportItems. A collection of all the report objects in the report-this is very helpful if you want to annotate or reference something from a value of a particular object on the report.
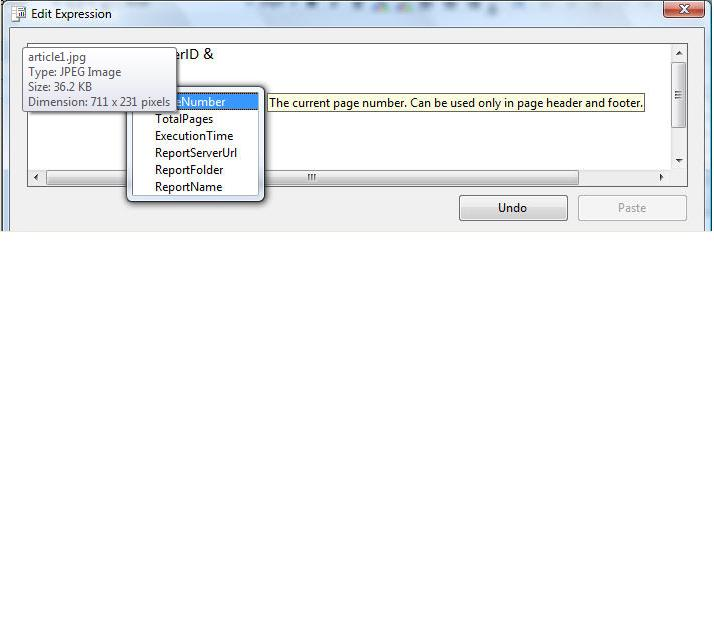
Figure 14 shows the SSRS Edit Expression editor, along with an example that uses IntelliSense to display values from multiple report variable categories.
Tip 7: Subreports
As the name implies, a subreport is a report within a report. Typically you build a subreport when you need to display multiple levels of detail data, and/or when you need to display data from multiple data sources. In most instances you’ll need to establish a link between the subreport and the parent report
Subreports in Crystal
Here are examples where you’d build subreports in Crystal:
- If you build a report component (like a reusable header or footer) and wish to utilize the report as a subreport across many reports. In this case, you would build the report component, and then “insert” the report as a subreport in other reports, and set any necessary data subreport links.
- If you are displaying multiple charts on a page. For example, you might generate a report that shows a line chart and a bar chart for each customer. In this case, your result set would likely contain three tables: one for the customer list, one for the details for the line chart, and one for the details for the bar chart. You would probably create a group on customer, build two subreports for the line chart and bar chart, and establish a subreport link between the customer in the customer list table and the customer in the two chart tables.
- If you are displaying multiple levels of detail (perhaps to go along with charts).
In order to guarantee that subsequent changes to a subreport will automatically cascade to the parent report(s), make sure to check the Re-import When Opening option ON (in the Format Object/Format Editor/Subreports option dialog box).
Subreports in SSRS
At face value, you might think that subreports in SSRS are very similar to Crystal. However, there are some differences.
- You can “nest” subreports in SSRS, which is something that you cannot do in Crystal.
- In SSRS, you cannot insert a subreport into the Page Header or Page Footer area. This makes it difficult to build a common header/footer template.
- In some instances you’ll need subreports in SSRS for situations where subreports would not be necessary in Crystal. You’ll see this most commonly when a stored procedure or Web service returns multiple tables in the result set.
Tip 8: Charts
Both report writers come equipped with charting tools to incorporate business graphs into a report. While you can purchase third-party charting tools for more advanced capabilities, the charting tools in both Crystal and SSRS are often adequate for many business needs.
Charting Capabilities in Crystal
Crystal allows you to add the following chart types: Bar (horizontal or vertical), Line, Area, Pie, Doughnut, 3D Riser, 3D Surface, XY Scatter, Radar, Bubble, Stock, Numeric Axis, Gauge, Gantt, and Funnel.
As I’ve written in prior Crystal articles, building charts is about three things: data, data, and data. Charting engines use data definitions for chart rows, columns, X-axis and Y-axis definitions. So building a complete result set for a chart is often more than half the battle.
Charting Capabilities in SSRS
SSRS supports the following chart types: Column (vertical bar chart), Bar (horizontal bar chart), Area, Line, Pie, Doughnut, Scatter, Bubble, and Stock.
Despite the greater number of chart types in the Crystal list, both tools are very similar in terms of overall charting functionality. Both tools contain chart options dialog screens that are quite similar to charting configuration options in Microsoft Excel and other popular charting tools.
The only notable omission is that SSRS does not support a Gantt chart type, which developers use to provide a pictorial timeline of data.
A final note on charting in SSRS: recently I had to develop a Pie chart where the pie slice labels indicated the % of the total. You can do this by going into “Chart properties…Data…Edit…Point Labels” and then entering the following formula in the Data Label:
-- Assuming a column called Monthly_Sales
-- and assume a DataSet called DataSet1.

= round((Sum(Fields!Monthly_Sales.Value)  /
   sum(Fields!Monthly_Sales.Value,"DataSet1"))
   * 100,2)

-- Note that if your report contained groups,
-- you would replace "DataSet1" with the name
-- of the group.
This reflects SSRS’ occasional lack of direct support for functionality but open architecture for implementing that function.
Tip 9: Drill-down Capabilities
A common request from business analysts is the ability to drill down from summary level data to more detail supporting data. When end users see drill-down capabilities in other OLAP tools, they assume that they should be able to do the same thing in any reporting tool. Both reporting products support drill-down features.
Drill-down Capabilities in Crystal
Crystal supports drill-down capabilities through the Hide property in the Section Expert (refer back to Tip 3 for more details). You can check this option ON for each child level in the hierarchy where you want to implement drill-down.
Suppose you have a hierarchy of region/market/account and you just want to display the region data. You would simply check the Hide property ON in the Section Expert for market and account.
Drilldown Capabilities in SSRS
SSRS supports drill-down through the use of two properties: Hidden and ToggleItem. You set the hidden property to TRUE for each child level in the hierarchy, and you set the ToggleItem property to each child’s parent level.
So again, suppose you have a hierarchy of region/market/account. You would do the following:
- Create groups on region, and market.
- Click on the Row Selector for the Market group tablerow, and set the Hidden property to TRUE and the ToggleItem property to Region (one level up).
- Click on the Row selector for the detail (account) row, set the Hidden property to TRUE, and the ToggleItem property to Market.
Tip 10: Exporting Reports
It’s become very common for reporting requirements to include export capability, with support for PDFs at the top of the list.
Exporting Capabilities in Crystal
Crystal exports to PDF, Excel, Word, and RTF. Crystal also allows you to export a page range, which is particularly helpful if you need to export a subset of a full report.
Exporting Capabilities in SSRS
SSRS exports to the following formats: XML, CSV, TIFF, PDF, Web archive (MHTML), and Excel.
So as you can see, both support PDF export (arguably the most common export). SSRS does not currently support export to MS Word, though companies such as Aspose (www.aspose.com) provide rendering extensions for MS Word and other formats. Crystal does not support export to TIFF, though there are several ways to programmatically incorporate this (such as implementing a custom toolbar option that takes a snapshot of the preview window area to the system clipboard).
Tip 11: Integrating Reports into Applications Programmatically
Eventually, developers will want to integrate reports into applications (either Web-based or Windows Forms-based). Both reporting tools allow you to do so-once again, in different ways.
Programmatic Access in Crystal
Crystal provides a rich API for launching reports in both a browser and Windows Forms environment. I cover the Crystal API heavily in both my book and the January/February 2007 issue of CoDe Magazine. The API is complex enough that I wrote a set of reusable wrapper classes to easily set report data sources and then launch reports. As I mentioned earlier in the article, you can find the library on my site:
www.commongroundsolutions.net\CGSCrystalTools.zip
When moving from Crystal Reports to SQL Reporting Services, be aware of restrictions. Additionally, other tasks may require more work.
As I mentioned at the beginning of the article, the download contains reusable code for setting report data sources, launching a report viewer, printing and exporting, as well as modifying report object attributes on the fly. Again, Listing 1 shows an example of these tasks.
Programmatic Access in SSRS
The methodology for launching SSRS reports within an application is quite different from Crystal. You can programmatically generate reports in SSRS in one of two ways, either by URL or by the SSRS Web service.
- You can specify the URL for the report, including any report parameters. Listing 3 shows some examples of this. The URL string must include the name of the Report Server to which you deployed the report, and then a parameter for the name of the report, and then any additional parameters.
- You can use the SSRS Web service (ReportService2005.asmx) for greater control. You’ll need to add this file as a Web reference to your Web application. Listing 4 shows some examples of using the Web service to retrieve the list of all reports for a specific report folder.
Tip 12: Previewing in Windows Forms or in the Browser
Even with the increasing trend of exporting reports to PDF, many users still wish to view reports on the screen prior to printing or exporting. Crystal Reports provides two report viewers, one for Windows-based applications and one for Web-based applications. The code for previewing reports in Listing 1 applies to Windows-based applications (though the remaining code for setting data sources, printing, and exporting).
As SSRS is essentially an ASP.NET application, users preview SSRS reports in a Web browser, using the SSRS report previewer. The code in Listing 3 and Listing 4 show how to launch SSRS reports.
Additionally, Microsoft supplies a ReportViewer control for Windows Forms applications so that users can view SSRS reports in a Windows environment. The ReportViewer control is a new UI class control in Visual Studio 2005 that renders SSRS reports. In additional to SQL Server stored procedures, you can bind an ADO.NET DataTable (typed or untyped) or custom collection to the report and then preview it using the ReportViewer.
You may find the ReportViewer control to be a godsend if you are trying to deploy SSRS reports in a Windows Forms environment. However, some developers have reported issues with this approach. For example, if you have an SSRS report that uses subreports, you have to write code to hook up an event. Others have observed that the entire process is slower than developing for browser-based applications. You will need to determine if these factors are relevant for your situation.
Tip 13: Cross-Tab and Matrix Objects
Sometimes you may want to create reports with a variable number of columns based on the amount of data in a result set. For instance, you might have a result set of orders by year where the year is a row. You want to display a column for each year, but you may not know at design time how many years the result set will contain. Both reporting products provide functionality to handle this.
Let me walk through a simple example of a result set that contains three columns: Customer, Year, and Sales.
Creating a Cross-Tab Report in Crystal
You can create a Cross-Tab report in Crystal by taking the following steps:
Creating a Matrix Report in SSRS
SSRS uses the term matrix instead of Cross-Tab, though they both refer to the same concept. The steps to create a matrix report in SSRS are very similar to creating a Cross-Tab report in Crystal. Essentially, you must define a minimum of three pieces of information: the data element that represents the variable number of columns for the matrix (e.g. Year), the data element that represents the rows down the left for the matrix (e.g. Customer), and the data element that contains the actual data (e.g. Sales).
Sneak Preview of the next version of Crystal Reports
As I write this article, Business Objects has released a beta version of the next version of Crystal Reports. Here is a bullet list of some of the major enhancements in this version:
- A reduced footprint for the report designer.
- Interactive sorting of report columns.
- Support for Web pagination and an improved Web report viewer.
- Cross-Tab enhancements (ability to add Cross-Tab custom summaries, either repeating or one-time).
- Built-in barcode font support (Crystal now includes Code39 barcode fonts).
- Interactive report parameters (customers can change report parameters on the fly, and the developer can decide which parameters can be modified).
- Ability to define XML export format options.
- Flash integration-you can embed Shockwave Flash (SWF) object inside reports.
- Improvements to the report engine for performance and resource utilization.
Sneak Preview of SQL Server Reporting Services 2008
As I write this article, Microsoft has released the August 2007 Community Technology Preview (CTP) for SQL Server 2008 (codenamed “Katmai”). Here is a bullet list of some of the major enhancements in this version:
- A new report control called Tablix, which combines the flexibility of the report table with the cross-tab capabilities of the report matrix.
- Improvements to the report engine for performance and resource utilization.
- A new hosting model independent of IIS.
- New charting tool capabilities (Microsoft has purchased the rights to the Dundas charting capabilities).
- SharePoint integration to access and manage reports and data sources from a SharePoint site.
Closing Thoughts
Have you ever submitted something (an article, a paper, some code, etc.) and thought of some good ideas AFTER the fact? Well, I’m the king of thinking of things afterwards. Fortunately, that’s the type of thing that makes blogs valuable. Check my blog (www.TheBakersDozen.net) for follow-up tips and notes on Baker’s Dozen articles…and maybe a few additional treats!
Listing 1: Example from CGS.CrystalReportsTools
using CGS.CrystalReportsTools;
using CrystalDecisions.CrystalReports.Engine;


// First, create instance of the report, and the Crystal Manager

RPT_TimeSheet oTimeSheetReport = new RPT_TimeSheet();
ccCrystalManager oCrystalManager = new ccCrystalManager();


// Second, if you want to use generic report annotations
ccReportInfo oReportInfo = new ccReportInfo();
oReportInfo.FtrDataSource = "Test Data Source";
oReportInfo.FtrFootNotes = "Here are my TimeSheet Footnotes";
oReportInfo.FtrRunBy = "Run by Kevin S. Goff";
oReportInfo.FtrVersion = "Version 1.01";
oReportInfo.HdrCompany = "Test Company";
oReportInfo.HdrReportTitle = "Test TimeSheet Report";
oReportInfo.HdrSubTitle1 = "Includes Labor Rates";
oReportInfo.UserID = "KSG001";

oCrystalManager.SetReportInfo(oReport, oReportInfo);


// Third, create instance of Typed DataSet (tha was used at
// designtime)
dsTimeSheets odsTimeSheets = new dsTimeSheets();

// run some process to populate it

odsTimeSheets = SomeMethodToRetrieveData();

// Fourth, push the data into the report (automatically takes
// care of subreports).
oCrystalManager.PushReportData(odsTimeSheets,oTimeSheetReport);


// Now for output options…first, preview
oCrystalManager.PreviewReport(oTimeSheetReport, "My Preview
Screen");


// Method to export, plus overload to export page range
oCrystalManager.ExportReport(oTimeSheetReport, "c:\\mypdf.pdf",
                 ccCrystalManager.ExportTypes.PDF, 1, 2);


// Straight print to default printer, no print options
oCrystalManager.PrintReport(oTimeSheetReport);

// use the print options
ccCrystalPrintOptionForm oPrintOptionsForm = new
ccCrystalPrintOptionForm();
oPrintOptionsForm.ShowDialog();
if (oPrintOptionsForm.DialogResult == DialogResult.OK)
{
oCrystalManager.lCollate =
oPrintOptionsForm.chkCollateCopies.Checked;
oCrystalManager.nCopies =
   Convert.ToInt32(oPrintOptionsForm.
      spnNumPrintedCopies.Value);
oCrystalManager.lAllPages =
oPrintOptionsForm.optPrintAll.Checked;
oCrystalManager.lPageRange =
   oPrintOptionsForm.optPrintRange.Checked;
oCrystalManager.cPrinterName =
    oPrintOptionsForm.cboPrinterList.Text.ToString();
if (oPrintOptionsForm.optPrintRange.Checked == true)    {
     oCrystalManager.nStartPage =
     Convert.ToInt32(oPrintOptionsForm.
                     txtPrintStartPage.Text);
     oCrystalManager.nEndPage =
     Convert.ToInt32(oPrintOptionsForm.
                     txtPrintEndPage.Text);
}
oCrystalManager.PrintReport(oTimeSheetReport);
Listing 2: Syntax to query XML Web service for an SSRS DataSet
<Query>
  <SoapAction>http://localhost/TestSSRSSite/GetData</SoapAction>
     <Method Namespace = "http://localhost/TestSSRSSite/"
            Name = "GetData" >
         <Parameters>
           <Parameter Name="EmployeeID" Type="int">
           <DefaultValue>1</DefaultValue>
           </Parameter>
       </Parameters>
   </Method>
  <ElementPath IgnoreNamespaces="True">
  GetDataResponse{}/GetDataResult{}/
       diffgram{}/MyDataSet{}/MyDataTable{Firstname,LastName}
 </ElementPath>
</Query>
Listing 3: URL access to a SSRS report
// simple URL
string URLAccess = "http://localhost/ReportServer2005";
URLAccess += "?/TestReportFolder/MyTestReport";

Response.Redirect(URLAccess);

// URL to specify parameters and output format

string URLAccess = "http://localhost/ReportServer2005";
URLAccess += "?/TestReportFolder/MyTestReportWithParms";
URLAccess += "&rs:Command=Render&rs:Format=PDF";
URLAccess += "&PrimaryKey=1";

Response.Redirect(URLAccess);
Listing 4: Using the SSRS Web service
// Note: must already have added ReportService2005.asmx
// as a Web reference
using System;
using System.Data;
using System.Configuration;
using System.Web;
using System.Web.Security;
using <a href="http://System.Web.UI">System.Web.UI</a>;
using <a href="http://System.Web.UI">System.Web.UI</a>.WebControls;
using <a href="http://System.Web.UI">System.Web.UI</a>.WebControls.WebParts;
using <a href="http://System.Web.UI">System.Web.UI</a>.HtmlControls;
using RSWebService;

…

// Assumes you've put ReportServer2005 and
// CurrentFolder in web.config

string BaseUrl =
  ConfigurationManager.AppSettings["ReportServer2005"].ToString();
string Folder =
   ConfigurationManager.AppSettings["CurrentFolder"].ToString();


ReportingService2005 oRS2005 = new ReportingService2005();
oRS2005.Credentials =
   System.Net.CredentialCache.DefaultCredentials;

// Get list of all reports
CatalogItem[] oReports = oRS2005.ListChildren(Folder, false);
foreach (CatalogItem oReport in oReports)
   // Can grab the report name, put it in a dropdown list
   string ReportName = oReport.Name;