You've certainly worked with Excel extensively. You know its ubiquity across the modern business world. Excel examples range from debt forecasting and pricing models to enable decision-making to ad hoc accounting reports. I absolutely embrace its versatility, its incredible calculations capabilities, and its stable presence in an everchanging business world. However, it still can instill fear and anxiety of running into potential problems like finding undetectable mistakes in large files or unknowingly using an outdated data set. For those reasons, Excel often becomes the target of ire in the analysis process rather than the users who perhaps incubated the problem to begin with.
You might ask what better options exist out there to manage these large data sets? The answer comes by utilizing Power Query. I'm going to show you how it alleviates many of these concerns by making the entire ETL framework much more efficient and scalable. It's an Excel game-changer.
What Is Power Query?
What exactly is Power Query? It is a tool that sits inside Excel (as well as Power BI) that enables you to automate the ETL process of bringing data into Excel. This query editor extracts data from different data sources, transforms this data, then finally loads it into Excel where you can create additional calculations and modeling. Perhaps more importantly, if you want to repeat this process of bringing in the same data every month, you can refresh the entire ETL framework with the click of a button. Power Query provides the ideal bridge between organization segments because the business will find that it's often an easy process to set up and maintain, and developers in turn can reduce their scheduling obligations to maintain these types of reports.
Where can you get your data from? Power Query probably has at least one connection that works for you (plus many more) including:
- SQL Server
- SAP
- Azure applications
- Amazon Web Services
- Web API queries
Once you connect to the data source, you can then transform the data connection into a useful data set by employing a plethora of built-in query editor interface functions like:
- Trimming spaces
- Splitting a column into several columns
- Creating new calculations
- Grouping fields
- Pivoting to reshape data
After applying these transformation steps, you then load this clean, well-structured data table directly into Excel. Concerned about a data update later today that could change all your numbers? Simply refresh the entire ETL framework with the click of a button.
Power Query allows business users to develop reports with current technology that uses no code, and it allows developers to create something tangible for the business side. It's easy to access, requires very little coding, and is easy to refresh. It's a scalable solution that can keep up with the demands of your organization without requiring a massive investment of time and energy to set up the process that you would face with a larger solution like setting up the data in an enterprise-wide database.
Our Challenge: Converting Currencies
Let's say you work for a company that does business in both the US and the European Union. In addition to worrying about differing rules and laws for business in multiple countries, you also need to worry about the conversion rates between these two monetary regions. Let's say, for the sake of this project, that you want to convert these currencies into US Dollars for your financial reports.
You need to obtain the currency data first, and you can get it from the Federal Reserve of Economic Data (FRED) for St. Louis, a free resource that allows you to not only view the trends for key economic and finance data, but also download it or connect to its API. Here's the link to the FRED webpage (Figure 1): https://fred.stlouisfed.org/series/DEXUSEU
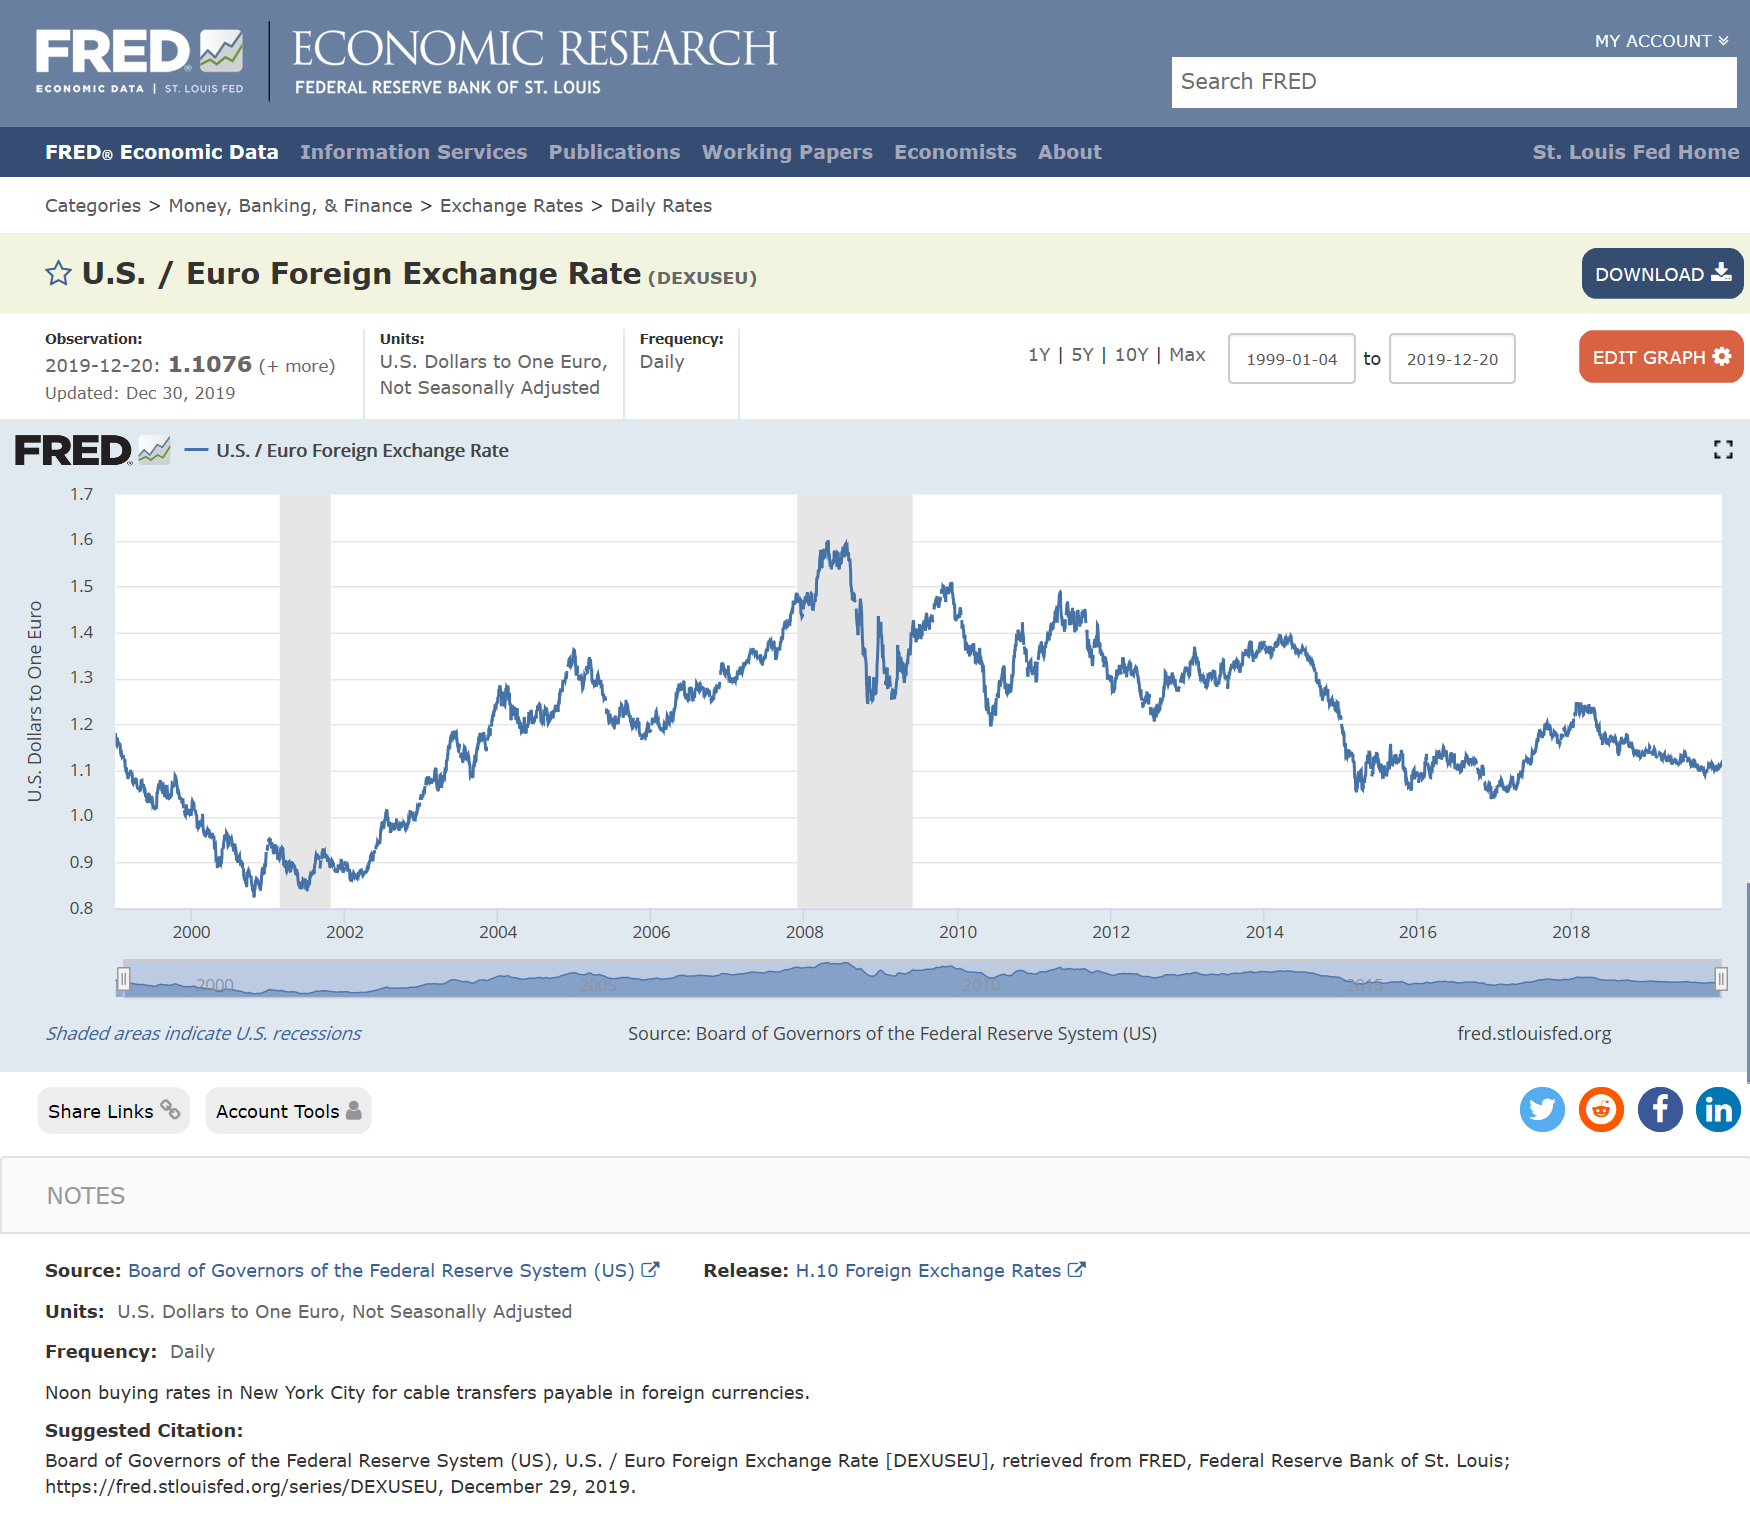
Remember that you want to make the process of getting data more efficient. Downloading the data before connecting to it adds steps to the process rather than reducing them, which in turn increases completion time and the potential for making mistakes. There's not typically one right answer to solving a problem but using the FRED API is both easy to set up and refresh in future months.
Before you jump into working in Excel, you need to first get access on the FRED website:
- Navigate to the FRED account sign-up page to get your own account if you don't already have one. Remember your username and password; you will need them later to configure your sign-in credentials in Power Query.
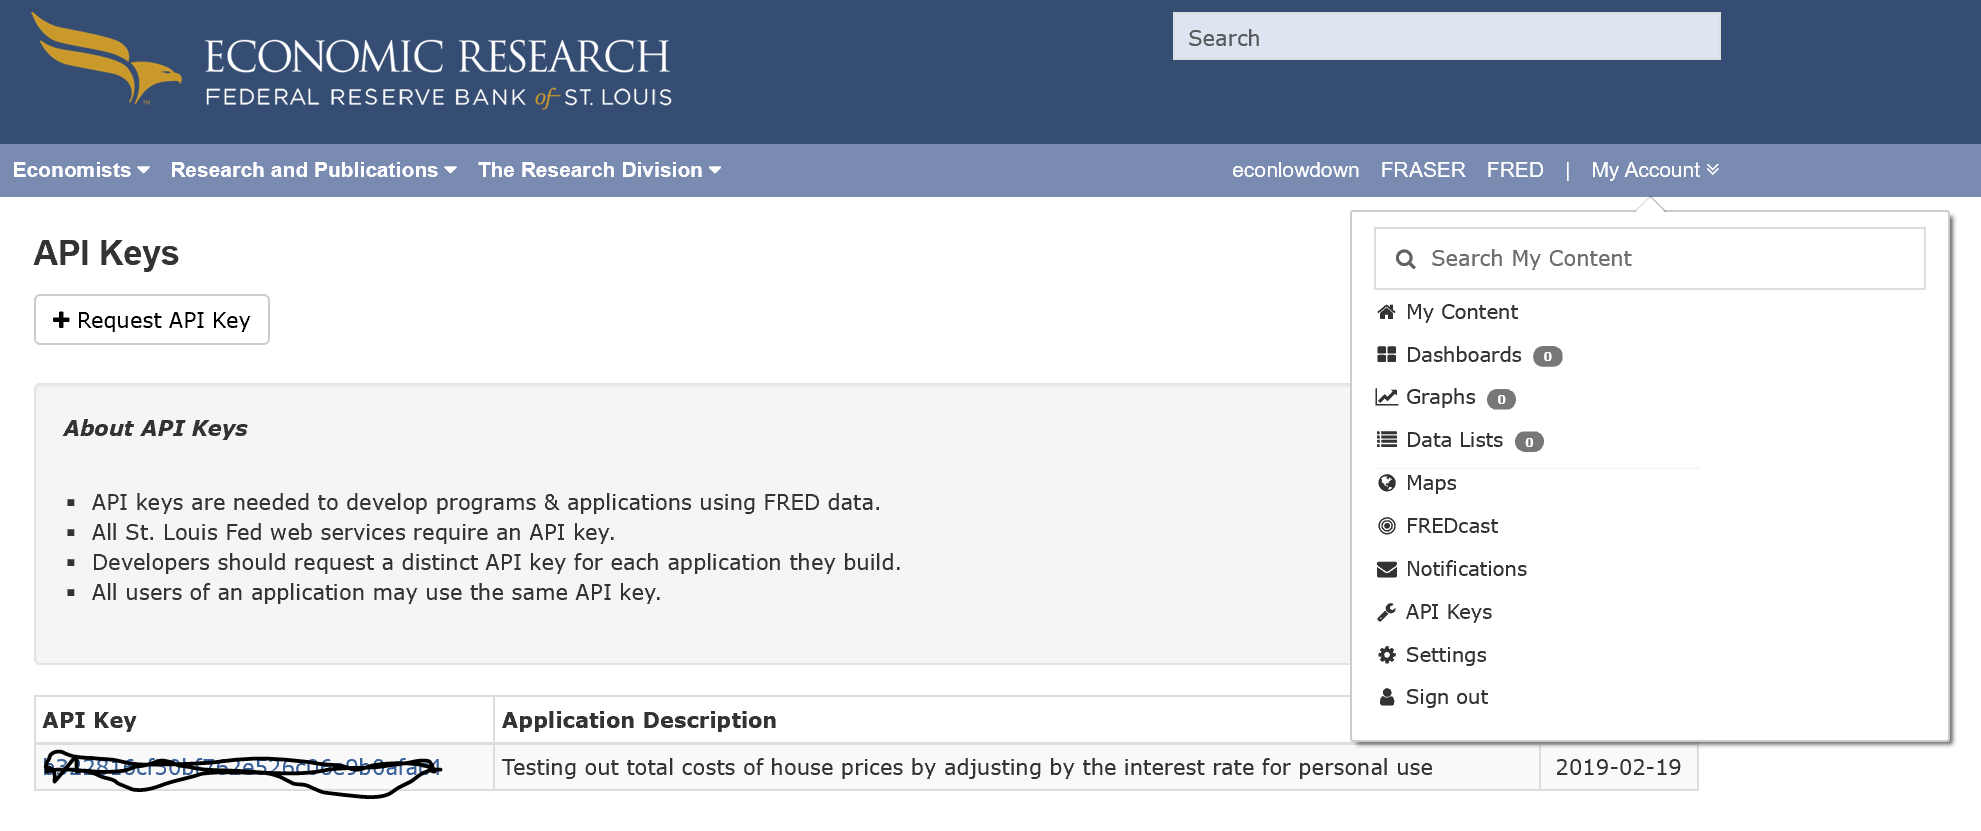
- Because you'll be using the API query connection to the FRED data, you'll need to sign up for your own unique API key through the API menu and requesting a new key (Figure 2). Once you add this API key, you'll see it appear on this page.
Accessing Power Query
For those familiar with Microsoft's Power BI Desktop, you know that initially opening the application immediately prompts you to select your data source. After selecting a data connection type, it takes you into the Power Query Editor to begin the transformation process and add any additional queries. Excel offers similar ETL capabilities in its own Power Query Editor. Unfortunately, when you open Excel, it doesn't prompt you to set up a data connection, and thus few business users even know this incredible tool exists.
To access Power Query in Excel:
From the Data menu, choose the Get Data menu item.
You will next see the prompt to choose your data source from a large array of data connectors, such as SQL Server, another Excel file, or a Web connection. You can also select Launch Power Query Editor.
Note that you can only access Power Query in the later Excel versions, so for those of you working with earlier Excel versions, you must update to a later version! Once you create a new query and load it to Excel, you can open Power Query again by going back into the query editor. You can also refresh the data directly in the Excel interface without opening the query editor.
Making Power Query Work
You want to create an elegant ETL process in Power Query to first bring in the data, then later refresh it with a single button. You'll just see just a few key concepts within the Power Query capabilities in this example. When you create your own queries, you can leverage many more existing functionalities.
Step 1: Extract the Data
For this project, you're going to obtain the FRED US-Euro exchange rate data by querying the FRED API. This API connection works with a lot of data series, and it's also quite straightforward to configure. You set up the FRED API query as a single URL string comprised of three components: the API endpoint, the query parameters, and your own unique API key. I typically test out API connections and queries in a resource like Swagger Inspector (Figure 3). Although Power Query is an incredibly useful tool for working with data, it's unfortunately not a compiler and doesn't give much feedback on errors, unlike tools like the Swagger Inspector. Remember to replace the sample API key from the documentation with your own unique API key. From the FRED website, you can learn more about how to set up these queries in the API documentation webpage. Here's a link to try your own API key: https://api.stlouisfed.org/fred/series/observations?series_id=DEXUSEU&api_key=yours
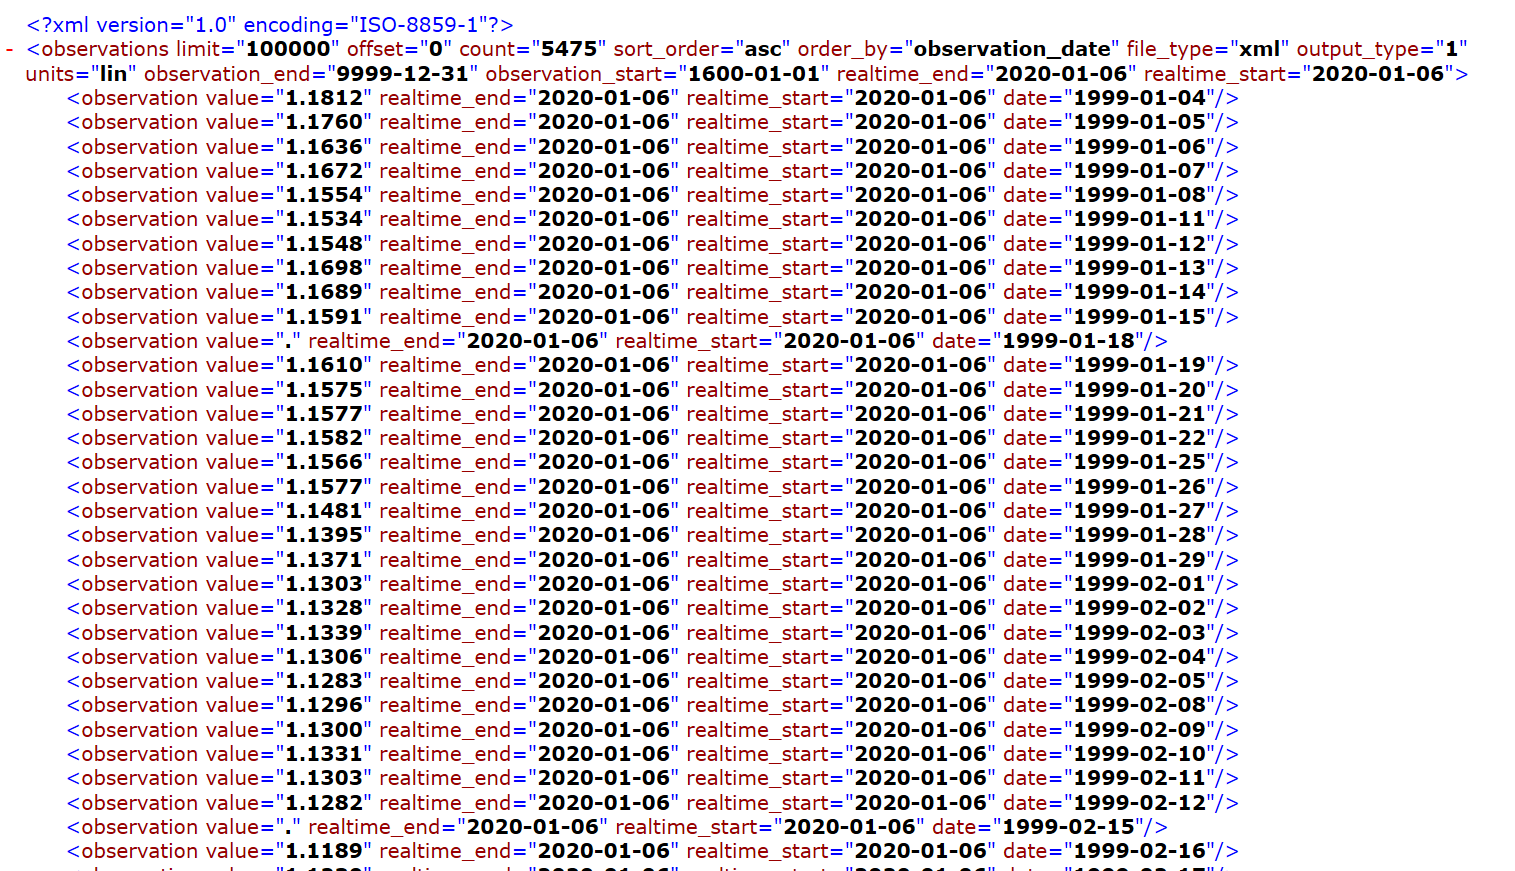
You may recognize the format of the API query results as the XML data structure. Power Query can handle API query results returned in many different other formats as well, such as JSON data structures. There are limitations for connection to Web data like this in Power Query, but it's an efficient tool to create a simple API connection like this.
To configure the API query connection in Power Query:
As part of the extract process, you can set up log-in credentials specific to the FRED website because the API query only works with an active login. Passing these credentials into Power Query enables you to refresh the entire query without logging into the FRED website. Here's how:
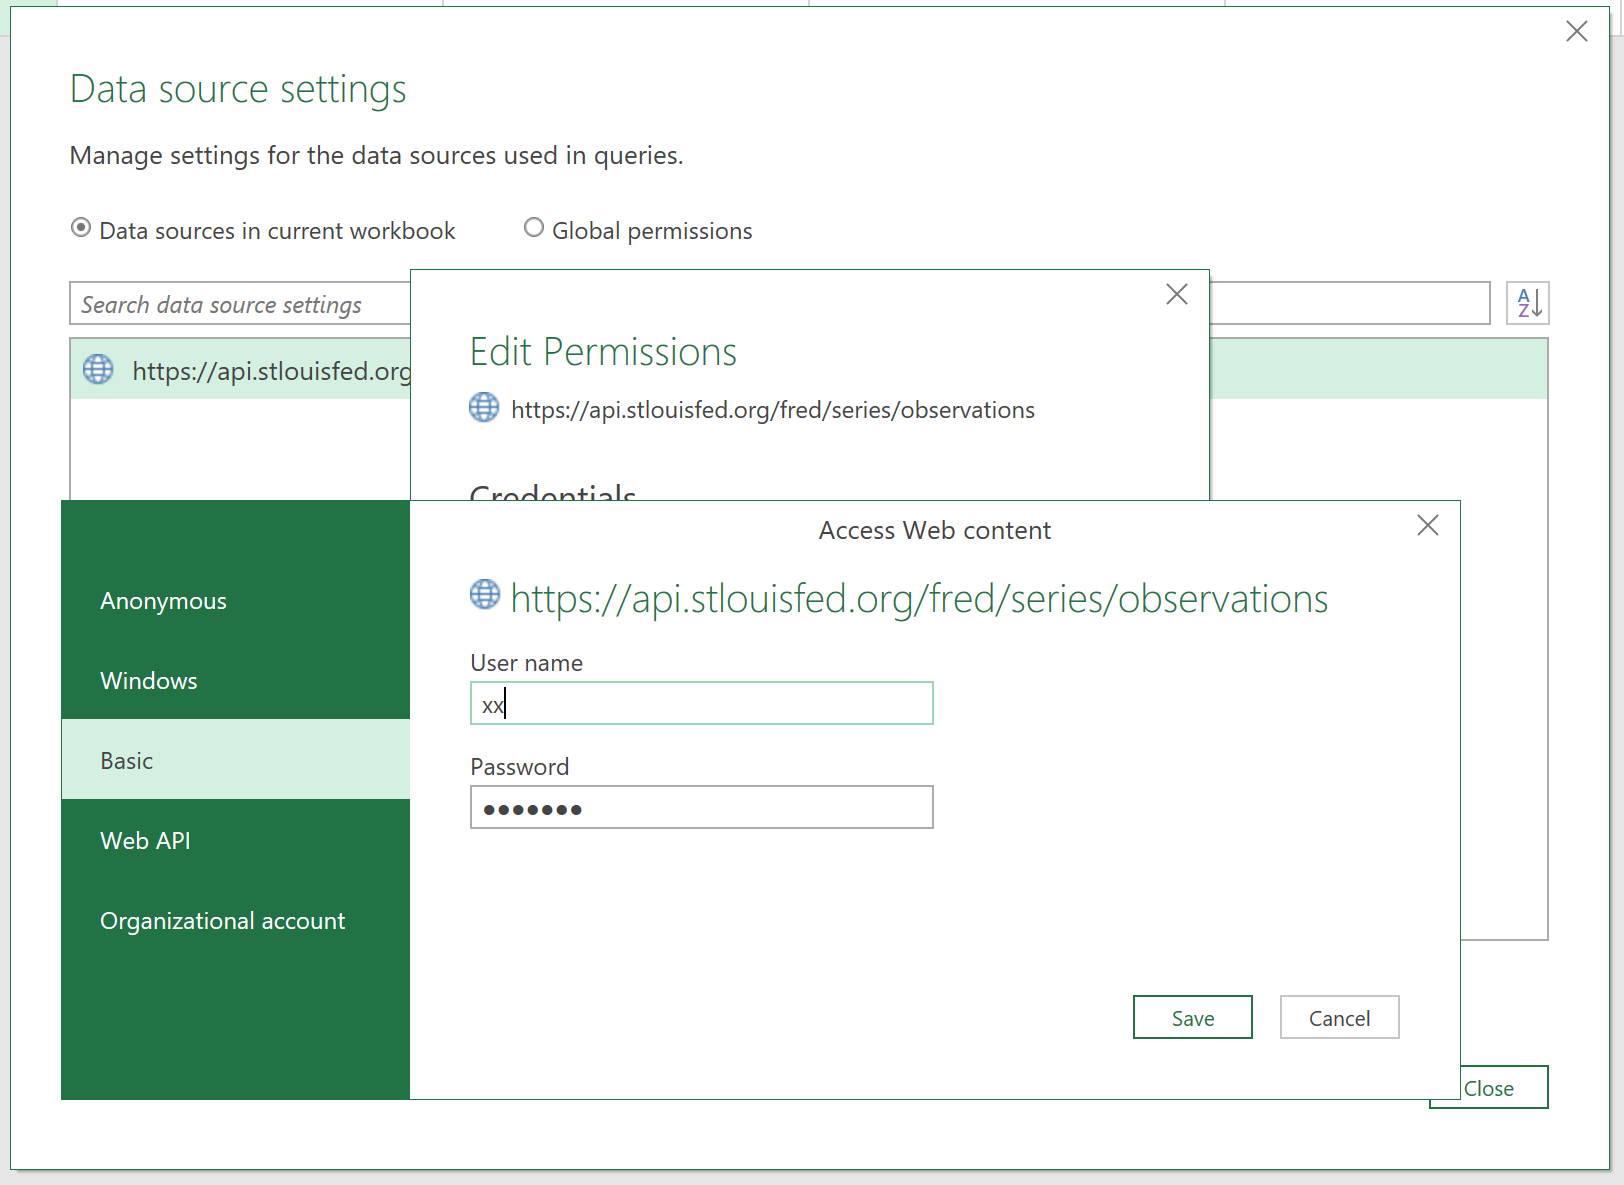
- Select the Source Settings option, which opens a new window.
- Select the FRED API query to edit the query permissions.
- In the Basic authorization selection input the username and password for your FRED account (Figure 5).
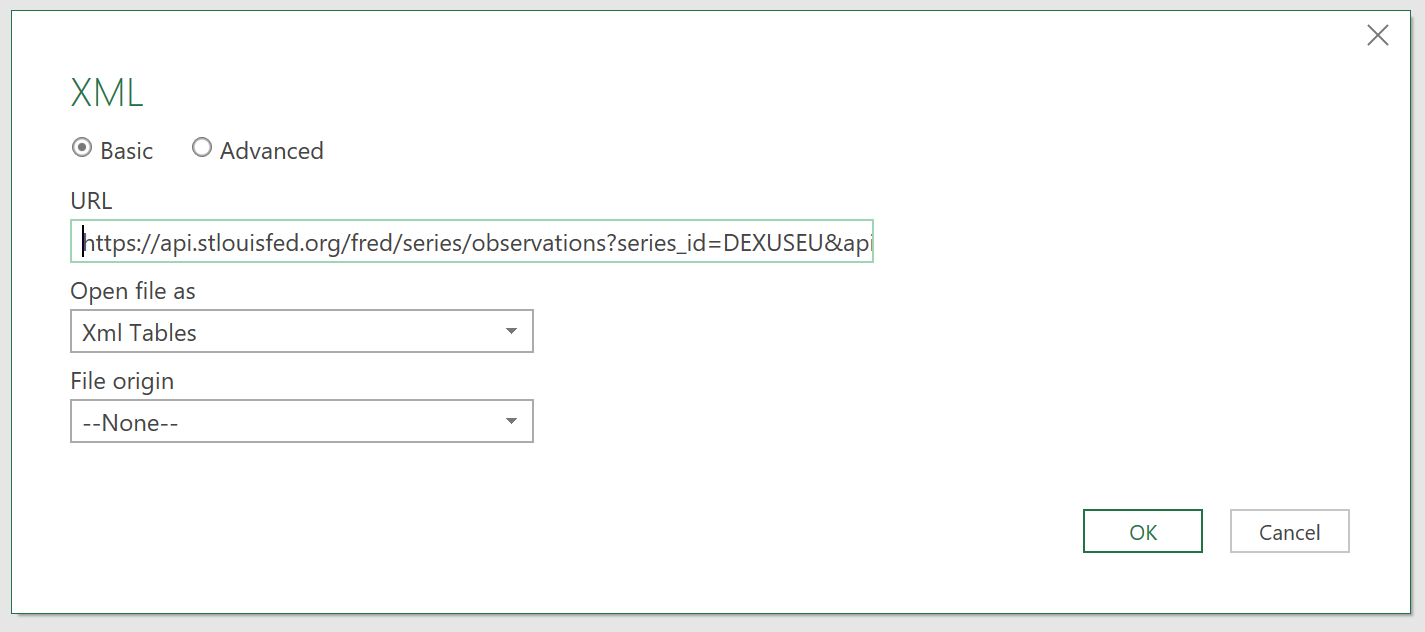
After setting up the connection, you see the query results in the middle of the screen. On the left side, you see a query list where you can add additional queries. On the right side of the screen, you see the applied steps, which will tell you the functions you perform on the query during the ETL process. You see a Source step automatically added to these applied steps list. Double-click on the gear wheel next to the step name, which opens the source connection details you see in Figure 5. Power Query uses a bit of AI capability to determine on its own to read this Web connection in the XML data structure. Why, then, don't you see the results returned in a structured table format? You'll see in the next step how to transform this initial connection into a useful data table.
Step 2: Transform the Data Connection
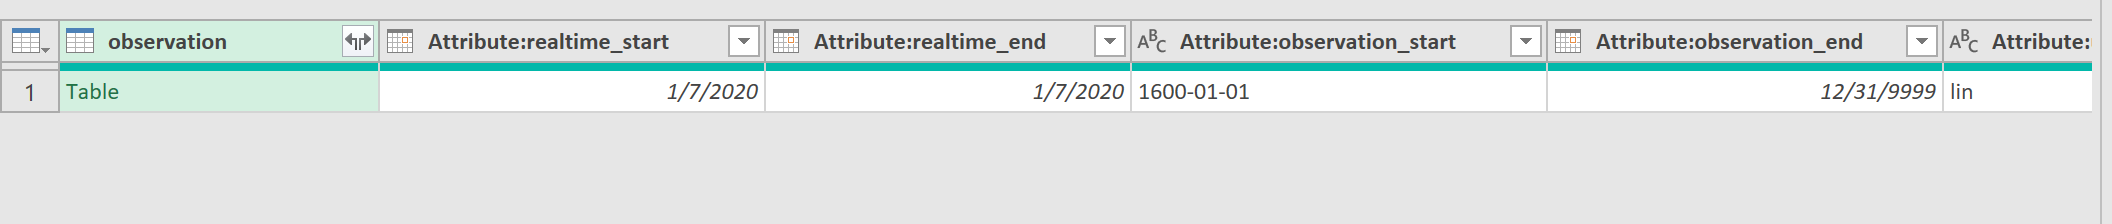
Power Query returns the API query results in the XML structure format with a single record or row of data consisting of several columns providing the connection metadata, as you see in Figure 6. Although the metadata provides key information about the data, like time stamps, you want to focus in on the Table hyperlink in the observation column, which represents a Power Query table object. Power Query objects consist of a combination of variables, functions, and data structures. They enable transformation capabilities such as drilling into or expanding data tables. In this example API query, the table object represents the data returned from the API query in the XML format.
If you work in Power Query a lot, you'll encounter table objects frequently and will find them immensely useful. You can access the data in table objects in a few different ways:
- Click into the Table hyperlink, which enables you to drill directly into the table. Notice that you no longer see the metadata columns in this view and you instead see the rows and columns with the table object you just drilled into.
- You will also notice a diverging arrow button next to the column name. Choosing this button opens a selection menu to select the columns to expand within the table object. Because you're not drilling into a single table object, you can still see the metadata in the view. For queries returning multiple records with table objects, expanding the table objects retains all the data in each table object, and not just the data in a single table object.
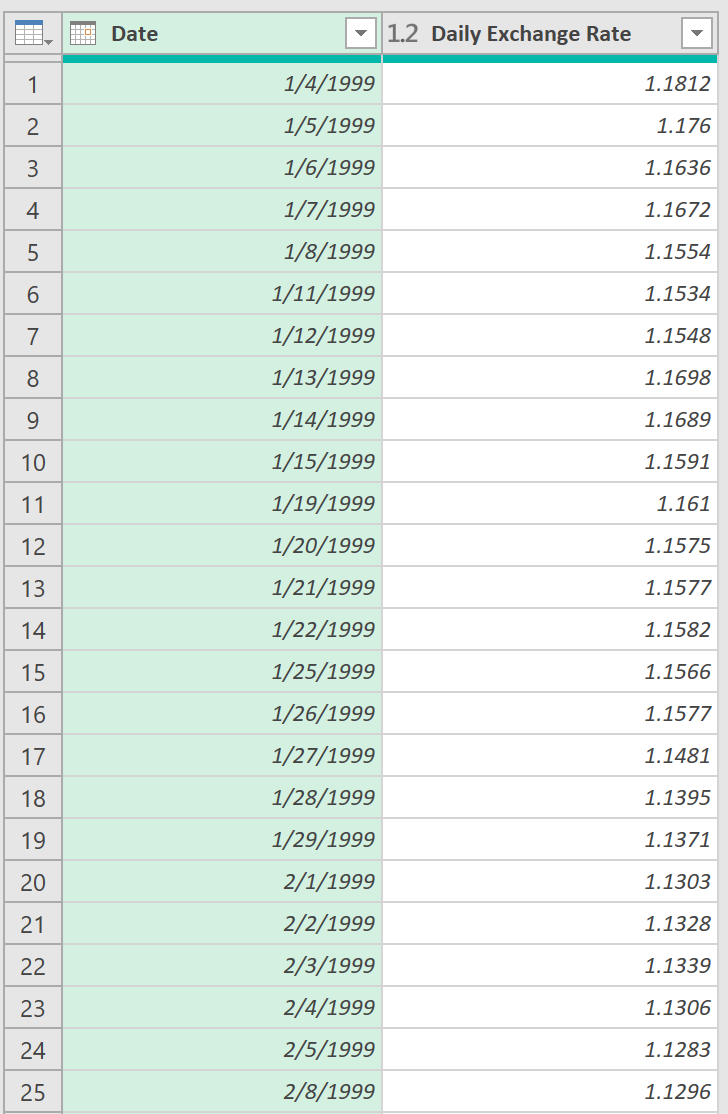
Drilling into the table object transforms the returned API query data into a readable data format, with four columns in this new view. You see a new applied step on the right side of the screen. Of these four columns, I only want to keep the attribute columns for the date and value because the other columns serve as metadata rather than useful data. You can select the first two columns at the same time and delete them together. You can then rename the columns to date and monthly exchange rate respectively to make it more readable. Power Query also gives you the capability to make changes to a previous step that ultimately update the rest of the query. If you select the step before the step to change the data type, you see that these rows throwing errors use a period in place of an empty field to represent closed markets on holidays. When you attempt calculations with this data later, you'll run into problems. To remove the errors from this field, select Remove Errors from the menu in the field name, which gets you to the updated data set (Figure 7).
In this query, each applied step takes the result from the applied step before it and applies the current transformation step on top of it. If you open the Advanced Editor, you can see how Power Query applies these transformation steps through the functional M language by automatically writing out the steps. You can create some impressive custom queries with a little background knowledge of M. Start by first slightly tweaking the existing applied steps in the Advanced Editor, and then transition to creating more complex M code.
Step 3: Aggregate the Calculations
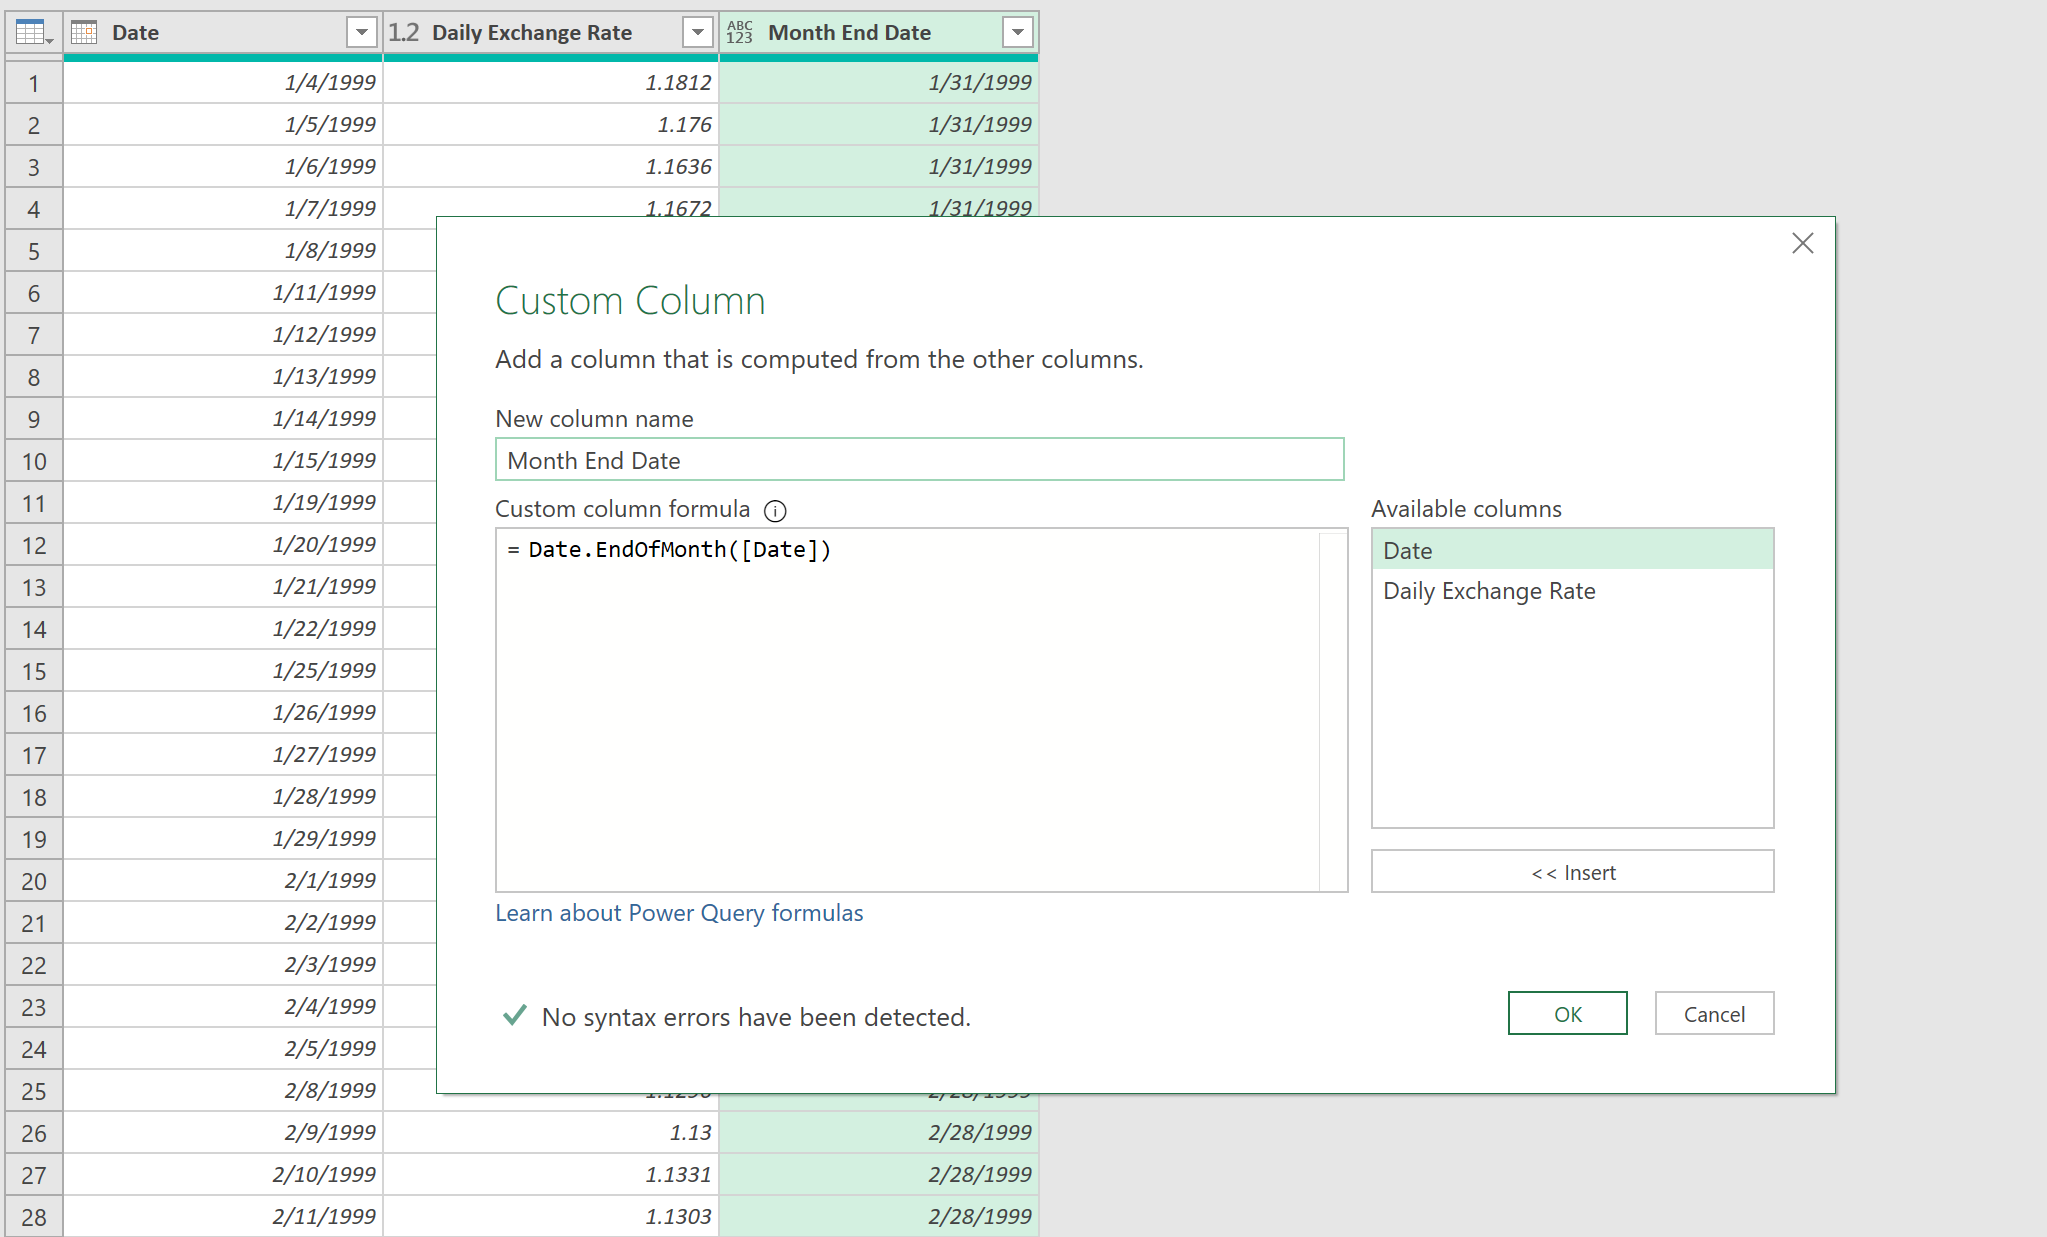
You can change the shape and orientation of a data table by leveraging several existing functionalities in the query editor. The grouping functionality lets you determine a field in the existing table to configure as a dimension in the new table shape. You can aggregate a numeric field by summing, averaging, or counting it over the grouping dimension. Let's say that you want to calculate the average exchange rate for the entire month rather than the daily exchange rate. Before applying the grouping functionality, you first create a new column for the last day of the month for each existing date. Select to add a new column to the data table, then enter the formula to reference the existing date field you see in Figure 8.
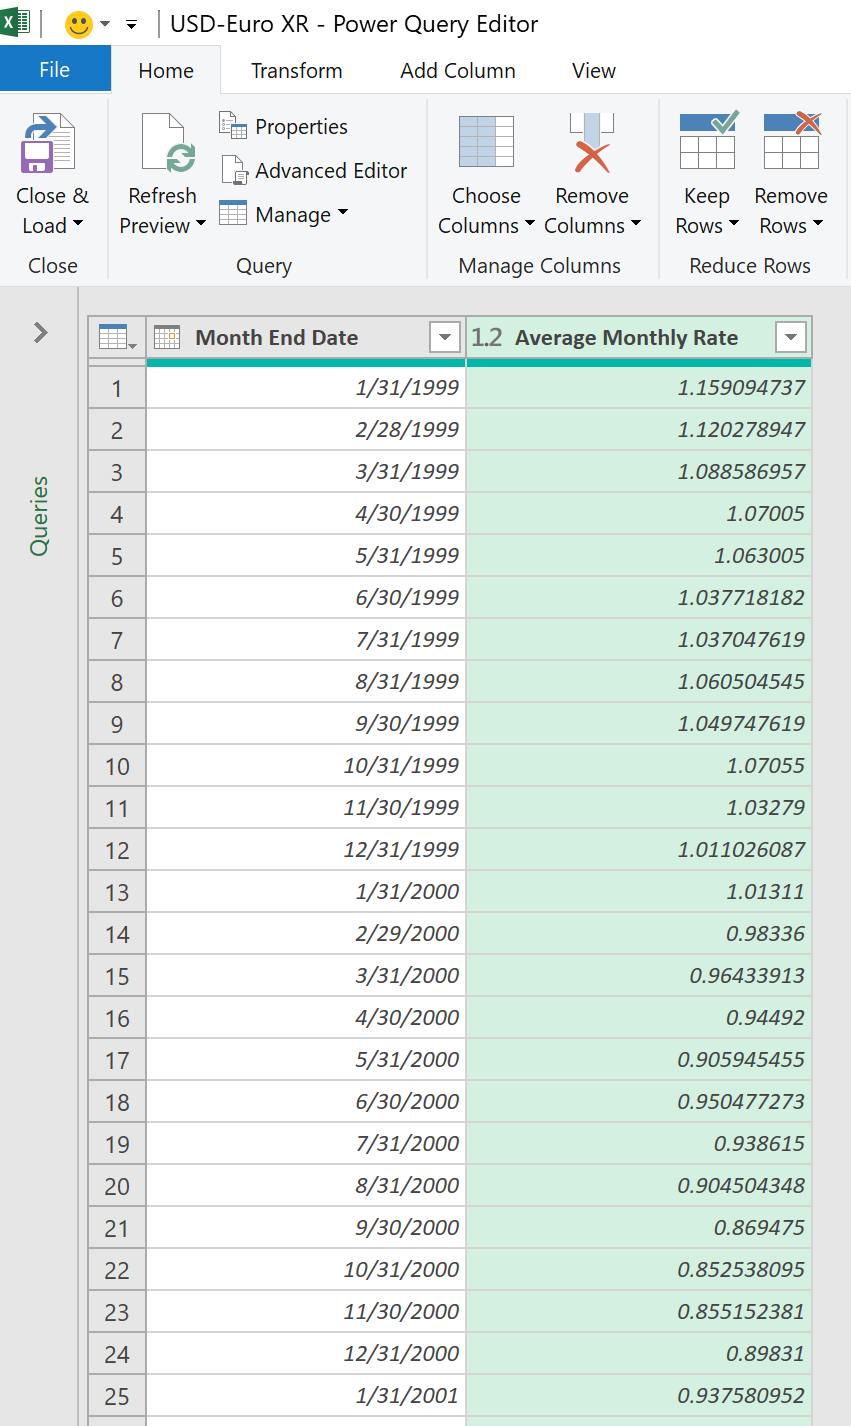
Now you can group the data with the new date field. Select the Group By functionality from the top Transformation menu. In the dialog box group, use the Month End Date as the dimension in the dropdown menu, then create a new column named Average Exchange Rate by choosing the Average Operation from the dropdown menu to calculate using the Column of Daily Exchange Rate. In setting up this simple grouping, the query editor returns a table in a consolidated shape with two columns: the last day of the month column and the new average currency rate for the entire month (Figure 9).
You notice that this data grouping loses much of the initial data granularity. What if you wanted to calculate the average monthly exchange rate, but keep the daily exchange rates as part of the data table? To achieve this desired outcome, you will need to leverage the capabilities supported in the advanced grouping options.
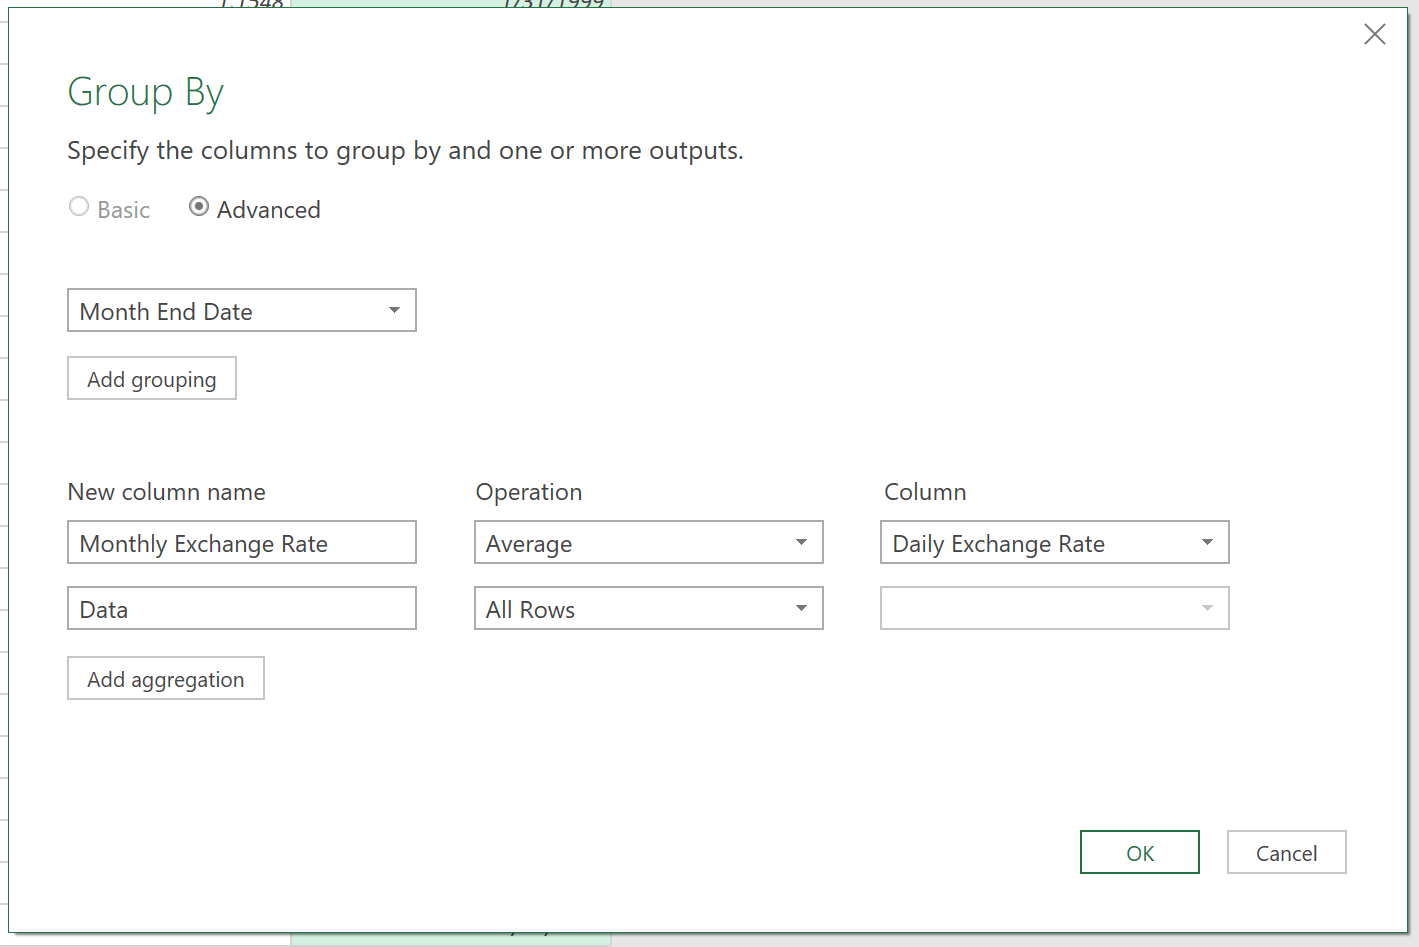
Notice that the Grouping applied step in the query editor has a gear wheel icon next to the step name. Double clicking on this icon takes you back into the grouping configuration. This time, you want to select the advanced options, which enables you to set up more complex grouping configurations. Keep the date field from the existing configurations, as well as the aggregation for the average exchange rate. Since you want to return both the average monthly rates and daily exchange rates in the same view, you want to add a table object to each month that contain the daily rates. To do so, select to group All Rows, name this field Data, and notice that it doesn't allow you to choose an aggregation because you're returning all the rows (Figure 10).
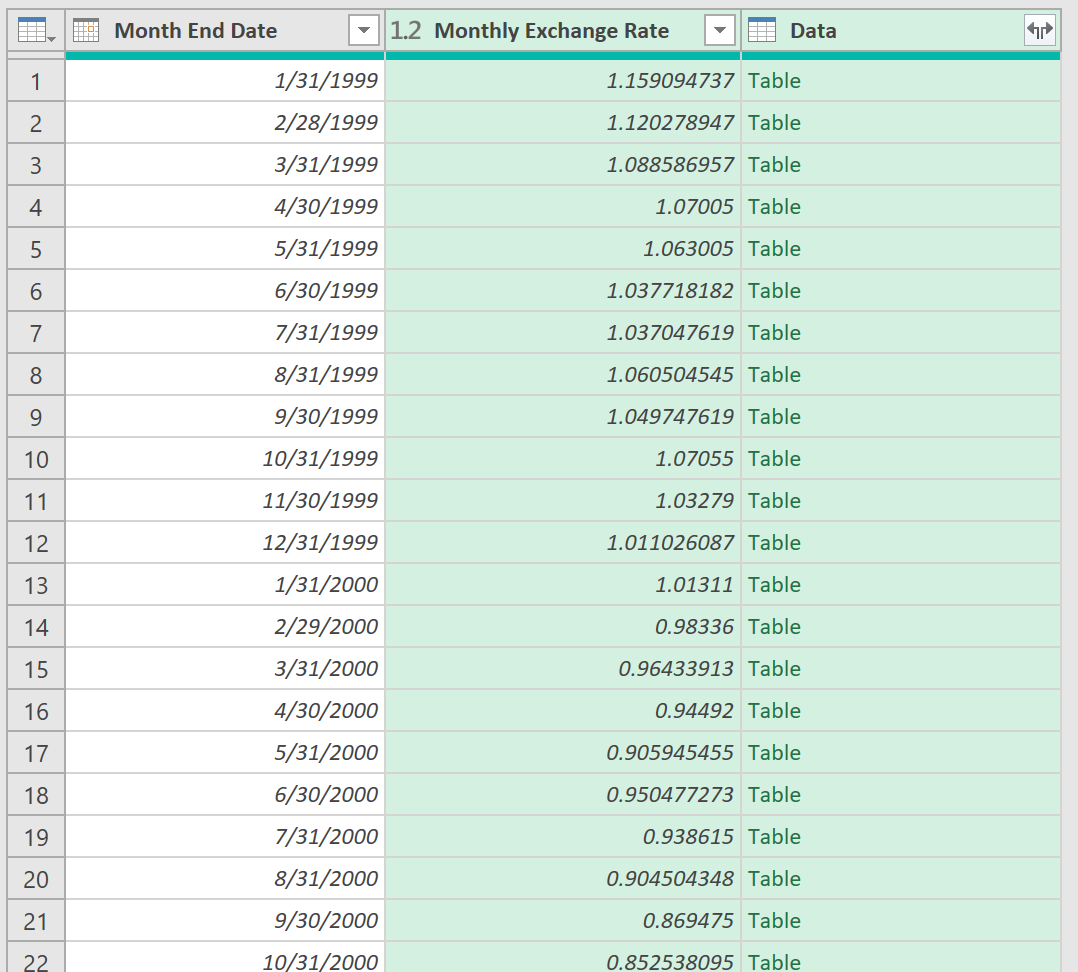
After confirming this selection, you'll notice that the resulting data table (Figure 11) looks like the monthly average rates, except you now see that the last column contains rows consisting entirely of table objects associated with each month's end date. Think of this as a table of data attached to each of the month end dates and their respective monthly average rates. When you expand out this new Data column containing table objects, you combine the two columns of monthly aggregated data with each of the rows and columns contained in the table objects connected to the same date range, which gives you two rates for each monthly date.
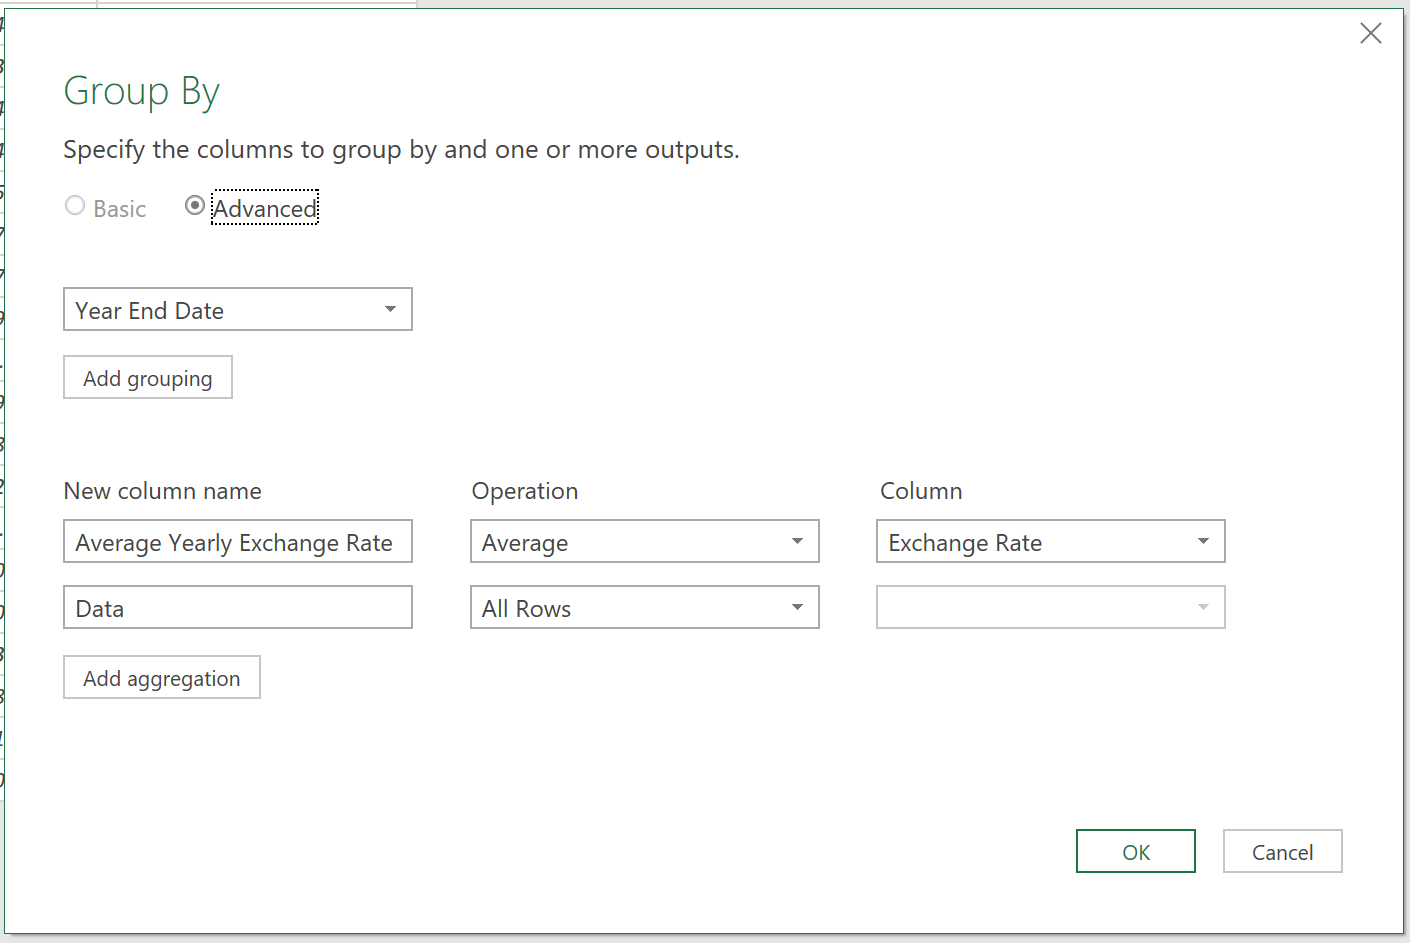
As an added challenge, you can add another calculation as a new grouping, this time for the year's end. You need to first create a new field for the year-end date using the same formula as Figure 8, except changing the Month piece to Year in the Date function. You then add another grouping to the transformation steps that uses this year field as the grouping dimension, calculates the yearly average rate instead of the monthly average rate, and finally creates new table objects for each row that contain both the average monthly rates and daily rates (Figure 12). You then expand out the Data field for the new grouped table.
Step 4: Load Data to Excel
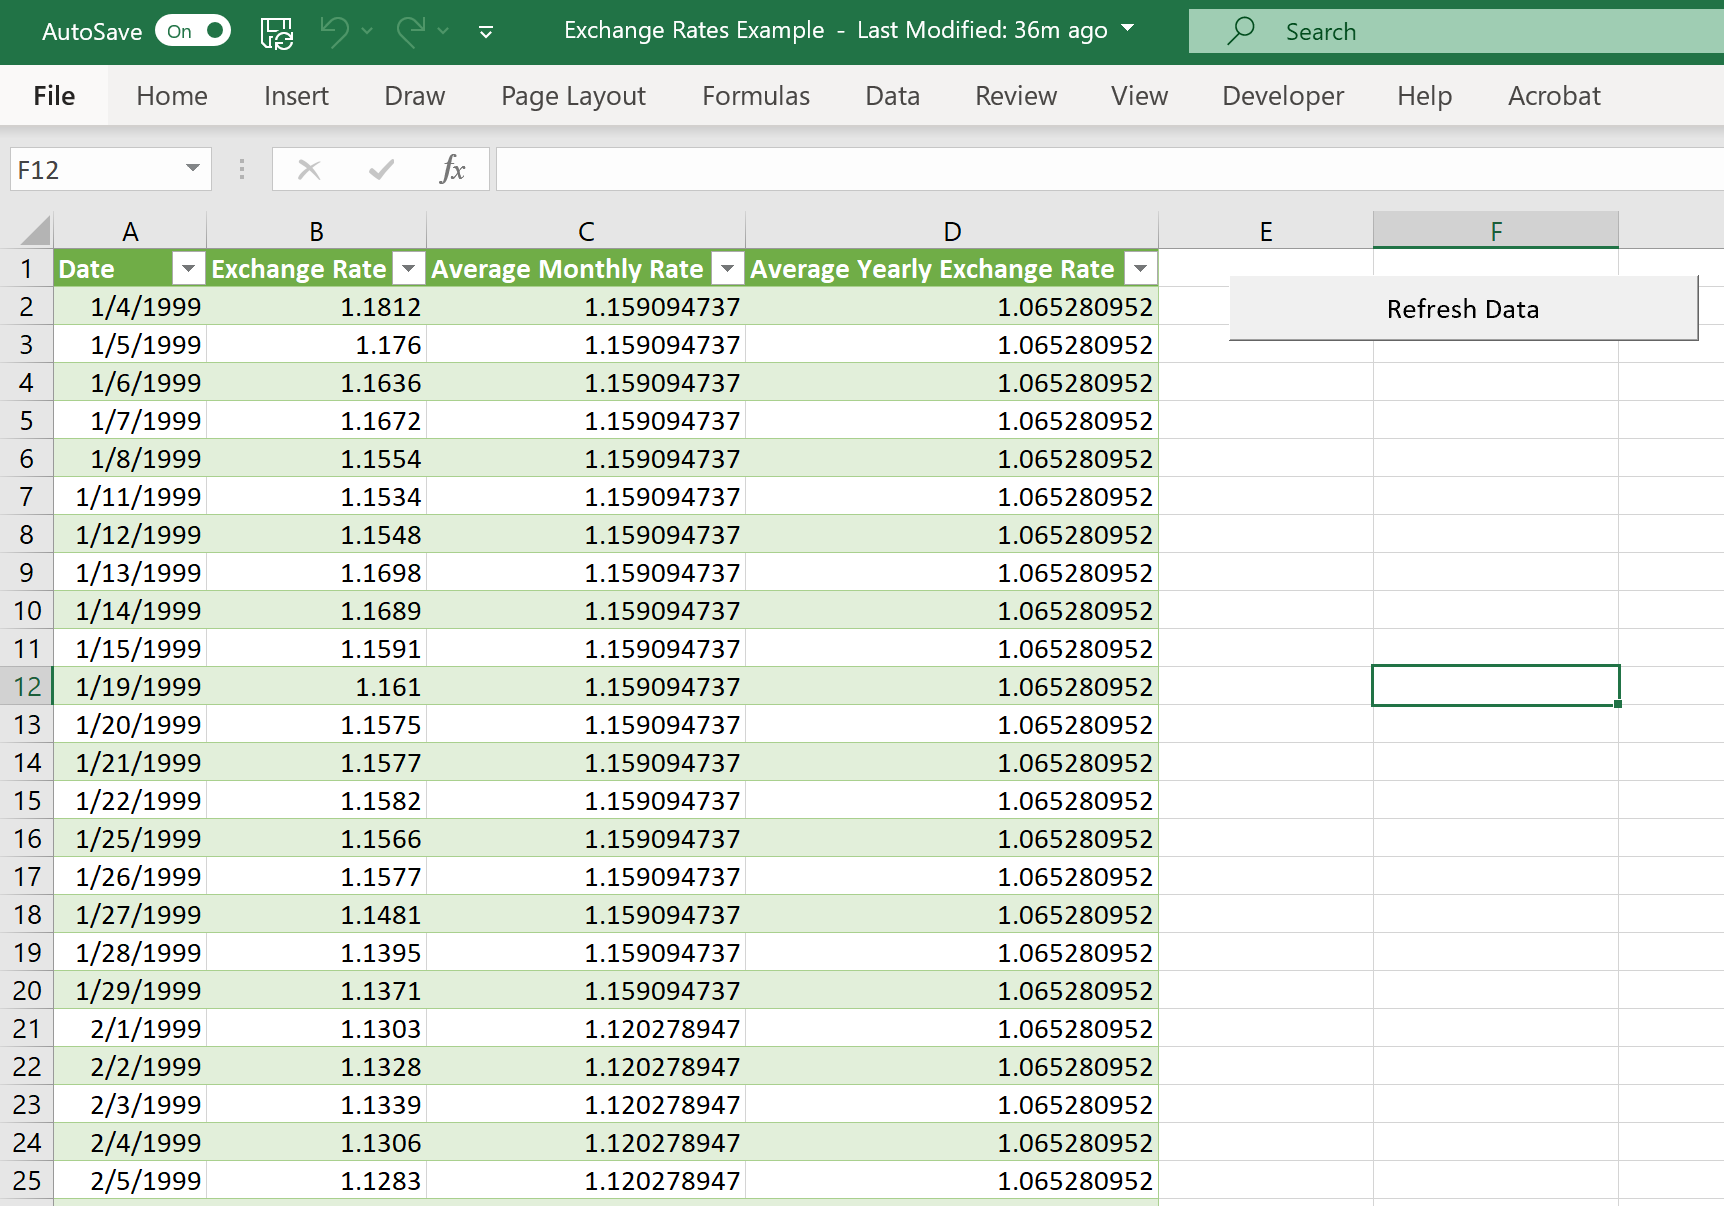
After creating this data table, you can remove all the date fields except the daily date (Figure 13. Lastly, you load the data to Excel (you can also load this same query into Power BI). Although you can theoretically load just over a million rows to Excel, this wouldn't be ideal because loading that much data severely impacts performance and fewer than 60,000 live calculations.
Step 5: Enable the Users to Refresh Data
Finally, you want to make your Power Query work accessible to others. You don't want to update this file yourself every month, especially if you can avoid it. How, then, can you configure it as a user-centered process with the end business user in mind? You passed your FRED credentials into Power Query with the username and password. By sharing your file with others, they won't see your private log-in information, but they can refresh the query on their own computer.
To refresh the queries, you can either go back into Power Query to manually refresh the data, or you can manually refresh it with the refresh buttons within the Excel file. Although you or I may view this as the perfect bridge between the Excel view and the data in the API query, remember that business users may not have the same comfort with updating queries this way.
You can use a VBA macro to create a refresh button that the user can select to automatically update the queries directly in Excel. I'll be the first to admit I'm not a huge fan of VBA. One of my pain points with VBA is that it still doesn't mitigate the risk of making easy mistakes that are difficult to correct. I do, however, like adding a button to the screen if it means that the business users will continue to reference my work in the long run.
This is done in two parts: First create the macro, then add a button to automatically refresh the data. Of course, you'll find a few more specifics in the process of setting it up, but you get the idea. Start from the Excel file view with a single sheet of the exchange rate data.
In the top ribbon, go to the Developer tab and open the Macros menu on the left.
In the VBA window now open in the view, select your file name, which should have the prefix VBA. Right-click and select Insert Module from the drop-down menu.
A new window opens where you can copy and paste the code below into the window to enable you to run a macro to update the Power Query data. Closing out the window saves the VBA code.
Public Sub Refresh()
    ' Macro to update my Power Query script(s)
    Dim lTest As Long, cn As WorkbookConnection
    On Error Resume Next
    For Each cn In ThisWorkbook.Connections
        lTest = InStr(1, cn.OLEDBConnection.Connection, "Provider=Microsoft.Mashup.OleDb.1", vbTextCompare)
        If Err.Number <> 0 Then
            Err.Clear
            Exit For
        End If

        If lTest > 0 Then
            cn.Refresh
            Next cn
        End If
    End For
End Sub
Once you set up the macro to update the Power Query data, you can now turn your focus to adding the elusive update button next to the data, easily within view.
- Select the Insert drop-down menu from the Developer tab of the ribbon and select the rectangle shape from this drop-down menu.
- Drag this shape to the data table sheet where you want to drop it. I put the macro update button to the right of the data table to make it easy for the user to see immediately when they open the Excel file.
- When you let go, Excel prompts you to assign a macro to this button, so select UpdatePowerQueries.
- Select the text on the button to rename it something meaningful, like “Refresh Data”. To double check that the button works, hit the button and make sure that it now includes any new records. Of course, if you create this entire project in the span of a single day, you won't see any new records on the same day, but you can return to the file the next day to check.
There you have it! In Figure 13, you have a smartly built, yet simple to set up and understand business solution that makes everyone's life easier. If you're interested in learning more about how Power Query works, you can check out my Power BI Data Methods course in the LinkedIn Learning library. Yes, it's a subscription service, but it does offer a lot to the customers!