
On the Visual Studio team, we're laser focused on the developer's inner loop of writing, debugging, and testing code. It's the most important part of making developers productive. Visual Studio 2019 is packed with tools to make your workflow more efficient. In this article, we'll cover our favorite new features in Visual Studio navigation, debugging, code fixes and refactorings, code cleanup, and much more!
Shell and UX
The first thing you might notice in Visual Studio 2019 is the more purple shell color. This helps distinguish Visual Studio versions when you use side-by-side installations. You also don't want to miss the improved Visual Studio search experience and solution filters.
Side-by-Side Installation
The Visual Studio installer enables you to install different versions of Visual Studio side-by-side on a single computer. If your team uses an earlier version of Visual Studio and you want to try out all the latest features in Visual Studio 2019, you can do that with side-by-side installation.
Visual Studio Search
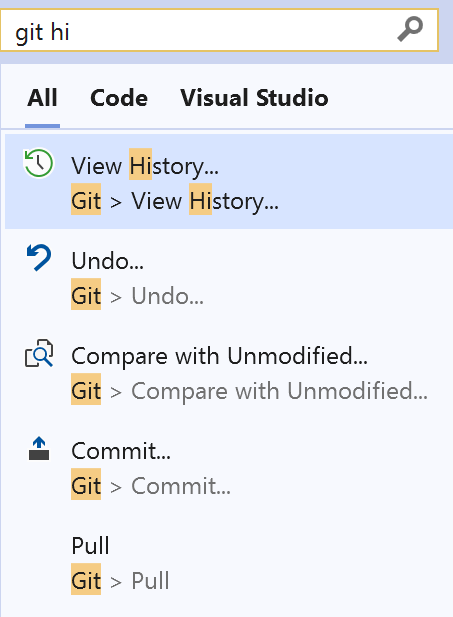
We improved search efficiency and effectiveness in Visual Studio 2019. You can access Visual Studio search with (Ctrl+Q), which places your cursor in the search box in the top center of the Visual Studio shell. More parts of Visual Studio are now searchable including improved accuracy for menus, commands, options, and installable components. We've also added code search so you can easily find types and members with C# and Visual Basic, as well as file search for all languages. Figure 1 shows the Git commands now indexed in the search.
Solution Filters
How many times have you been stuck waiting for a large solution to load with many projects when you only wanted to work in a small subset of those projects? To improve performance when opening large solutions, Visual Studio 2019 introduced solution filters.
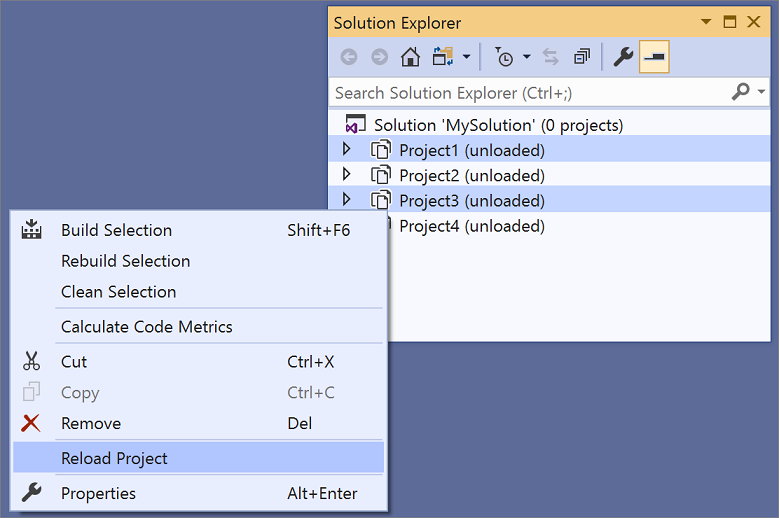
Solution filters let you open a solution with only selective projects loaded. Loading a subset of projects in a solution decreases solution load, build, and test run time, and enables more focused review. This helps you get to code faster by opening a solution without loading all or any of its projects. After the solution opens, you can selectively choose which projects to load. When you reopen a solution, Visual Studio remembers which projects were loaded in your previous session and only loads those projects. You can create a solution filter file to save one or more project-load configurations or share the configuration with teammates.
You can open a solution without loading any of its projects directly from the command line, as well as the Open Project dialog, as shown in Figure 2.
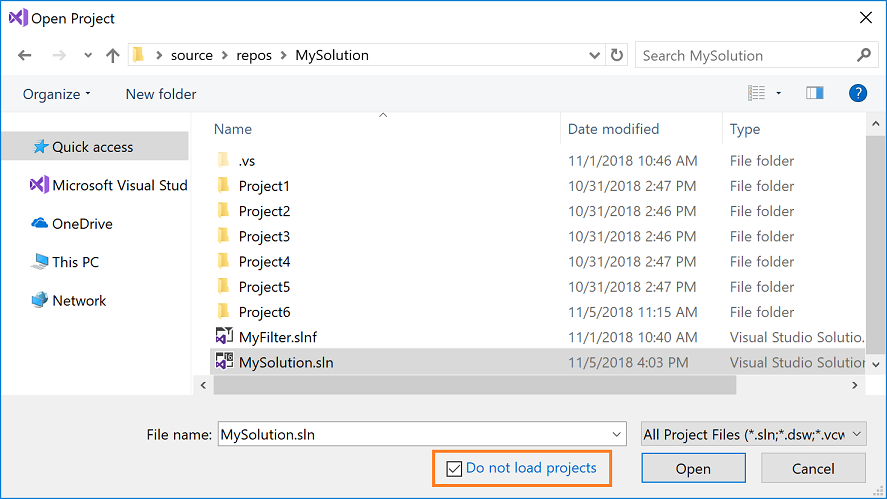
Visual Studio remembers which projects were loaded the next time you open the solution.
Performance Improvements
Improving performance is always a top request from customers. In Visual Studio 2019, we reduced the time it takes for several operations.
- Faster Visual Studio startup
- Faster branch switching in Visual Studio
- Faster debug stepping
- Faster installation updates
Faster Startup
The new Start window is much faster in Visual Studio 2019 and has been designed to present you with several options to get you to code quickly. In addition, starting with Visual Studio 2019 version 16.1, Visual Studio blocks synchronously autoloaded extensions to improve startup and solution load times. This enables you to get to your code faster.
Faster Branch Switching
When working with Git, part of the usual workflow is to create and work on code branches. Visual Studio no longer completely unloads and reloads the solution during branch switches (unless many projects update as part of the branch switching operation).
To avoid context switching between Visual Studio and the Git command line, Visual Studio 2019 now provides an integrated branch switching experience that enables you to “stash” any uncommitted changes during the branch switch operation. You no longer need to go outside of Visual Studio to stash your changes before switching branches.
Faster Debugger Stepping
Because a large part of the development cycle includes stepping through and debugging code, we've worked to bring several improvements to the debugger performance. Stepping through your code is over 50% faster in Visual Studio 2019 versus 2017. The Watch, Autos, and Locals windows are 70% faster. Moreover, because most debugger-related windows (i.e., Watch window, Call Stack window, etc.) are now asynchronous, you can interact with one window in Visual Studio while waiting for information to load in another.
Stepping through your code is over 50% faster in Visual Studio 2019 versus 2017.
Faster Installation of Visual Studio Updates
With the introduction of background downloads for updates in Visual Studio 2019, you can continue working on your code for a longer time while the update downloads in the background. At the end of the download, once the update is ready for installation, you get a notification to let you know that you're good to go. Using this approach, the installation time for Visual Studio 2019 updates has decreased significantly.
Tooling Improvements and Navigation
Tooling and navigation improvements include new syntax classification colors, additional Go to commands, and read/write filters for Find All References.
New Classification Colors
The Visual Studio editor is now just a little more colorful for C# and Visual Basic. Keywords, user methods, local variables, parameter names, and overloaded operators all get new colors. You can customize the colors for each new syntax classification in Tools > Options > Environment > Fonts and Colors by scrolling to User Members.
Find Code Using “Go to” Commands
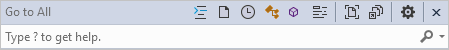
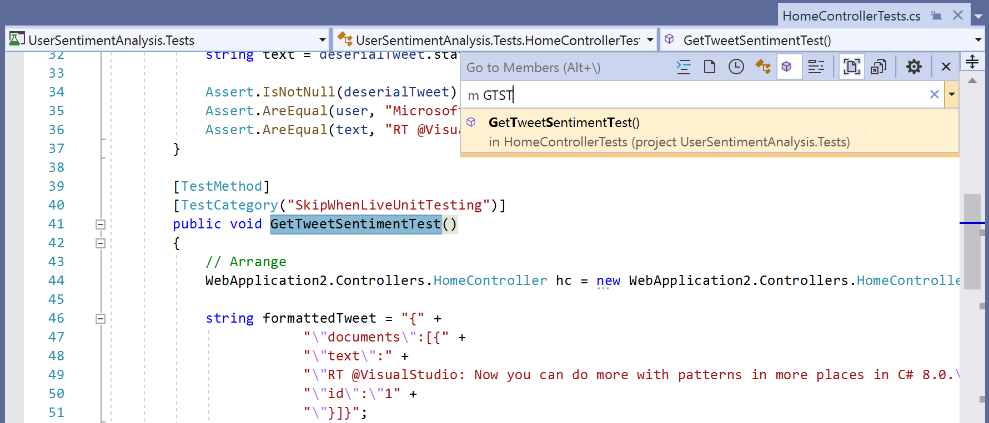
Visual Studio's Go to commands perform a focused search of your code to help you quickly find specified items. You can go to a specific line, type, symbol, file, and member from a simple, unified interface. Type (Ctrl+T) to launch the Go to window display at the top right of your code editor. You can see the Go to tool in Figure 4.
As you type in the text box, the results appear in a drop-down list. Use down arrows to preview a file or go to an element by selecting it in the list, as shown in Figure 5.
You can also filter the searches by types, symbols, line, files, members, and recent files. To narrow your search to a specific type of code element, you can either specify a prefix in the search box or select one of the five filter icons shown in Table 1:
You can also view project files (.csproj and .vbproj) with Go to navigation and search the contents for file references. Speaking of project files, you can easily edit SDK-style project files from the Solution Explorer with a simple double-click!
Find References in Your Code
You can use the Find All References command to find references to code elements throughout your codebase. The Find All References command is available in the context (right-click) menu of the element you're interested in. Or, if you're a keyboard user, place your cursor in the element and press Shift + F12. The results appear in a tool window named
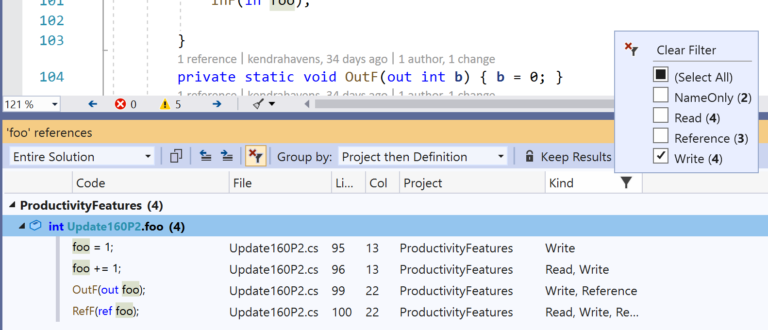
In Visual Studio 2019 for C# or Visual Basic, the Find References window has a Kind column where it lists what type of reference it found. You can use this column to filter by reference type by clicking on the filter icon that appears when hovering over the column header. You can filter references by several categories including Read, Write, Reference, Name, Namespace, and Type, as shown in Figure 6.
Code Fixes and Refactorings
Several hints are built into Visual Studio in the form of code fixes and refactorings. These appear as lightbulbs and screwdrivers next to your code or in the margin. The hints can resolve warnings and errors as well as provide suggestions. Suggestions can help you better follow the code style that your team prefers or discover new features, such as new C# syntax.
You can check out the most popular refactorings that are built into Visual Studio at https://aka.ms/refactor. We've added dozens of new code fixes and refactorings in Visual Studio 2019! You can open these by typing (Ctrl+.) or by clicking on the lightbulb or screwdriver icons. Here are a few of our favorites:
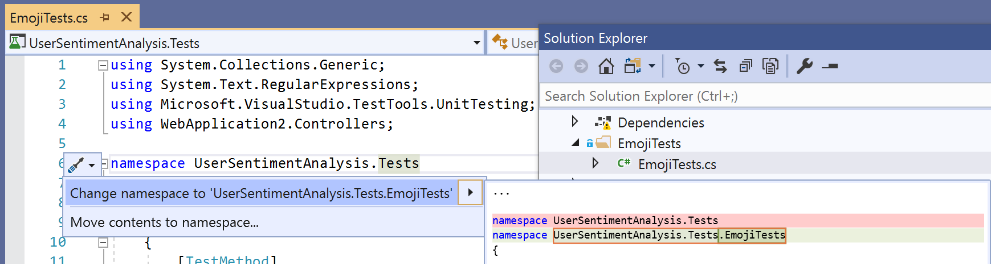
- Sync namespace and folder name, as shown in Figure 7
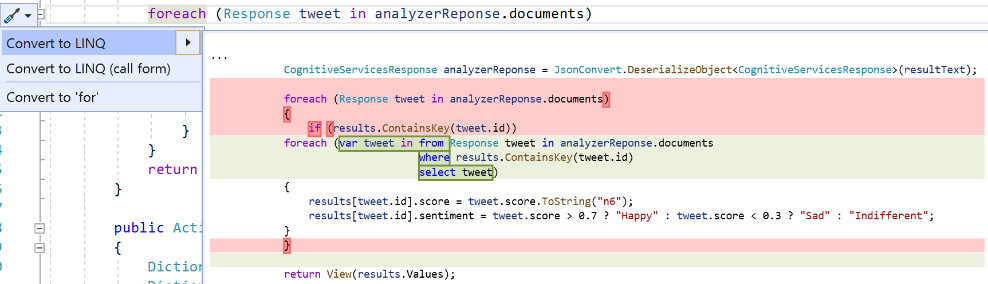
- Convert foreach to LINQ, as shown in Figure 8
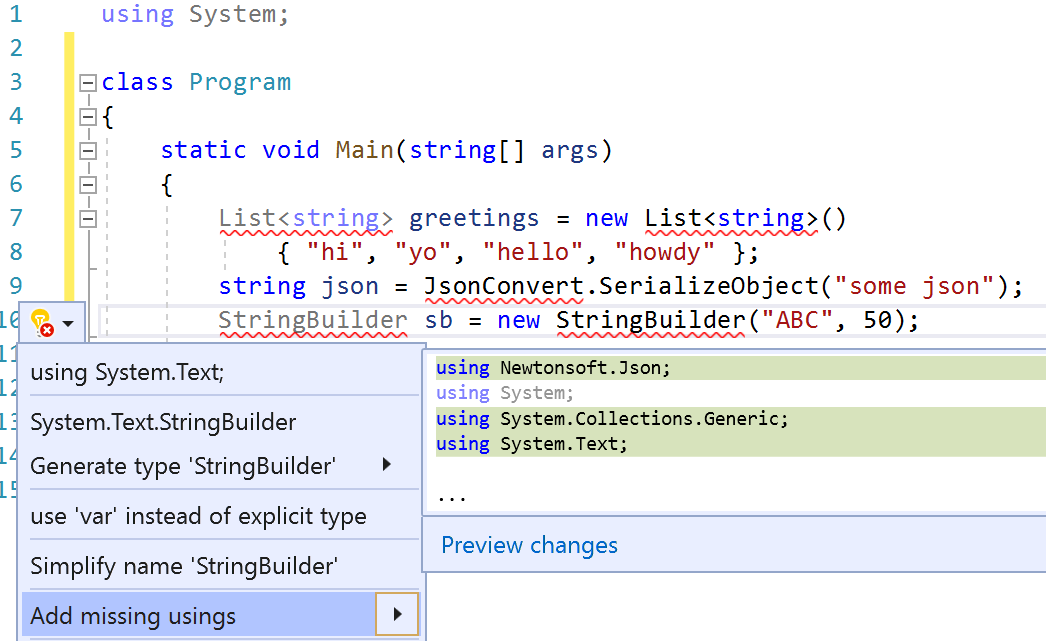
- Add multiple missing references, as shown in Figure 9
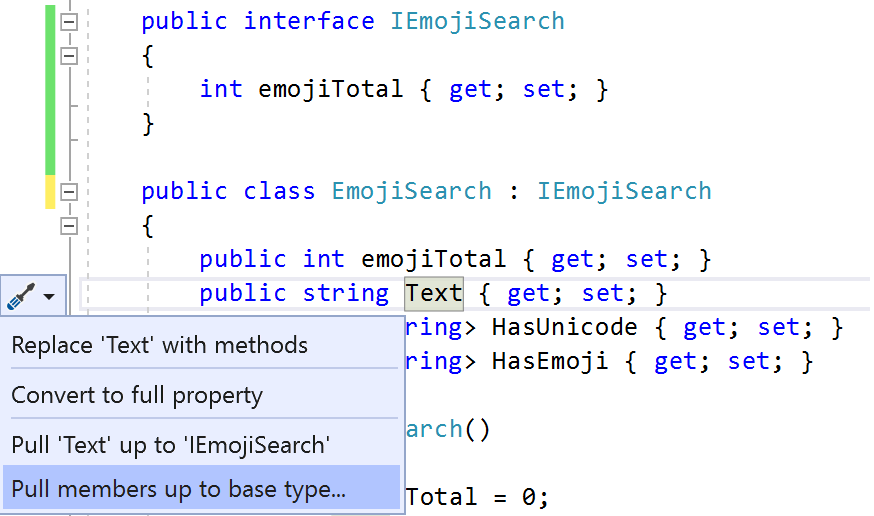
- Pull members up to base, as shown in Figure 10
And many more, like these:
- Invert conditional expressions
- Extract interface to same file
- Wrap/indent/align parameters/arguments
- Regex language support and completion
- Remove unused expression values and parameters
- Use expression/block body for lambda
- Move type to namespace
- Split/merge nested if statement
Write Better Code Faster with Roslyn Analyzers
Code fixes and refactorings in Visual Studio are all powered by analyzers. An analyzer is the tool that does static analysis on your code and reports diagnostics and errors. The .NET Compiler Platform (“Roslyn”) analyzers review your code for style, quality and maintainability, design, and other issues, but it doesn't need to stop with the built-in tools. You can create your own analyzers with the open-source Roslyn APIs. Do you have a common scenario or guidance that's special to your codebase? You can create a diagnostic and code fix for it to share with your team or anyone who depends on your library. For an example tutorial, visit https://aka.ms/diy-analyzer.
The .NET Compiler Platform (“Roslyn”) analyzers don't need to stop with the built-in tools. You can create your own analyzers with the open-source Roslyn APIs.
Many users in the community have already created their own Roslyn analyzer packages that are available to download on NuGet. As always, only install packages from providers you trust.
The Roslyn team has several analyzer packages that we recommend, but they don't ship as part of the default tools because they give more verbose feedback than is necessary in the default experience. If you'd like additional code style guidance and rules, download our recommended analyzer packages at https://aka.ms/recommended-analyzers.
Define Code Style with EditorConfig
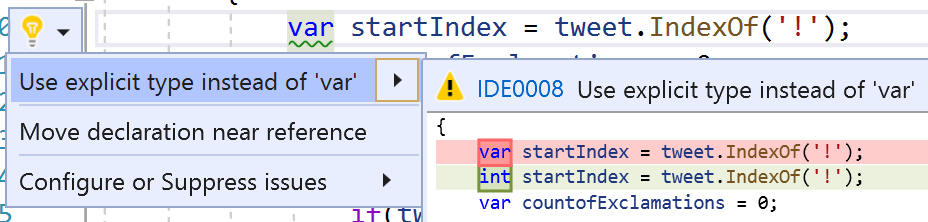
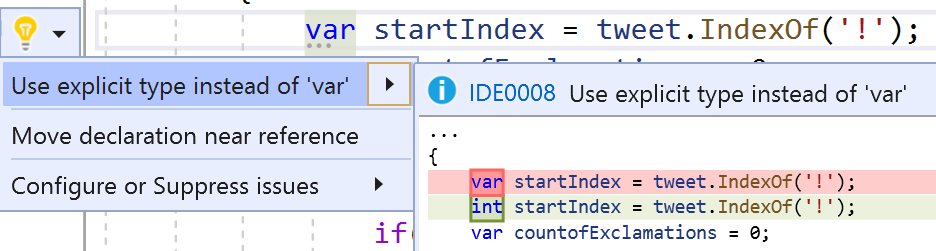
Now that you're familiar with code fixes and analyzers, we can talk about code style configuration. Code style is important because consistency makes code easier to maintain and read. Enforcing consistent code style is especially important when developer teams and their code bases grow. Visual Studio enables you to configure analyzers to apply your preferred code style rules and customize the severity at which they appear in the editor. You can easily change your code style to prefer explicit type instead of var (or vice versa) and display any violation of this rule as a suggestion, warning, or error in the editor. A warning to use explicit type instead of var is shown in Figure 11 as a green squiggle. The same code style rule is shown as a suggestion (three gray dots) in Figure 12.
Where do you configure all these code styles? You can use the code style pages in Tools > Options or the more versatile EditorConfig. EditorConfig files help to keep your code consistent by defining code styles and formats. These files can live with your code in its repository and use the same source control. This way, the style guidance is the same for everyone on your team who clones from that repository. With the EditorConfig rules and syntax, you can enable or disable individual .NET coding conventions, and configure the degree to which you want each rule enforced, via a severity level.
There are three supported .NET coding convention categories:
- Language conventions: Rules for C# or Visual Basic language preferences (Example: var versus explicit type preference)
- Formatting conventions: Rules for layout and structure of code. (Example: rules around Allman braces, or preferring a space between a method call name and parenthesis)
- Naming conventions: Rules for naming code elements (Example: you can specify that an async method must end in Async)
Each category has variations in syntax, but instead of writing these yourself, you can use the default .NET EditorConfig item template or generate your own EditorConfig from your pre-existing Tools > Options settings.
csharp_style_var_for_built_in_types = false:suggestion
csharp_space_between_method_call_name_and_opening_parenthesis = false
dotnet_naming_style.pascal_case_style.capitalization = pascal_case
To add an EditorConfig file to a project or a solution, right click on the project or solution name within the Solution Explorer. Select Add New Item or press (Ctrl+Shift+A). In the Add New Item dialog, search for EditorConfig. Select the Default EditorConfig template to add an EditorConfig file prepopulated with two core EditorConfig options for indent style and size. Or, select the .NET EditorConfig template to add an EditorConfig file prepopulated with default options.
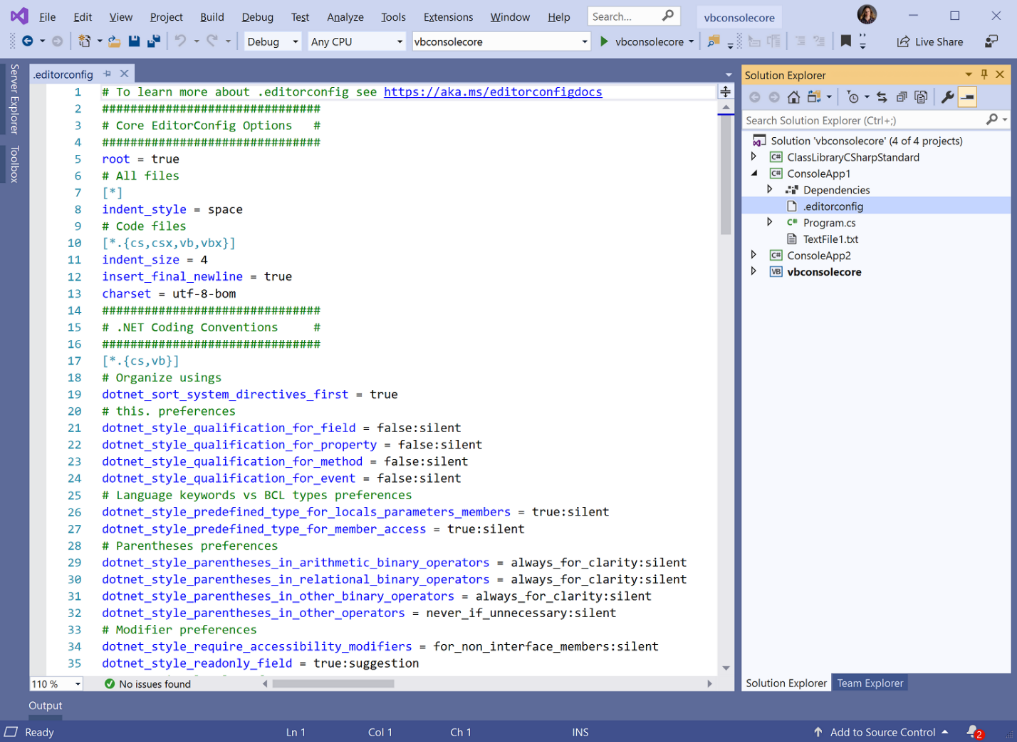
An .editorconfig file appears in Solution Explorer, and it opens in the editor, as seen in Figure 13.
You can also add an EditorConfig file based on the code style settings you've chosen in the Visual Studio Options dialog. The options dialog is available at Tools > Options > Text Editor > [C# or Basic] > Code Style > General. Click Generate .editorconfig file from settings to automatically generate a coding style .editorconfig file based on the settings on this Options page.
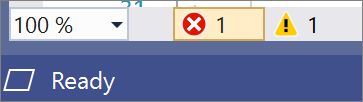
If rule violations are found, they're reported in the code editor (as a squiggle under the offending code) and in the Error List window. The document health indicator gives you a sneak-peak of rule violations without having the error list open. Figure 14 shows the File Health Indicator.
Apply Code Styles
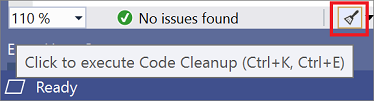
For C# code files, Visual Studio 2019 has a?Code Cleanup?button at the bottom of the editor that applies code styles from an EditorConfig file or from the?Code Style?options page. If an?EditorConfig?file exists for the project, those are the settings that take precedence. Figure 15 shows the Code Cleanup button in action.
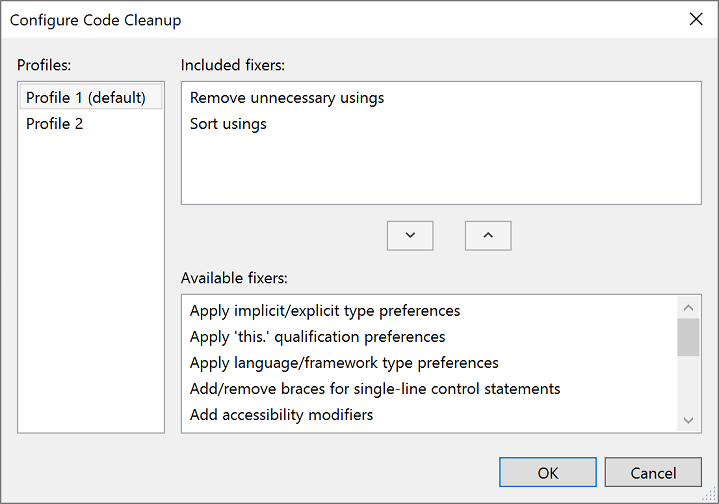
First, configure which code styles you want to apply (in one of two profiles) in the Configure Code Cleanup dialog box (shown in Figure 16). To open this dialog box, click the expander arrow next to the code cleanup broom icon and then choose Configure Code Cleanup.
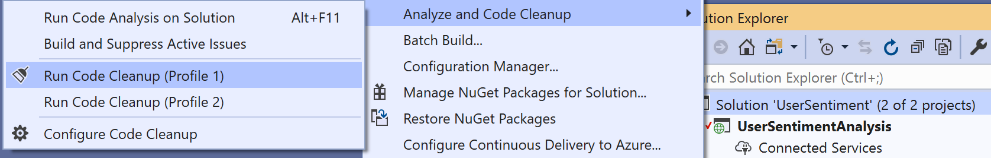
After you've configured Code Cleanup, you can either click on the broom icon or press?(Ctrl+K,?Ctrl+E)?to run Code Cleanup. You can also run Code Cleanup across your entire project or solution. Right-click on the project or solution name in?Solution Explorer, select?Analyze and Code Cleanup, and then select?Run Code Cleanup, as seen in Figure 17.
You can also generate an EditorConfig based off the code styles used in an existing codebase. This and much more is offered by IntelliCode.
IntelliCode
Visual Studio IntelliCode enhances software development using machine learning and artificial intelligence. IntelliCode delivers context-aware code completions and guides developers to adhere to the patterns and styles of their team.
Context-Aware Code Completions
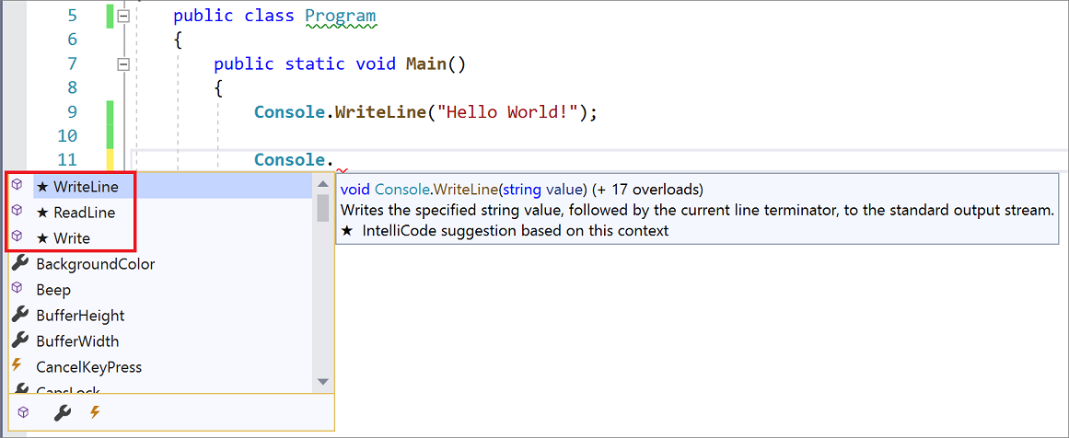
IntelliCode provides AI-assisted IntelliSense suggestions that appear at the top of the completion list with a star icon next to them, as shown in Figure 18.
The completion list suggests the most likely correct API for a developer to use rather than presenting a simple alphabetical list of members. To provide this dynamic list, IntelliCode uses the developer's current code context as well as patterns based on thousands of highly rated, open-source C# projects on GitHub. The results form a model that predicts the most likely and most relevant API calls.
IntelliCode uses the developer's current code context as well as patterns based on thousands of highly rated, open-source C# projects on GitHub.
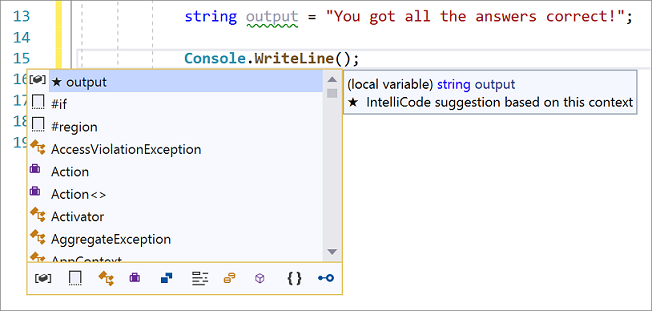
In addition to providing member suggestions, IntelliCode also provides?argument completion. This capability, which is currently in preview, stars the most likely argument names that you'll use when you call a method and places those suggestions at the top of the completion list. The completion list appears when you start typing inside the parentheses or press?(Ctrl+Space)., as shown in Figure 19.
IntelliCode can also provide AI-assisted IntelliSense recommendations based on your own code. You can create a custom IntelliCode model to get AI-assisted IntelliSense recommendations based on your C# codebase. An IntelliCode model is an encapsulation of a set of rules that enable prediction of some useful information based on inputs. IntelliCode creates?custom?models using the same learning process as for the IntelliCode base models, except that they're trained on your own code. The model trained on your code is private and only available to you and those with whom you choose to share it. The more code you provide to illustrate your patterns of usage, the more capable the custom model will be of offering good recommendations.
Create a Custom Model
To get useful predictions, a codebase should represent the common usage patterns for the APIs, objects, and methods that you use. The larger the variety of common usages that a codebase illustrates, the more useful the resulting model is in predicting those usages.
To train a model, follow these steps:
- Open the project or solution in Visual Studio.
- Enable custom models in Tools > Options > IntelliCode > General > C# custom models.
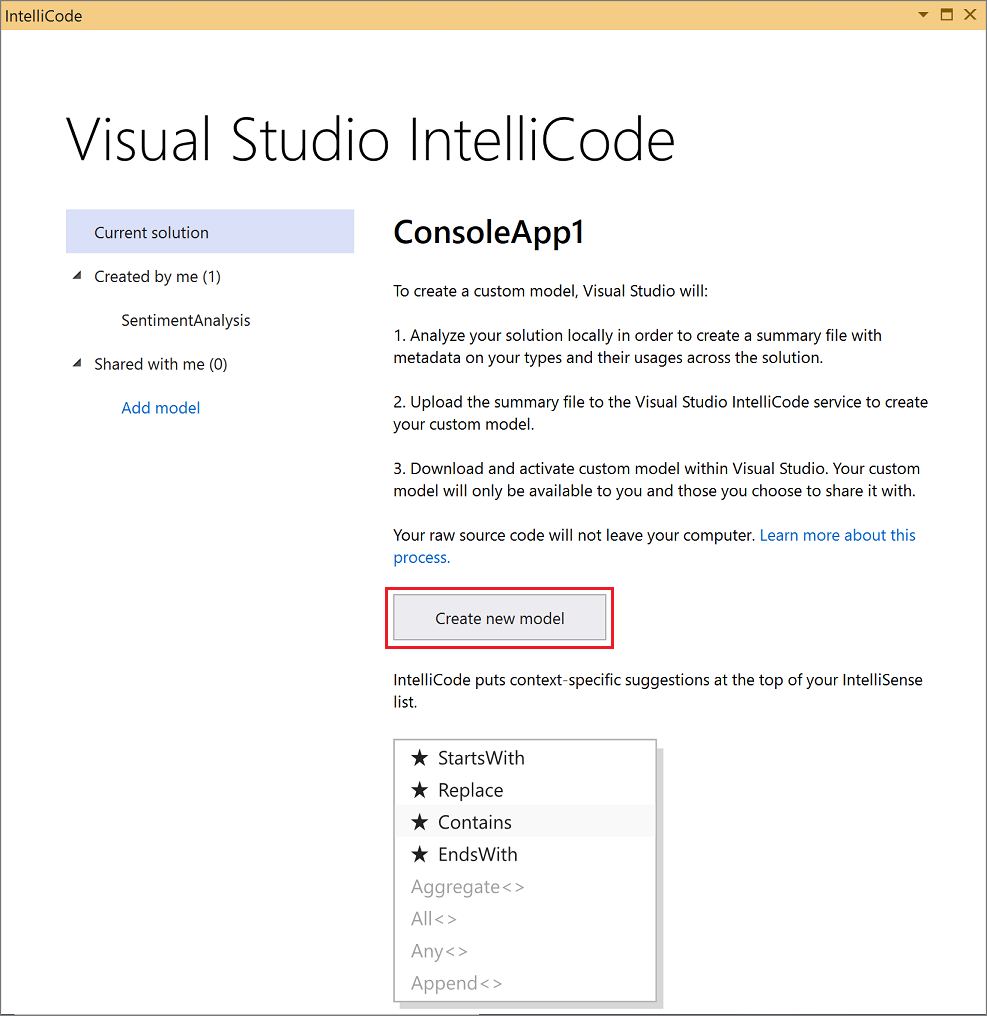
- Open the IntelliCode page by choosing View?>?Other Windows?>?IntelliCode Model Management.
- Choose?Create new model, as shown in Figure 20.
After you've trained a model, the?Share model?button appears. Click the button to copy the sharing link. From there, you can share the link with your collaborators.
Code Style Inference
EditorConfig files help to keep your code consistent by defining code styles and formats. These conventions enable Visual Studio to offer automatic style and format fixes to clean up your document. For C# developers, IntelliCode can infer your code style and formatting conventions to dynamically create an EditorConfig file.
You can add an IntelliCode-generated EditorConfig file at the project or solution level in Visual Studio (or to a solution folder). First, enable EditorConfig inference in Tools > Options > IntelliCode > General > EditorConfig inference. Then, add a prepopulated EditorConfig file, right-click on the desired location in?Solution Explorer?and choose?Add?>?New EditorConfig (IntelliCode), as shown in Figure 21.
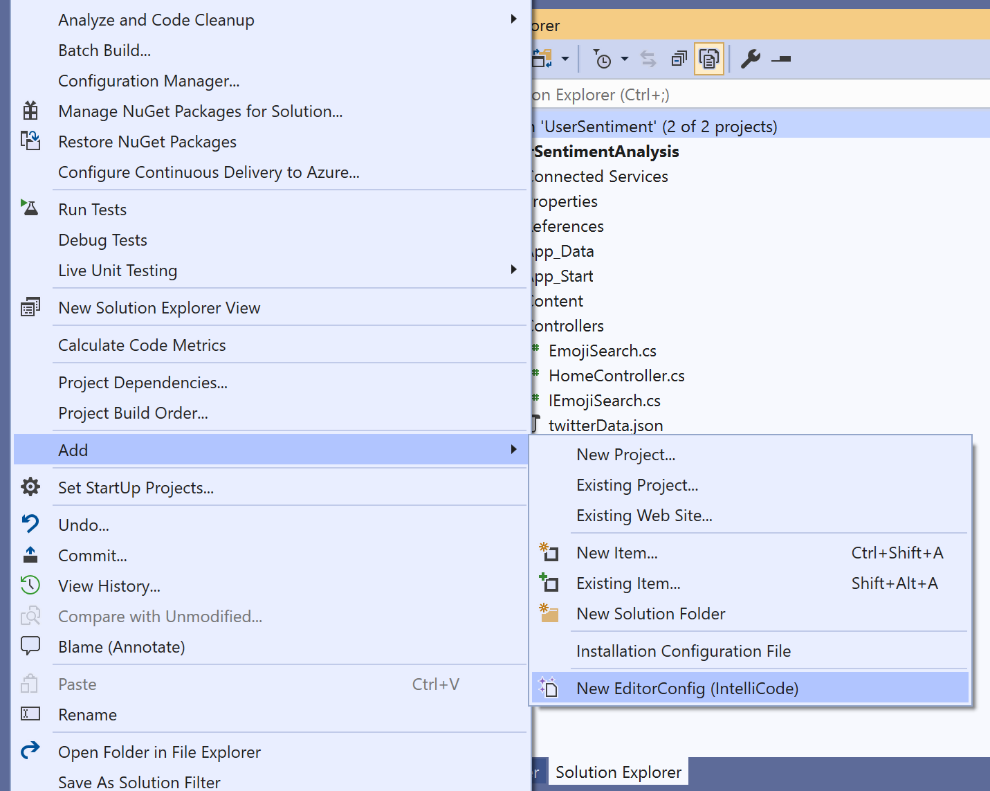
After you add the file in this way, IntelliCode automatically populates it with code style conventions that it infers from your codebase. No more long discussions with your team about the best convention to use! Once generated, this file will help you maintain consistency in your team's codebase.
Debugging
Visual Studio 2019 has added and improved upon features that enhance your productivity while debugging. The data breakpoint was a debugging feature exclusive to C++ that's now compatible with .NET Core applications (version 3.0 or higher) in Visual Studio 2019. Data breakpoints enable you to halt your code when a specific object's property changes in memory.
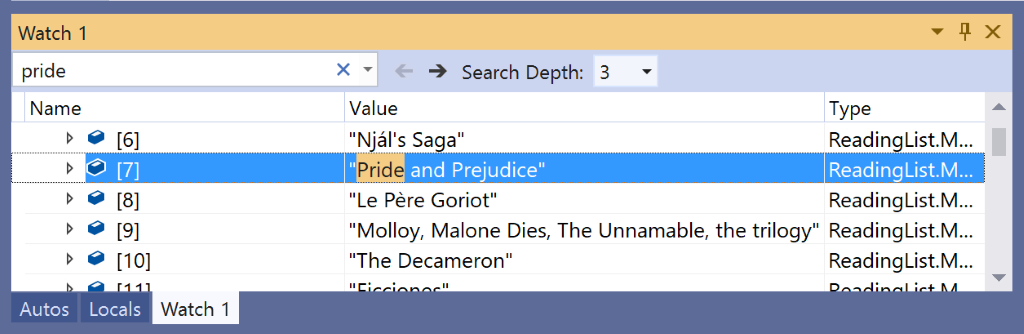
Access these breakpoints by right-clicking an object's property in the Autos, Locals, or Watch windows and selecting “Break When Value Changes” in the context menu. You can now search for specific values in your Autos, Locals, and Watch windows across multiple languages (excluding Xamarin, Unity, and SQL), as shown in Figure 22. Performing a search saves you the hassle of constantly scrolling and expanding items you want to inspect.
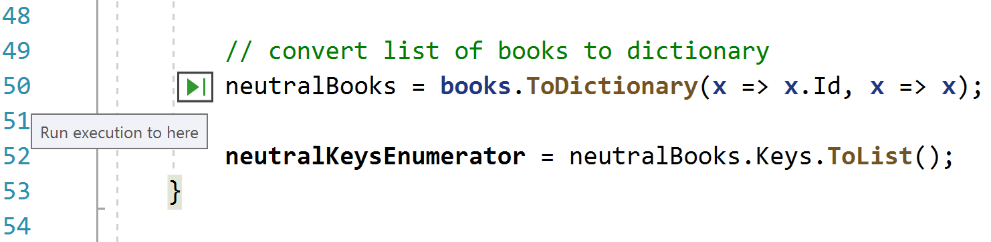
Besides the new additions in 2019 and improved overall performance, there are plenty of other existing debugging features available in Visual Studio that can improve your debugging experience. There are plenty of ways to expedite your stepping experience, including Run to Click, a green arrow glyph that lets you fast-forward your code's execution to a specified line (as shown in Figure 23) and Step into Specific, a context menu option which lets you step inside a nested function call.
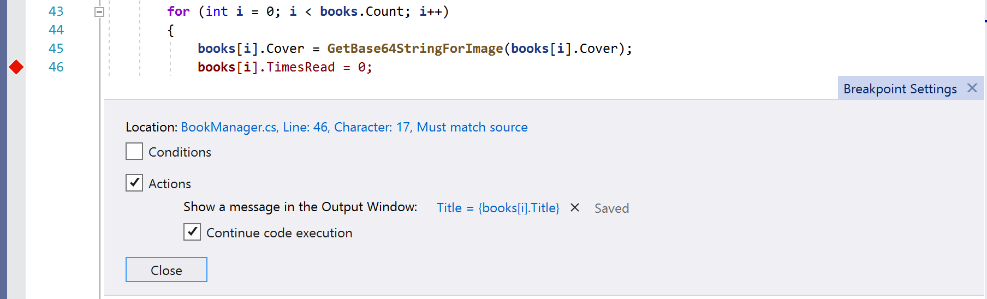
The next time you consider writing a print statement to log information, try using a TracePoint instead, which enables you to print to the output window without modifying your code. TracePoints can be set by creating a normal breakpoint at the specified line of code, selecting the gear glyph after hovering over it, and selecting the Actions option. You can see this in Figure 24.
For users debugging asynchronous or multithreaded applications, check out the Parallel Stacks, Tasks, and Threads windows (all accessible via Debug > Windows in the top menu while debugging) to break down and analyze the code in an efficient, understandable manner.
Test Explorer
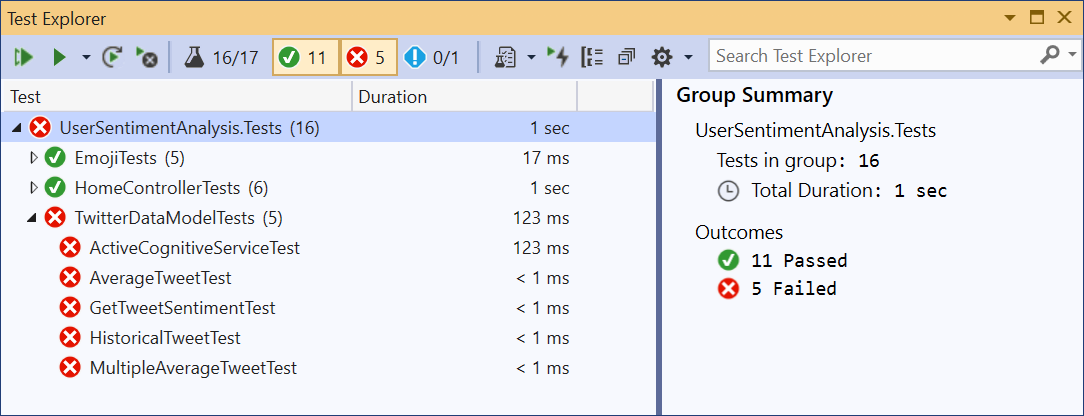
The Test Explorer had a major UI update in Visual Studio 2019 version 16.2 to provide better handling of large test sets, easier filtering, more discoverable commands, tabbed playlist views, and the addition of customizable columns that let you fine tune what test information is displayed. You can see this new window in Figure 25.
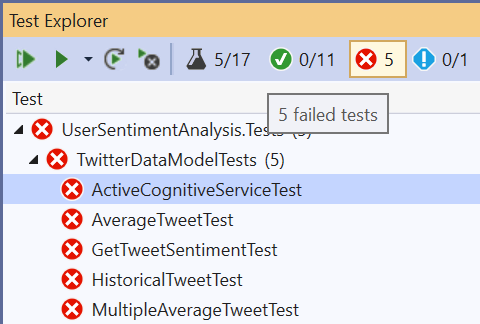
Easily view the total number of failing tests at a glance and filter by outcome with the summary buttons at the top of the Test Explorer, as shown in Figure 26.
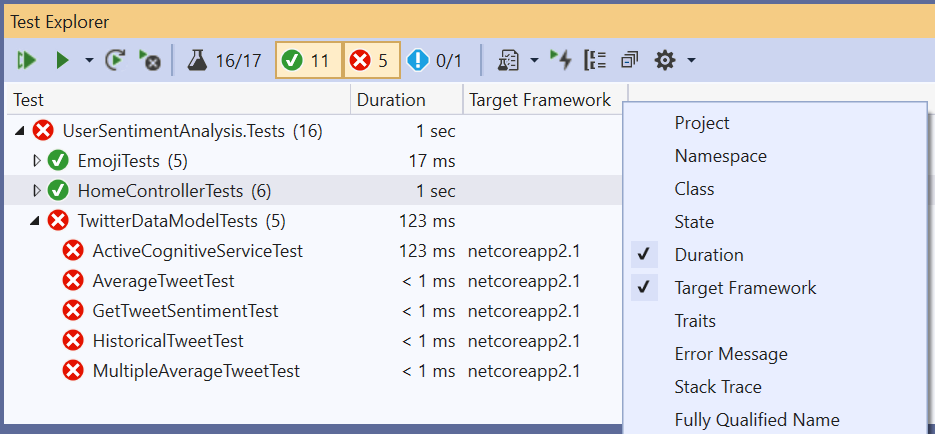
You can customize what information shows for your tests by selecting which columns are visible, as shown in Figure 27. You can display the Duration column when you're interested in identifying slow performing tests or you can use the Message column for comparing results. This table layout mimics the Error List table in its customizability. The columns can also filter using the filter icon that appears when hovering over the column header.
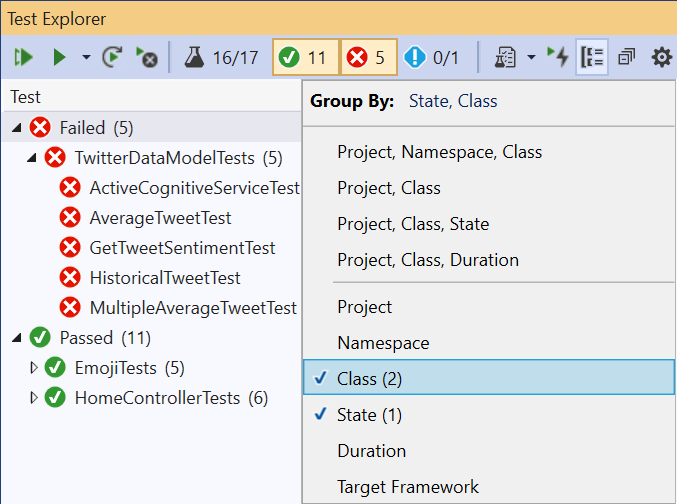
Additionally, you now can specify what displays in each tier of the test hierarchy, as shown in Figure 28. The default tiers are Project, Namespace, and then Class, but you can also select any combination of groupings including State or Duration groupings.
Playlists can display in multiple tabs and are much easier to create and discard as needed. Live Unit Testing also gets its own tab that displays all tests currently included in Live Unit Testing so you can easily keep track of Live Unit Testing results, separate from the manually run test results. Live Unit Testing is a Visual Studio Enterprise feature that automatically runs any impacted unit tests in the background and presents the results and code coverage live in Visual Studio in real time.
Live Share
Live Share enables you to collaboratively edit and debug with others in real time, regardless of what programming languages you're using or app types you're building. It enables you to instantly and securely share your current project, and then, as needed, share debugging sessions, terminal instances, localhost Web apps, voice calls, and more!
Additionally, unlike traditional pair programming, Visual Studio Live Share enables developers to work together while retaining their personal editor preferences (e.g., theme or keybindings), as well as having their own cursor. This enables you to seamlessly transition between following one another and being able to explore ideas/tasks on your own. In practice, this ability to work together and independently provides a collaboration experience that's potentially more natural for many common use cases.
Click Live Share within Visual Studio to start your collaboration session and automatically copy an invite link to your clipboard, as shown in Figure 29.

Send the link over email, Teams, etc. to those you want to invite. Opening the link in a browser enables your guest to join the collaboration session that shares the contents of the folder, project, or solution that you opened. Note that, given the level of access Live Share sessions that you can provide to guests,?you should only share with people you trust?and think through the implications of what you are sharing.
That's it! Here are a few things to try out once a guest has joined you:
- Move around to different files in the project independently and make some edits.
- Follow the guest and observe as they scroll, make edits, and navigate to different files.
- Start up a co-debugging session with them.
- Share a server so you can check out something like a Web app running on their computer.
- Share a terminal and run some commands
Resources
This article is a peek at recent improvements to Visual Studio 2019. More content, examples, and comprehensive docs are located on docs.microsoft.com. Here are some direct links that you might find useful:
To learn more on the most popular refactorings built-in to Visual Studio 2019, visit https://aka.ms/refactor.
Guidance on creating your own Roslyn analyzers can be found at https://aka.ms/diy-analyzer.
Get extra guidance and code style rules from your editor by installing the recommended analyzer packages at https://aka.ms/recommended-analyzers.
To learn more tips and tricks on Visual Studio Productivity checkout our guide at https://aka.ms/productivityguide.
Table 1: Go to command shortcuts
| Prefix | Icon | Shortcut | Description |
| : | Ctrl+G | Go to the specified line number | |
| f | Ctrl+1, Ctrl+F | Go to the specified file | |
| r | Ctrl+1, Ctrl+R | Go to the specified, recently visited file | |
| t | Ctrl+1, Ctrl+T | Go to the specified type | |
| m | Ctrl+1, Ctrl+M | Go to the specified member | |
| # | Ctrl+1, Ctrl+S | Go to the specified symbol |