I've wanted to write this article for a long time. To be honest, I started writing it a few times, and went off topic pretty quickly, partly because I got excited and carried away, and partly because there's so much to talk about that I had a hard time fitting something meaningful into a single article.
Before I get into the thick of it, here are my goals for this article:
- I want to explain that AI is real and approachable. It's not science fiction.
- I want to explain the basics of AI and machine learning.
- I would like to convince you that you can learn and be useful at AI without being a data scientist.
- I would like to give you a taste of what it's like to be an ML programmer.
But let's not kid ourselves, a big field like AI isn't the work of one article. I hope, though, that this article puts AI within the grasping reach of the uninitiated. I want you to know that it's easy, and it's something you can learn in a matter of days or weeks, if you put your mind to it. And, I think if you see the power it brings, you'll be kicking yourself for not diving into it sooner.
AI is Real
Have you used that smartphone in your pocket to take pictures? Try taking a picture of a friend with it right now. Do you see how it's able to adjust the contrast and brightness, and perhaps draw rectangles around the faces of people in the picture? The camera hasn't ever seen your friend before, and yet it's able to recognize a human face. That's AI at work. You've been using it all along, without realizing it. To be specific, that is the Viola-Jones Object Detection algorithm. Back in 2001, Paul Viola and Michael Jones were able to detect objects, such as faces, with very little processing power. Today, similar techniques are being used to do object detection in real time, beyond just faces.
You've been using AI all along without realizing it.
Still not convinced? Okay, have you heard of YouTube? They get five hours of content uploaded every second, a lot of which isn't appropriate. All of it needs to be categorized, so it can be monetized. Some of it needs to be flagged. Since you started reading this article, they've had a day's worth of content uploaded. How many minions can YouTube hire to categorize and classify this content? And what's the cost of getting it wrong? Or perhaps they can just have algorithms act upon it? AI certainly has an advantage over humans, and AI has a huge advantage over other ways of programming, too. For instance, it scales infinitely: You just throw more processing power at it. How much data has your company produced since you started reading this article? Would you find insights into that data useful? How much time do you spend sifting through mindless tasks, like filling out your timesheet, being distracted by unnecessary emails or spam calls? AI is how we will solve all of these challenges.
I see you're still being skeptical. Have you received a letter in the mail? Something with a hand-written address. And looked at the horrible handwriting and been amazed that the letter actually made it to you. That is AI in action, 97% accuracy in handwritten addresses, 99% accuracy in printed addresses. And this system has been in place since the 70s. How much more expensive and inaccurate would our mail delivery be if we didn't have AI?
Skill skeptical? I'm writing this article using speech recognition.
Why is AI Suddenly Approachable?
An obvious question: If AI has been around for so long, how come everyone has just started talking about it recently? There are three things you need for AI: algorithms lots of compute (as in CPU), and lots of data.
Algorithms, that's easy! We've been working on them for a long time. The difference today, however, is that none of the top tech-firm CEOs can seem to form a full sentence without using the word “AI.” So there are billions of dollars pouring into AI. Governments have seen the light as well and they're also pouring billions into this field. And where you have billions of dollars, a lot of intelligent and dedicated minds are quite motivated to solve some really hard problems. The billions of dollars are helping corporations save and generate more money. Whether it be a car company promising the wonders of autopilot, or some large tech company creating an amazing search engine, or a big social media company sifting through unimaginable amounts of data and making sense of it, or a phone company that can strategically place workers ahead of an upcoming storm, let's be honest, AI is making people a lot of money.
Compute is also not a problem anymore. With the power of the cloud, we have lots of compute on demand. The interesting thing about AI is that you need a lot of compute to crunch a lot of data. But once the data is crunched, you can run this “model” on a very lightweight device. In fact, advanced technologies such as TensorFlow can run on a $12 board. Imagine, all that AI power on a $12 device. This truly makes the reach of AI ubiquitous. Remember that smartphone in your pocket? It's loaded with AI.
And finally, there's data. Storage has become really cheap over the past 10 years. In the 1980s, we had shoulder-mounted camcorders. They recorded grainy video for 90 minutes onto a cassette that you could hurt an AI skeptic with. Today, on a tiny 1TB SD card, you can store 24 hours of 4K 60fps video. And now we have data in the cloud, not just data as pure storage, but an amazing slew of tools that let us ingest petabytes of data instantly and massage it as we need to.
Given that data has become ubiquitous, compute has become so cheap, the opportunity for AI has opened up, fueling an unprecedented amount of innovation on the algorithm side of things.
This is why AI has suddenly become very relevant.
Basics of AI
Artificial intelligence is simply intelligence demonstrated by machines. In other words, it's something that allows computers to mimic human behaviors. So a Turing machine is an example of AI. Neural networks are AI too.
Machine learning is a subset of AI. It refers to the ability of computers to learn or do something without being explicitly programmed to do that task. Let me explain. So far, in every program we have written, we painstakingly program every if condition, every loop, to extract the precise result we want. We have learned concepts such as functional programming, attribute-based programming, and object-oriented programming, and the entire theme has been to break the problem down into an exact science. We know every permutation and combination, and every possible input and output, and we diligently and intelligently program our application to react to every input and output.
This obviously has downsides. The real world has far too many inputs and outputs. And quite frequently, we can't predict all the inputs and outputs.
Machine learning, on the other hand, relies on “experience.” You give an algorithm a lot of data, and that algorithm crunches the data and produces a model. The “rules” created in this model are based on the data you give it.
Computers don't just learn all this on their own. You have to guide them. You have to massage and clean the data. You have to give it the right algorithms and the right parameters. You have to test the validity of the model. This is where you, the human, come in. Where you work side-by-side and impart your knowledge into the model.
Let's take a very simple example. Experience tells us that whenever there's a storm, there are power outages. As humans, we know that placing repair crews at certain locations ahead of time saves us money. This can be abstracted into data. You can have lots of data where you have things such as foliage coverage, weather patterns, storm forecast, repair crew skills, equipment age and type, etc. And based on this data, you can establish patterns.
Of course, you have to ask the right questions. For instance, a possible question here could be, “Where should my crew members be during this storm?” Or, “What's the probability of this equipment failing in this coming storm?”
The question should be specific and unambiguous. For example, “When should I sell this stock?” Well, when you make a profit, right? But a more targeted and exact question, such as “What's the probability of this stock making a profit seven days from now?” would be a better question.
The Concept of Test Data
The process of creating a model involves crunching a lot of data. Usually the first step is to clean the data. Let's say that at this point, we know that we have 100% data that, based on our experience, is right. So we split this data up, say 70% and 30%. We create a model based on 70%. Depending upon the kind of problem we're attempting to solve, a smart data scientist will pick numerous algorithms to create a model.
But how good is that created model? To evaluate that, we use the rest of the 30% test data, where we still know that the data is right. This data is then played against our model, predicting the values and seeing how accurate our predictions are.
Then you randomize that data and create a new subset to see if you can improve the results. As a data scientist, your job is to clean the data, pick the right algorithms, and create the right parameters for those algorithms to create the most accurate set of data you can.
And it's totally reasonable to say, “We don't have enough data to make an accurate prediction.” For instance, a photograph of a laptop isn't enough data to predict the reliability of the data. And domain experts will tell you that other parameters, such as brand, specs, year of manufacturer, anticipated usage of the laptop, etc. are better metrics in predicting the reliability of any laptop. Certainly, you could create a model around the reliability of a laptop over sushi prices in Japan as a data point, but it wouldn't be very useful.
So data scientists and domain experts work hand-in-hand in creating these models.
Supervised Learning vs. Unsupervised Learning
In machine learning, there are two types of learning: supervised and unsupervised.
In supervised learning, you have a truth you're working with. This is where a domain expert already knows the right answers and you're simply coaxing the model to produce the right outputs based on input. You already have a pretty clear idea of what the right output should be. You can examine the output value and pretty much know if the prediction was correct or not. The goal of supervised learning is to learn a function that, given a sample of data and desired outputs, best approximates the relationship between input and output observable in the data.
Supervised learning can be further broken down into classification and regression. Classification refers to being able to classify your data into two or more buckets, like whether an email is spam or not. True or false, hot or cold - all are examples of two-level classifications. Red, blue, or green, cuisine type, and dress code are examples of multi-level classifications. Common algorithm uses for classification are SVM, kNN, and CART. (See the sidebar if you need these acronyms spelled out.)
Regression, on the other hand, refers to predicting a value on a continuous scale. How hot will it be on a scale of 1-100, what's the probability of rain tomorrow, or stock index predictions, or sentiment analysis - these are examples of regression problems. Common algorithms used for regression are CART, LASSO, and linear regression.
Unsupervised learning, on the other hand, doesn't have labeled outputs, so its goal is to infer the natural structure present within a set of data points. In other words, you don't even know the labels that the data may fall under. More data can change the set of labels. Unsupervised learning can be thought of as exploratory analysis; it helps you identify structure in data. For example, segmenting customers. Or segregating kinds of stars based on observations.
Unsupervised learning can be further broken down into cluster analysis and dimensionality reduction. Clustering is pretty straightforward; imagine a two-dimensional plane with dots on it. As more data appears, some dots will naturally be closer together. Those are clusters. Now imagine the same thing in a three-dimensional plane, like stars. Some stars naturally fall into clusters, like galaxies. Now take this to the nth dimension, and you have an n-dimensional clustering problem. Although you can't visualize it, the problem is still quite similar and there's value in being able to make sense of completely unfamiliar data by clustering it together. Common algorithms used for clustering are k-means and hierarchical clustering.
Dimensionality reduction, on the other hand, refers to the methods used to represent data using fewer columns or features. This process of reducing the number of random variables under consideration by obtaining a set of principal variables helps you make sense of the data more easily by eliminating features and dimensions that aren't valuable. Algorithms such as PCA, NMF, ICA etc. are good candidates for dimensionality reduction.
What is Programming for AI Like?
Is it getting a bit too arcane? What are all these algorithms? Do you need to be able to write them yourself? The good news is: not really! You do need to understand the strengths and weaknesses of each of these algorithms. But you don't need to be an expert at writing them. And you don't need to learn all of them at once either.
These days, like most other programming fields, we stand on the shoulders of others. There are many others who've built these algorithms in well-known libraries, and for the most part, we simply use them.
The Role of Python
Although AI is applicable to any language and platform, let's be honest: Python is the clear leader. If you're serious about AI, you need to know Python. There are many reasons for this. The first is community support: Almost everyone doing serious AI work is using Python. This means that you have better tools in Python, better support, and better library availability. Sure, there's ML.NET or TensorFlow for JS, and as excited I am about those, I seem to keep coming back to Python.
The other reason for the popularity of Python is that a large part of what you'll end up doing when working with AI is lots of trial and error. You'll want to quickly massage and visualize the data. You'll want to issue a command and quickly view its results. If your mind feels that a line chart helps you visualize the data better, the friction between your thought and the results on the screen are simply eliminated by something called Jupyter notebooks.
A Jupyter notebook is a combination of documentation and code that you can execute sequentially and use to visually massage your data and train your models. It translates very well to local development or cloud-based development. It's easy to set up locally without worrying about conflicting environments. And when you're finally ready to ship your model, it's easy to pack and ship and deploy to the cloud or on-premises.
And yes, you use Python when working with Jupyter notebooks.
Long story short, you need to learn Python.
A Working Sample
Pardon the long-drawn introduction. I know you're itching to see something real. So let's dive into an example. I will say that the code shown here is from a Mac. It'll work on Linux with extremely minor changes, and it can be made to work on Windows with some minor changes. For brevity, I'll just assert that everything I'm showing here is on a *nix terminal, specifically on a Mac.
What I'm going to do is first demonstrate local development. Then I'll move that project to the cloud using Azure notebooks. Finally, you'll see how to deploy your model as a working example in the cloud.
Developing Locally
Your Mac, if you have Xcode installed, probably has Python2.x on it. This is incredibly annoying, because it means that everything you do on Python3, which the entire world is on, requires you to type “python3” instead of “python”. Unfortunately, a lot of scripts and code on the Internet don't have this Mac-specific issue. As a result, you need an isolated environment where you can control the version of Python, where the word “python” means python3.
You do that using something called virtualenv. Here's how.
First, install python3. You can do this easily using brew.
brew update
brew install python
Note that by doing so, you're installing the latest version of Python, which is currently 3.x.
Next, install virtualenv.
sudo pipe3 install -U virtualenv
Note that the -U switch means it's a system-wide install.
Next, using virtualenv, you'll create a virtual environment.
virtualenv --system-site-packages
-p python3 ./venv
Once this environment is created, you can activate it to use it.
source ./venv/bin/activate
Great! Now your prompt should change to what's shown in Figure 1. That (venv) in brackets indicates you're in a virtual environment.

Now let's upgrade and install pip, tensorflow, and jupyter.
pip install --upgrade pip
pip install --upgrade tensorflow
pip install jupyter
Finally, to run Jupyter, you run the following command:
jupyter notebook
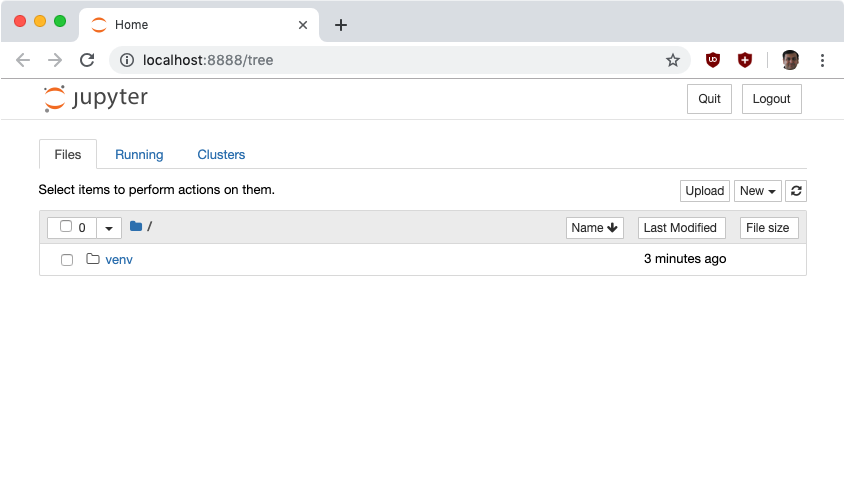
You should now be running Jupyter notebooks locally, as shown in Figure 2.
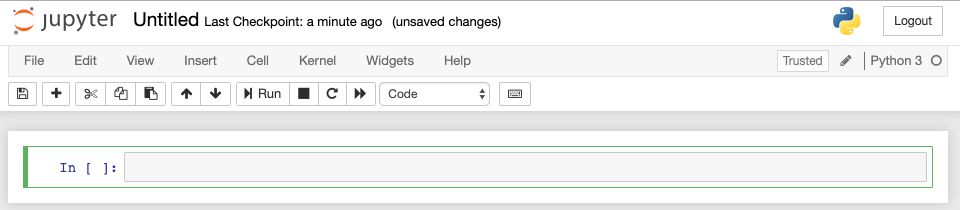
Go ahead and click the New button on the top right-hand corner and create a new Python notebook. It looks a bit like Figure 3.
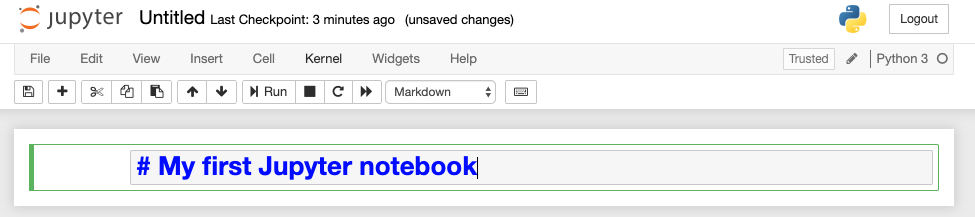
There's a dropdown at the top, which currently says that the block you're working on is Code. Change it to Markdown and enter the Markdown shown in Figure 4.
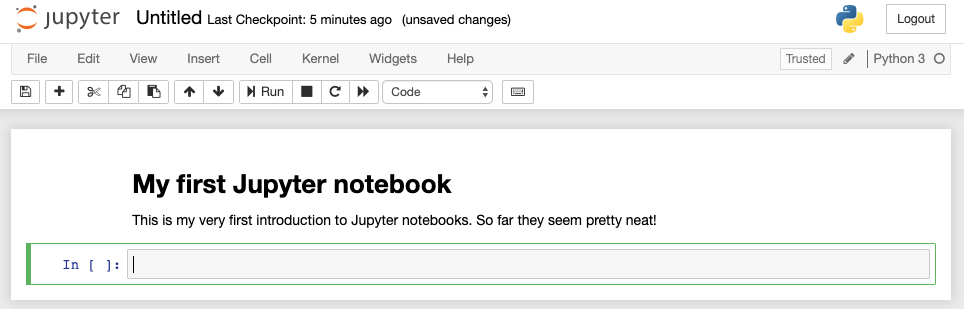
Go ahead, play around a bit, enter some more Markdown, describe what you are doing. Note that as you type Markdown, it looks like source code Markdown. When you're ready to execute that block and move to the next step, hit SHIFT_ENTER. You'll note that your Markdown has been executed and now looks like Figure 5.
There are plenty of other shortcuts to learn. Even though you're working in a browser, you almost never have to take your hands off the keyboard.
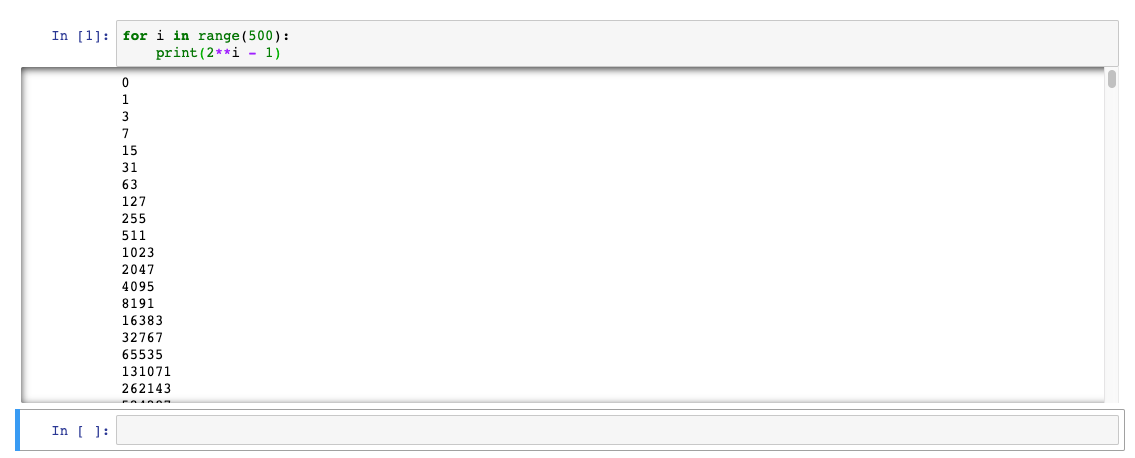
Note that the next code block added for you by default is a code block. For fun, go ahead and add the following code in it, and hit SHIFT_ENTER.
for i in range(500):
print(2**i - 1)
Your output should look like Figure 6.
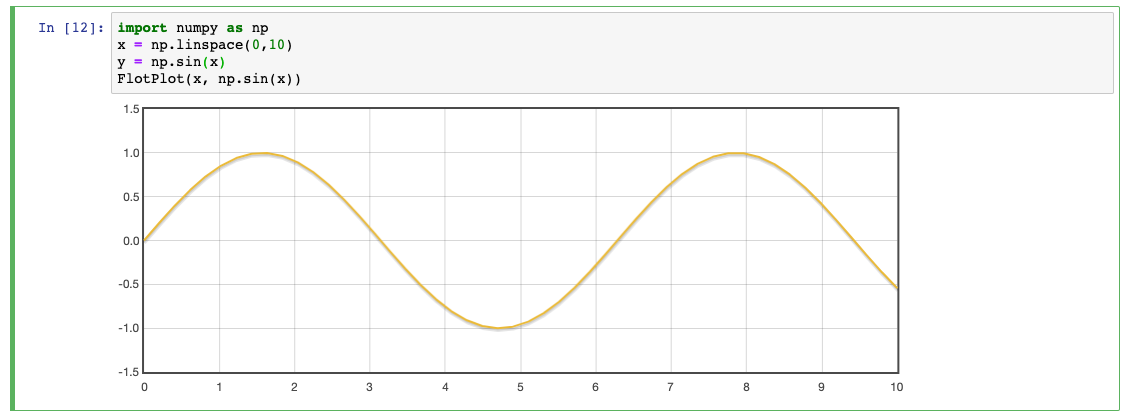
Let's try something more interesting now. Enter the code shown in Listing 1. Remember to execute it by hitting SHIFT_ENTER.
Listing 1: Use the Flot Javascript plotting library in Python
import json
import uuid
from IPython.display
    import display_javascript, display_html, display

class FlotPlot(object):
    def __init__(self, x, y):
        self.x = x
        self.y = y
        self.uuid = str(uuid.uuid4())

    def _ipython_display_(self):
        json_data = json.dumps(list(zip(self.x, self.y)))
        display_html(
            '<div id="{}"
                style="height: 300px;
                width:80%;"></div>'
            .format(self.uuid), raw=True)
        display_javascript("""require(["..removed../jquery.flot.min.js"],

function() {
    var line = JSON.parse ("%s");
    console.log(line);
    $.plot("#%s", [line]);
});

""" % (json_data, self.uuid), raw=True)
Once this code executes, enter the following code and hit SHIFT_ENTER.
import numpy as np
x = np.linspace(0,10)
y = np.sin(x)
FlotPlot(x, np.sin(x))
Verify that you see the output shown in Figure 7.
There's so much more to explore, but you get the idea. You can import packages on the fly, massage the data, and train the model. You can even visualize the data in so many different ways in an interactive environment, which is the Jupyter notebook.
Now you can do this entire thing locally, but where's the fun in that? Let's take things to the cloud.
Azure Notebooks
It's great that you can develop things locally, but there are a few downsides. You don't have enough processing power for serious applications, and you have to put in some work to get an environment working for you. All of this can be automated using Azure notebooks.
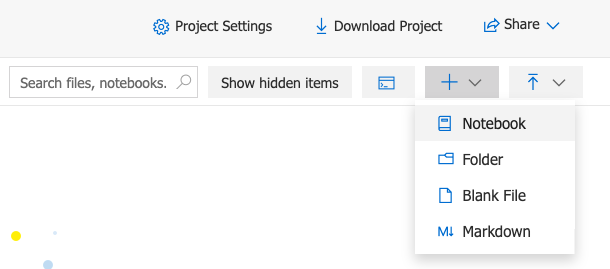
For this section, go ahead and sign up for Azure notebooks at https://notebooks.azure.com. Choose to create a new project there, and when in the project, choose to create a new Python 3.6 notebook, as shown in Figure 8.
As you can see, with a small amount of effort, I have a cloud-based environment ready to go. Now let's start writing some code.
My intention here is to walk you through the process and possibilities of these tools, so I won't explain every single line of code. But if you're interested, the Python notebooks I'm using can be found at this URL: https://github.com/Azure/MachineLearningNotebooks/blob/master/tutorials.
Clone that repository and upload the regression-part1-data-prep.ipynb notebook into Azure notebooks. Once uploaded, go ahead and run it.
At a high level, this notebook does the following steps:
- Load data from an Azure blob.
- Cleanse data, by:
- Removing
nullcolumns - Converting data into appropriate types, and filtering the data
- Splitting and renaming columns
- Cleaning up the data
- Removing
Once this notebook is run, verify that you have a file called dflows.dprep created in your project. You can see this file in Figure 9.
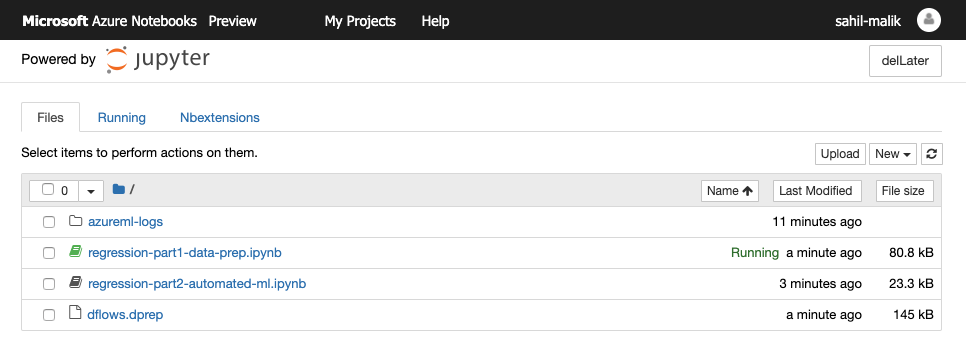
Also seen in Figure 9 is the second notebook I've uploaded, the regression-part2-automated-ml notebook.
If you also uploaded, your data is now prepared, and the output is the dflows.dprep file. Next, this second notebook is going to use that data and create a regression model out of it. Before you can use this notebook, you need to create yourself a machine learning service workspace in Azure.
In order to create a machine learning workspace, log into the Azure portal with a valid Azure subscription and choose to create a new “Machine learning service workspace”. Give it a name and resource group name and create it.
Next, note down a few things:
- The subscription ID
- The resource group
- And the workspace name.
With this information, back in your Azure notebooks project, create a file called aml_config\config.json with the following structure. Remember to put in the values from your workspace.
{
  "subscription_id": "<guid_subs_id>",
  "resource_group": "<your_resource_group>",
  "workspace_name": "<your_ml_workspace>"
}
At a high level, this notebook installs the necessary packages and configures your workspace using the config.json file. It's important to mention that you'll need to complete the device login flow to complete authentication here, or configure Service principal authentication or managed identity authentication.
Now you go about exploring the data. Although it's not necessary to create a model, it is helpful to visualize and see the data being loaded.
After the data is loaded and explored, split the data into training and testing sets. The code for this step can be seen in Listing 2. Remember why you do this? Because you want to train using some data and you want to test how good your model is using the test data. And although this may sound very high tech, in reality, it's a simple function call that can be randomized. Look at Listing 2 and you'll see a function called train_test_split that's doing exactly that.
Listing 2: Split the data into training and testing sets
from sklearn.model_selection import train_test_split

x_df = dflow_X.to_pandas_dataframe()
y_df = dflow_y.to_pandas_dataframe()

x_train, x_test, y_train, y_test = train_test_split(x_df, y_df, test_size=0.2, random_state=223)

y_train.values.flatten()
Once your data is split into test and train sets, you define some settings for autogeneration and tuning. Here, a number of things come into play. Imagine a three-dimensional space with a funnel like shape at the bottom and a tennis ball bouncing across this three-dimensional space.
The ball is going to bounce left and right, up and down, and eventually fall into the hole of the funnel. You want to find the right parameters so you can accurately map the space. You need to tune the parameters of the bounce so that the ball doesn't just roll into the funnel and you miss the entire space. This is conveniently referred to as “overfitting”. You also don't want the ball to bounce forever, so you don't end up spending a lot of compute time. Nor do you want the ball to just bounce off the plane into the ether.
You define certain metrics, or parameters, so the ball doesn't over-bounce or under-bounce, and you get reasonable results in a reasonable time frame. You can see the details in the cloned notebook, but my parameters use five cross-validation splits, a 10-minute iteration timeout for 30 iterations, etc. These parameters are trial and error and you get good at them with experience.
Next, define these parameters in an AutoMLConfig object, and define your training data and the type of model as regression. Remember, this is a regression problem you're solving: an infinite set of possible values between a min and max range. This can be seen in Listing 3.
Listing 3: Create an AutoMLConfig Object with our parameters
from azureml.train.automl import AutoMLConfig
automated_ml_config =
    AutoMLConfig(
      task = 'regression',
      debug_log = 'automated_ml_errors.log',
      path = project_folder,
      X = x_train.values,
      y = y_train.values.flatten(),
   **automl_settings)
With everything set up, you now train the model. This is where the heavy lifting comes in, but don't worry; all of the hard work has been done by the algorithm writers and the rest of it will be done by computers. You just have to issue a training job, as can be seen in Listing 4.
Listing 4: Train our model
from azureml.core.experiment import Experiment
experiment=Experiment(ws, experiment_name)
local_run = experiment.submit(automated_ml_config, show_output=True)
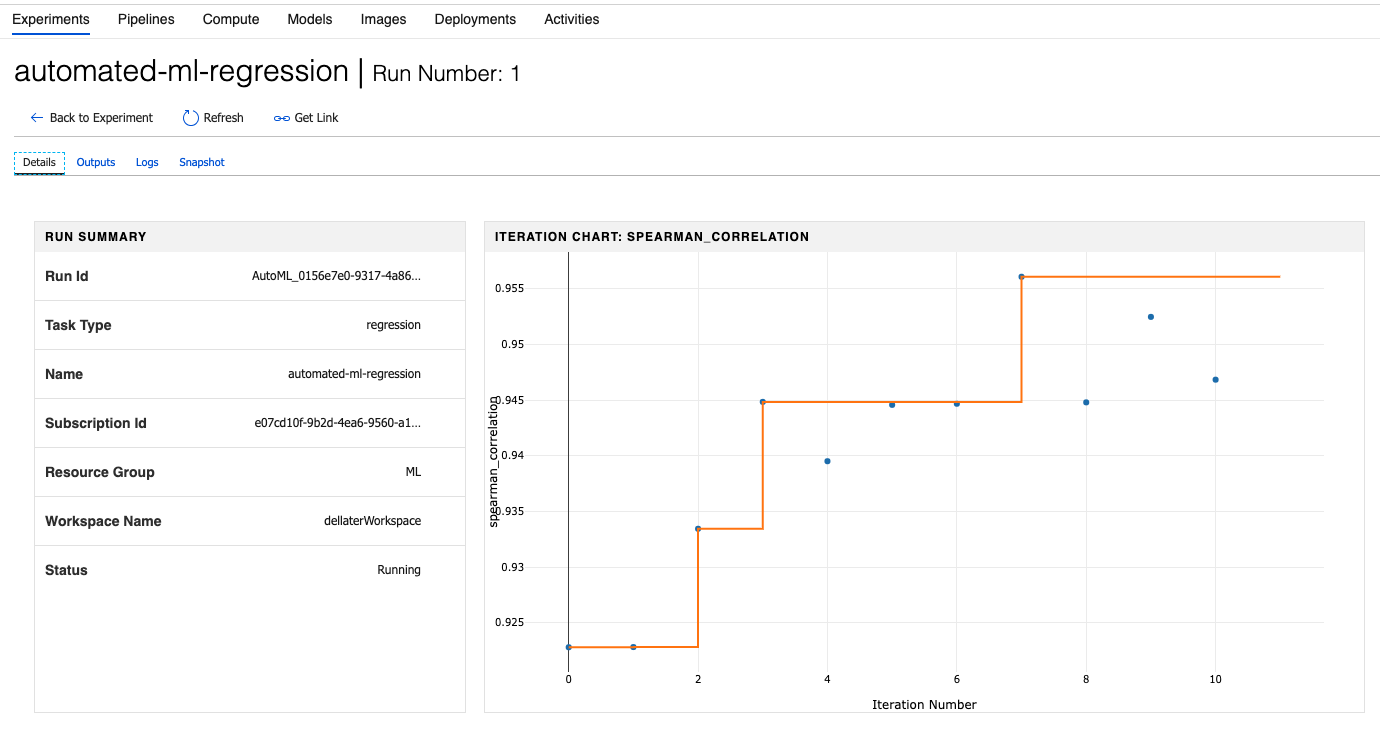
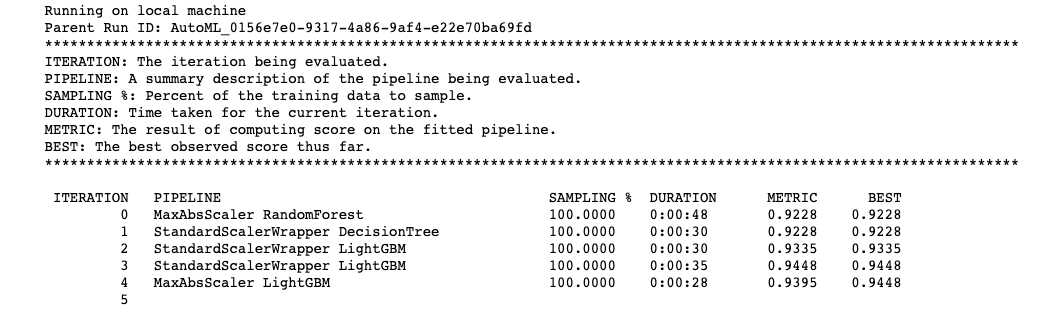
The show_output=True parameter allows you to view the progress as it's being made across iterations. At this point, you should be able to see the experiment running in your ML workspace in Azure, as can be seen in Figure 10.
You should also be able to see live progress of each iteration right inside the Jupyter notebook in Azure notebooks, as shown in Figure 11.
This will take 10-15 minutes to run. But step back for a second and admire the coolness factor of it. You could have run this notebook anywhere. The processing is anywhere, too. You can literally scale from your puny local CPU, or expand to the computing power of the cloud, with GPUs, FPGAs, and everything else at your disposal.
Now do you see what I mean when I say that AI is very approachable today with the help of the cloud? Just a few years ago, you'd have to buy an insane amount of hardware to do what you just did. In fact, I'm not sure such hardware was even available.
One thing you'll note is the “BEST” column. That's showing you the best running training score based on your metric type.
Now, grab yourself a coffee and come back in 10-15 minutes. Once the model is done running, let's examine the results.
There are numerous ways to examine the results. You could add a Jupyter widget to examine them graphically. You could examine all run iterations in Python. You could view the results directly in your Azure machine learning workspace. I think I'll leave all of this for a future article where I actually get to solve a real AI problem. For now, let's just stick with the process of AI.
The next thing you need to do is simply get the best-fitted model.
best_run, fitted_model = local_run.get_output()
print(best_run)
print(fitted_model)
Remember that you ran 30 iterations, and you had test and train data. So at any point, you know which model performed the best.
Next, you can test how good the best model is. This can be achieved with the following code:
y_predict = fitted_model.predict(x_test.values)
print(y_predict[:10])
As you can see, the model you think is the best has a method called predict. You just give it a bunch of test values and see what it returns. It should write out some numbers. Numbers are fine, but I'd love to see this information visually. For that, I'll use another Python library called matplotlib to create a scatter plot. The code to create this scatter plot can be seen in Listing 5.
Listing 5: Create a scatter plot
import matplotlib.pyplot as plt

fig = plt.figure(figsize=(14, 10))
ax1 = fig.add_subplot(111)

distance_vals = [x[4] for x in x_test.values]
y_actual = y_test.values.flatten().tolist()

ax1.scatter(distance_vals[:100], y_predict[:100], s=18, c='b', marker="s", label='Predicted')
ax1.scatter(distance_vals[:100], y_actual[:100], s=18, c='r', marker="o", label='Actual')

ax1.set_xlabel('distance (mi)')
ax1.set_title('Predicted and Actual Cost/Distance')
ax1.set_ylabel('Cost ($)')

plt.legend(loc='upper left', prop={'size': 12})
plt.rcParams.update({'font.size': 14})
plt.show()
Running this produces a scatter plot, as can be seen in Figure 12.
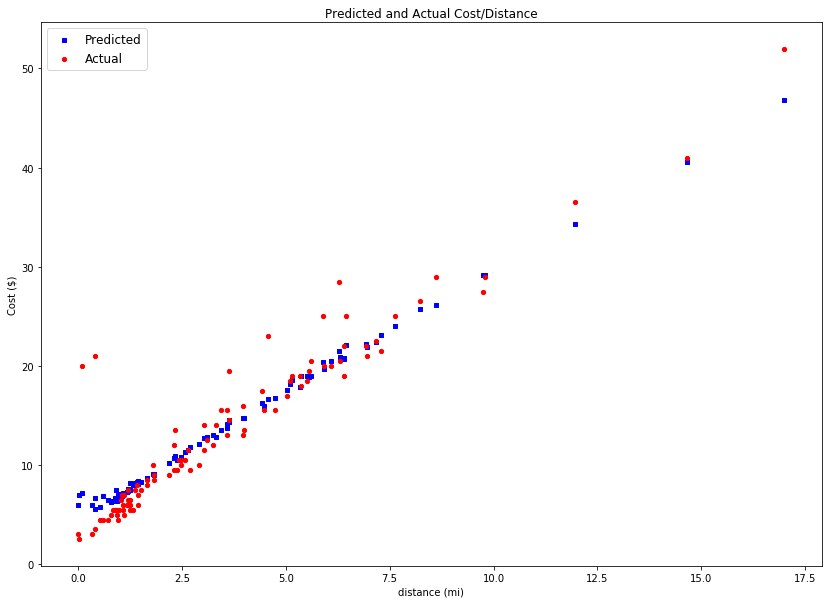
As is evident from the scatter plot, the AI based model is doing a pretty good job at predicting values (cost in $), for distance (miles).
Can you imagine a taxi service that could predict fares based on some random input conditions, such as distance, passengers, weather, time of the day, traffic patterns, etc.?
Summary
AI is real, and it's within your reach. But it's a very new field and the guidance on it is very spotty. Like anything, you get good at it with practice. To become one with the algorithms, the various networks, and massaging data, finding the right parameters is what takes practice.
The best way to learn swimming is to dive in. So dive in!
I hope this article, although I didn't have the luxury of explaining every nuance that you need to know, provided enough of a taste of what developing for AI feels like. In future articles, I hope to decipher some more interesting problems. Deployment, for instance.
In Azure, you'd take this model and create an image out of it, which you could easily deploy and scale to AKS. It's a fairly straightforward thing to do.
That and more, in future articles. Until then, it's not a bug, it's AI.