


In 2011, a Swiss computer scientist named Erich Gamma joined Microsoft. He's most known as one of the “gang of four” authors of the influential “Design Patterns” book. At Microsoft, Gamma led a small development lab out of Zurich, Switzerland. In April 2015, the team released the initial version of Visual Studio Code. I encourage you to watch this very interesting Visual Studio Code launch interview with Erich Gamma on Channel 9 (https://channel9.msdn.com/events/Build/2015/C9-05).
Visual Studio Code is a lightweight multiplatform IDE (Integrated Development Environment), that lets users add a wide variety of extensions (commonly called plug-ins in other IDEs). It's based on the Electron open-source framework.
Visual Studio Code started gaining popularity quickly and within four years, became the most popular IDE among developers. Why did it become so popular in such a short time? According to the Visual Studio Code team, they started dogfooding on very early stages of development. Now 100% of Visual Studio Code is written in Visual Studio Code itself.
“Dogfooding” is a term coined at Microsoft, meaning using your own product from very early stages of development.
But how can you compare it to its “big brother,” Microsoft Visual Studio? They don't share much, except the name and similar-looking icons. First, Visual Studio Code is available for free on all major platforms: Windows, macOS, and Linux.
The main advantages of Visual Studio Code, compared to Visual Studio, is its extensibility. It includes, in particular, the ability to introduce any programming language to it, to create syntax highlighting for any language, and to create a debugger for any language.
Of course, Visual Studio Code doesn't replace Visual Studio; there are still a few things that Visual Studio does on a much deeper level than Visual Studio Code. For instance, you can't write cross-platform Xamarin mobile apps in Visual Studio Code (at least not at the time of this writing). You'd also choose Visual Studio if you target Windows GUI development. But this might change in the future.
The main purpose of Visual Studio Code is to support the developer lifecycle (or, rather, a loop): Coding (using Rich Language Services) > Debugging > Checking your code in (using the Git Source Control integration).
In this article, I'm going to talk about adding some of the Rich Language Services, about the REPL language interpretation, and about debugging.
As an example of a language to be added to the Visual Studio Code (I'll call it VS Code in this article for brevity), I'm going to use CSCS (Custom Scripting in C#). It's an open-source light scripting language that I introduced in my previous articles for CODE Magazine (https://www.codemag.com/article/1607081 and https://www.codemag.com/article/1711081).
Adding Language Support to Visual Studio Code
There are several levels of adding the Rich Language Services to an IDE.
- The first level is basic language support (e.g., syntax highlighting, brackets matching, auto-indenting).
- The second level is IntelliSense support (code completion, parameter info, content assist, and some others).
- The third level is code refactoring.
All Rich Language Services are supported by VS Code.
In this article, I'm going to cover the first level only.
You're going to develop a VS Code extension in the TypeScript language. TypeScript is a type-safe superset of JavaScript. You can read an introduction to it in this CODE Magazine article from Sahil Malik (https://www.codemag.com/article/1511051).
Adding Syntax Highlighting and Basic Language Support
After downloading and installing VS Code, install Node.js (https://nodejs.org/en/). To be able to publish an extension, you must also create a Visual Studio Team Services account (Editor: VSTS is now Azure DevOps). Upon registration, you receive the publisher name that you'll need when generating an extension below.
I'm going to show you how to add a new language support on a first level, including:
- Syntax highlighting
- Brackets matching
- Auto indenting
The cool thing about VS Code is that you won't need any coding at all to add these features! Everything can be made via configuration. Let's get started.
Go to the command line and first install the Yeoman Extension Generator by running:
npm install -g yo generator-code
If you're on macOS or Linux and you don't have permissions to run the command above, try prepending "sudo " to the command above.
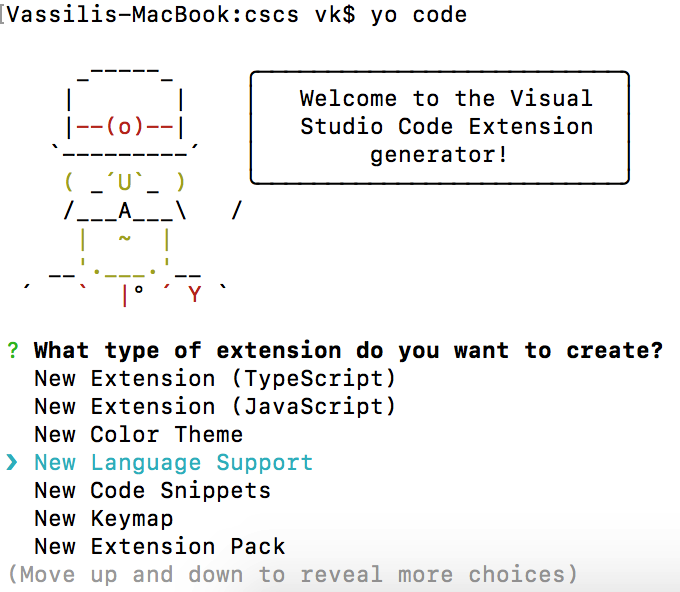
After installing the “yo” tool, you can run the extension generator like this:
yo code
As a type of extension, select the New Language Support option (see Figure 1).
Then answer questions similar to Figure 2.
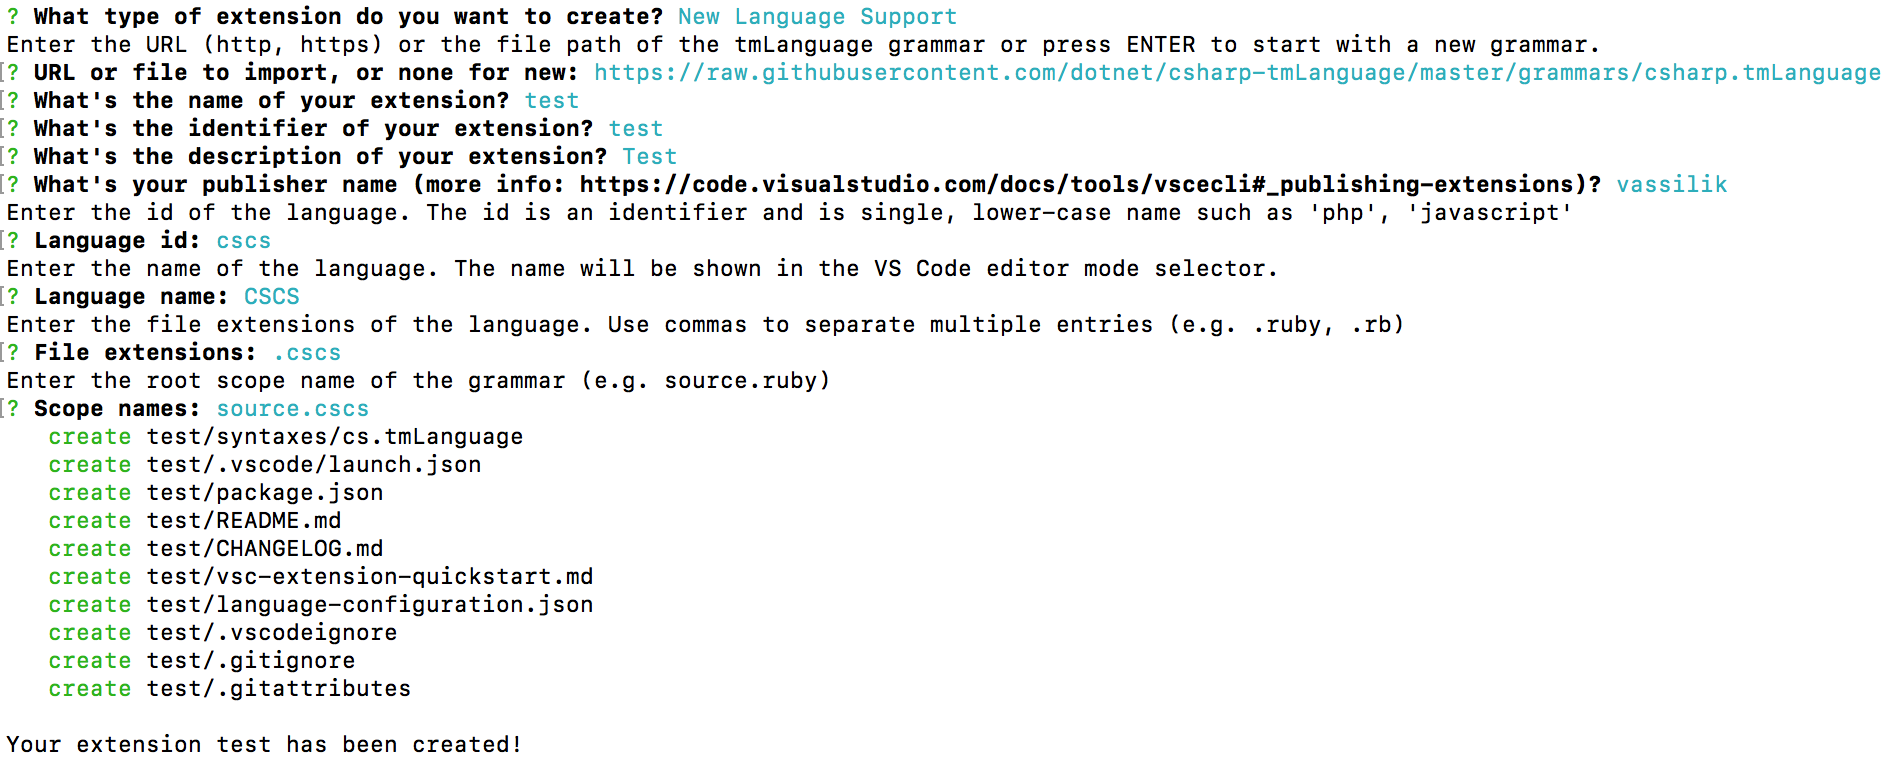
For the publisher name, select the name you used when you created the Visual Studio Team Services account. For language support, Visual Studio Code uses the TextMate language grammars (see https://manual.macromates.com/en/language_grammars). The files that define the grammar have the .tmLanguage extension. This grammar is also used for syntax highlighting. Writing such a file from scratch is quite an exercise. Because syntactically CSCS is similar to C#, I just took a file defining the C# grammar (https://raw.githubusercontent.com/dotnet/csharp-tmLanguage/master/grammars/csharp.tmLanguage) and provided it when creating the language support extension (see Figure 2).
Once the language support is created, the cs.tmLanguage file will be copied to the syntaxes subfolder. To make it work for CSCS, you have to do a few changes there. First of all, rename the cs.tmLanguage file name to cscs.tmLanguage. Then open this file in VS Code, and replace of the occurrences of .cs with .cscs.
Because CSCS isn't identical to C#, there are also some other changes you should do. For example, CSCS has elif keyword, which doesn't exist in C#. To add this keyword to the language grammar, the easiest way is to find how it's done for else, and just “borrow” the corresponding code. See Listing 1 for details.
Listing 1: Additions to the cscs.tmLanguage File
<dict>
<key>include</key>
<string>#elif-part</string>
</dict>
<key>elif-part</key>
<dict>
<key>begin</key>
<string>(?<!\.)\b(elif)\b</string>
<key>beginCaptures</key>
<dict>
<key>1</key>
<dict>
<key>name</key>
<string>keyword.control.conditional.elif.cscs</string>
</dict>
</dict>
<key>end</key>
<string>(?<=\})|(?=;)</string>
<key>patterns</key>
<array>
<dict>
<key>include</key>
<string>#statement</string>
</dict>
</array>
</dict>
You also need to add the new language definition in the package.json file (this file was generated by the extension generator). You add the CSCS language definition to the contributes part of package.json:
"contributes": {
    "languages": [{
        "id": "cscs",
         "aliases": ["CSCS", "cscs"],
         "extensions": [".cscs"],
         "configuration": "./language-configuration.json"
    }],
    "grammars": [{
        "language": "cscs",
        "scopeName": "source.cscs",
        "path": "./syntaxes/cscs.tmLanguage"
    }],
The language-configuration.json file was also generated by the extension generator. Basically, it contains definitions of opening and closing braces, brackets, quotes, comments, etc. This is, for instance, how the language comments and brackets are defined:
"comments": {
    "lineComment": "//",
    "blockComment": [ "/*", "*/" ]
},
"brackets": [
    ["{", "}"],
    ["[", "]"],
    ["(", ")"]
],
If you want to introduce a new comment or bracket type, the language-configuration.json is the file to do that.
That's it! With just these few configuration changes, you already have an extension that supports syntax highlighting!
If you want to see the newly created extension in action, switch to the Debug view by clicking on the debug icon on the VS Code left-side panel and then press the gear icon. A new instance of VS Code is opened. This new instance is now aware of the extension and the new syntax highlighting should be shown for all files with the .cscs extension.
To see the newly created extension in action, click on the debug icon on the VS Code's left-side panel and press the gear icon.
It probably doesn't make much sense to publish an extension supporting only syntax highlighting, because you're going to develop some other language features as well and you can include the syntax highlighting together with other features.
Adding a REPL Extension
REPL (read eval print loop) is an interactive computer environment that permits evaluating simple user inputs and returning the results. Usually the user selects some parts of the code and sends it for evaluation. If nothing is selected, the whole line is sent for evaluation. The cool thing about REPL is that you can even select a commented-out statement and send it for evaluation!
In this section, you're going to develop a REPL extension for the CSCS language. You'll see that it's easy to adjust for any other language of your choice.
First, you again use the yo extension generation tool that you used in the previous section. This time, you choose the extension type New Extension (TypeScript) (this is the default extension type). Then you copy the language files you generated in the previous section (syntaxes\cscs.tmLanguage and language-configuration.json) to the new extension folder. Now you can open the newly generated extension folder in VS Code.
The first task is to create a new command, which will send the REPL request for evaluation. Most of these types of tasks are located under the contributes section in the package.json file.
Let's call the REPL command extension.cscs.repl (the name really doesn't matter) and assign it a key of Control + 9 on Windows and Linux and Command ? +9 on macOS. This can be done in the contributes section of the package.json file as follows:
"commands": [{
   "command": "extension.cscs.repl",
   "title": "CSCS REPL"
}],
"keybindings": [{
   "command": "extension.cscs.repl",
   "key": "ctrl+9",
   "mac": "cmd+9",
   "when": "editorTextFocus"
}],
You also have to tell VS Code when the extension will be activated. This is done in the activationEvents section of package.json:
"activationEvents": ["onCommand:extension.cscs.repl"],
What this means is that the extension will be activated as soon as the user hits the Cmd+9/Ctrl+9 keys.
One of the very important sections of the package.json file is the devDependencies section that contains all the packages that your extension is using and their minimum versions:
"devDependencies": {
    "typescript": "^2.6.1",
    "vscode": "^1.1.6",
    "tslint": "^5.8.0",
    "@types/node": "^7.0.43",
    "@types/mocha": "^2.2.42"
}
You add new packages to that section and after any change, you must run the npm install command in the project folder directory.
Take a look at the full contents of the package.json file in Listing 2.
Listing 2: A Fragment of the REPL Project package.json File
{
    "name": "cscs-repl",
    "displayName": "CSCS REPL",
    "version": "0.1.4",
    "publisher": "vassilik",
    "engines": {
        "vscode": "^1.24.0"
    },
    "categories": ["Programming Languages","Other"],
    "keywords": ["CSCS", "repl", "scripting", "interpreter", "C#"],
    "activationEvents": ["onCommand:extension.cscs.repl"],
    "icon": "images/cscs128.png", "repository": {
        "type": "git",
        "url": "https://github.com/vassilych/cscs-repl.git"},
    "license": "MIT",
    "main": "./out/extension",
    "contributes": {
        "commands": [{
            "command": "extension.cscs.repl",
            "title":   "CSCS REPL"
        }],
        "keybindings": [{
            "command": "extension.cscs.repl",
            "key": "ctrl+9",
            "mac": "cmd+9",
            "when": "editorTextFocus"
        }],
        "configuration": {
            "type": "object",
            "title": "CSCS REPL configuration",
            "properties": {
                "cscs.connectType": {
                    "type": "string",
                    "default": "sockets"
                },
                "cscs.serverPort": {
                    "type": "number",
                    "default": 13337
                },
                "cscs.serverHost": {
                    "type": "string",
                    "default": "127.0.0.1
                }
            }
        },
        "languages": [{
            "id": "cscs",
            "aliases": ["CSCS", "cscs"],
            "extensions": [".cscs"],
            "configuration": "./language-configuration.json"
        }],
        "grammars": [{
            "language": "cscs",
            "scopeName": "source.cscs",
            "path": "./syntaxes/cscs.tmLanguage"
        }]
    },
    "devDependencies": {
        "typescript": "^2.6.1",
        "vscode": "^1.1.6",
        "tslint": "^5.8.0",
        "@types/node": "^7.0.43",
        "@types/mocha": "^2.2.42"
    }
}
The programming language of the extension that you chose is TypeScript. The beauty of the VS Code extensions is that the actual functionality implementation can be in any language. The extension's TypeScript code communicates with the VS Code Framework and receives user commands from it. Then it sends these commands to the REPL evaluator, which will do the actual work and communicate the results back to the extension.
I decided to implement the communication between the extension and the REPL evaluator via sockets. The REPL evaluator will be started in Visual Studio Xamarin (as I mentioned before, there's no support for running and debugging cross-platform mobile apps in VS Code, at least not yet).
Implementation of the REPL Evaluator
To collect all requests from a REPL client, use a queue, implemented as a BlockingCollection class from the System.Collections.Concurrent namespace. The main advantage of this class is that it provides a thread-safe way of enqueueing items to a specified queue and dequeueing them from there, so that we don't have to concentrate on these low-level details.
There are different scenarios that the REPL evaluator server must support:
- In case the server is running a Xamarin mobile app, the code must be evaluated on the main GUI thread. This is done as follows:
On iOS:
UIApplication.SharedApplication.InvokeOnMainThread(() => {
// This code is run on the main thread.
});
On Android:
Activity.RunOnUiThread(()
    => {
// This code is run on the main thread.
});
In case the evaluator runs on Unity, there's no need to schedule running code on the main thread because Unity calls the
Update()method on the main thread every frame. At the end of theUpdate(), you can process all of the queued requests.In case of a console application, or when the evaluator doesn't need to run on the main thread, you can process all of the requests on the same thread.
In case of a Xamarin mobile app, the code must be evaluated on the main GUI thread.
I implemented the above three scenarios. Obviously, there are many more scenarios when the code needs to be run on the main thread that you may want to add. For instance, if you want to evaluate code on the Windows Phone main thread, you schedule the call as follows:
CoreApplication.MainView.CoreWindow.Dispatcher.RunAsync(CoreDispatcherPriority.High, () => {
// This code is run on the main thread.
});
The DebuggerServer class is implemented in Listing 3. I'll review it shortly.
Listing 3: A Fragment of the DebuggerServer C# Class
public class DebuggerServer
{
    public static Action<Debugger, string> OnRequest;
    public static bool DebuggerAttached { set; get; }

    static Debugger m_debugger
    static TcpClient m_client;
    static NetworkStream m_stream;

    static BlockingCollection<string> m_queue = new BlockingCollection<string>();

    public static void StartServer(int port = 13337)
    {
        ThreadPool.QueueUserWorkItem(StartServerBlocked, port);
    }

    public static void StartServerBlocked(Object threadContext)
    {
        int port = (int)threadContext;
        IPAddress localAddr = IPAddress.Parse("127.0.0.1");
        TcpListener server = new TcpListener(localAddr, port);
        server.Start();
        DebuggerAttached = true;

        while (true) {
        // Perform a blocking call to accept requests.
        m_client = server.AcceptTcpClient();
        m_stream = m_client.GetStream();
        ThreadPool.QueueUserWorkItem(RunClient);
        }
    }

    static void RunClient()
    {
        Byte[] bytes = new Byte[1024];
        string data = null;
        int i;

        ThreadPool.QueueUserWorkItem(StartProcessing, null);
        m_debugger = new Debugger();
        Debugger.OnResult += SendBack;

        try {
            while((i = m_stream.Read(bytes, 0, bytes.Length)) != 0) {
                data = System.Text.Encoding.UTF8.GetString(bytes, 0, i);
                m_queue.Add(data);
            }
        } catch(Exception exc) {
            Console.Write ("Client disconnected: {0}", exc.Message);
        }
        Debugger.OnResult -= SendBack;
        m_client.Close();
    }

    static void StartProcessing(Object threadContext)
    {
#if UNITY_EDITOR
    // ProcessQueue will be called directly from Unity Update()
# else
    try {
            ProcessQueue();
        } catch(Exception exc) {
          Console.Write("Connection is over: {0}", exc.Message);
        }
#endif
    }

    public static void ProcessQueue()
    {
        string data;
#if UNITY_EDITOR
    while(m_queue.TryTake(out data)) {
#else
        while (true)
        {
            // A blocking call
            data = m_queue.Take();
#endif
        if (OnRequest != null) {
            OnRequest?.Invoke(m_debugger, data);
        }   else {
            m_debugger.ProcessClientCommands(data);
            }
        }
    }
    static void SendBack(string str)
    {
        byte[] msg = System.Text.Encoding.UTF8.GetBytes(str);
        try {
            m_stream.Write(msg, 0, msg.Length);
            m_stream.Flush();
        }   catch(Exception exc) {
            Console.Write("Client disconnected: {0}", exc.Message);
            return;
            }
    }
}
The server is started either asynchronously via calling StartServer() or as a blocked call to StartServerBlocked(). The server initializes server sockets on the configured port (by default, it's 13337) and starts listening for the incoming connections:
IPAddress localAddr = IPAddress.Parse("127.0.0.1");
TcpListener server = new TcpListener(localAddr, port);
server.Start();
DebuggerAttached = true;

while (true) {
    m_client = server.AcceptTcpClient();
    m_stream = m_client.GetStream();
    ThreadPool.QueueUserWorkItem(RunClient);
}
For each accepted connection, the server runs the RunClient() method, which will be started in a new pool thread.
The RunClient() method, on one hand, starts listening for the client requests, adding them all to the BlockingCollection m_queue:
while((i = m_stream.Read(bytes, 0, bytes.Length)) != 0) {
    data = Encoding.UTF8.GetString(bytes, 0, i);
    m_queue.Add(data);
}
On the other hand, it starts another thread that consumes this queue in the ProcessQueue() method. This method can be called directly from Unity; it won't do anything if the queue is empty, otherwise it processes the queue. The OnRequest event handler is null in case of Unity, so this is the code executed in Unity Update() method called on the main thread:
while(m_queue.TryTake(out data)) {
    m_debugger.ProcessClientCommands(data);
}
The ProcessClientCommands() method is where the actual processing takes place; you'll see it later on. In other cases, you execute a call to the queue m_queue.Take(), which blocks until the queue's not empty.
while(true) { // A blocking call.
    data = m_queue.Take();
    if (OnRequest != null) { // iOS/Android case
        OnRequest?.Invoke(m_debugger, data);
    }   else { // Direct call case
        m_debugger.ProcessClientCommands(data);
    }
}
In case of Xamarin (iOS/Android apps), an event handler is triggered. That event handler makes sure that the processing is done on the main thread. In other cases, you start processing the queue on the same thread (you probably don't care on which thread to do processing in console applications).
Now let's see how you can let CSCS Xamarin apps know that they must be aware of clients waiting for the REPL evaluations on the main thread. You first register a CSCS function with the CSCS Parser:
ParserFunction.RegisterFunction("StartDebugger", new DebuggerFunction());
This means that calling a CSCS function StartDebugger calls the DebuggerFunction.Evaluate() method behind the scenes, as shown in Listing 4.
Listing 4: Implementation of the DebuggerFunction C# Class
class DebuggerFunction : ParserFunction
{  protected override Variable Evaluate(ParsingScript script)
    {
        List<Variable> args = script.GetFunctionArgs();
        int port = Utils.GetSafeInt(args, 0, 13337);
        DebuggerServer.StartServer(port);

        DebuggerServer.OnRequest += ProcessRequest;
        return Variable.EmptyInstance;
    }
    public void ProcessRequest(Debugger debugger, string request)
    {
#if __ANDROID__
        MainActivity.TheView.RunOnUiThread(() => {
            debugger.ProcessClientCommands(request);
        });
#elif __IOS__
        UIApplication.SharedApplication.InvokeOnMainThread(() => {
            debugger.ProcessClientCommands(request);
        });
Else
        debugger.ProcessClientCommands(request);
#endif
    }
}
This method starts the REPL server and subscribes to the incoming client requests:
DebuggerServer.StartServer(port);
DebuggerServer.OnRequest += ProcessRequest;.
When the ProcessRequest() method is triggered, it makes sure that each request is processed on the main thread:
public void ProcessRequest(Debugger debugger, string request) {
#if __ANDROID__
    MainActivity.TheView.RunOnUiThread(() => {
        debugger.ProcessClientCommands(request);
    });
#elif __IOS__
    UIApplication.SharedApplication.InvokeOnMainThread( () => {
        debugger.ProcessClientCommands(request);
    });
}
It's in the ProcessRequest() method where you may want to add other scenarios you need (Windows Phone, WPF, etc.).
Unity is a special case. Because the Update() method is called on the main thread, it's enough to put the following statement at the end of the Update() method (see the implementation of the ProcessQueue() method in Listing 3):
if (DebuggerServer.DebuggerAttached) {
    DebuggerServer.ProcessQueue();
}
Unity is a special case, because the
Update()method is called already on the main thread.
Now it's time to take a look at the actual processing. Because the server may receive several requests from the client at once (they can get queued, as you'll see later when developing the client in TypeScript), you have to process the requests one by one. The supposition here is that a request doesn't contain a new line - you'll make sure that the client takes care of that.
Note that not having new lines in the data request won't be a problem because new lines don't play any role in CSCS, unlike in Python. In CSCS, the expressions are separated by semicolons, like in C#.
public void ProcessClientCommands(string data)
{
    string [] commands = data.Split(new char [] {'\n'});
    foreach (string dataCmd in commands) {
        if (!string.IsNullOrWhiteSpace(dataCmd)) {
            ProcessClientCommand(dataCmd);
        }
    }
}
This is a fragment of how you process each request (a fragment because you're going to extend this method when developing a debugger):
void ProcessClientCommand(string data) {
    string [] parts = data.Split(new char [] {'|'});
    string cmd = parts[0].ToLower();
    string result = "N/A";
    if (cmd == "repl") {
        result = ProcessRepl(data.Substring(cmd.Length+1));
        SendBack(result);
        return;
    }
}
As you can see, the server expects a request from the client in the following format: command|request data. In particular, for REPL, it expects repl|string to process.
The SendBack() method is a lower-level function that sends back the result:
static void SendBack(string str) {
    byte [] msg = Encoding.UTF8.GetBytes(str);
    try {
        m_stream.Write(msg, 0, msg.Length);
        m_stream.Flush();
    }   catch (Exception exc) {
        Console.Write("Client gone: {0}", exc.Message);
        return;
    }
}
The ProcessRepl() method does the actual CSCS processing. Its implementation is shown in Listing 5. This is where you can customize the REPL processing and use any other language of your choice.
Listing 5: ProcessRepl() C# Method
string ProcessRepl(string repl)
{
    Dictionary<int, int> char2Line;
    string script = Utils.ConvertToScript(repl, out char2Line);
    ParsingScript tempScript = new ParsingScript(script, 0);
    tempScript.Debugger = this;
    Variable result = null;
    try {
        while (tempScript.Pointer < script.Length) {
            result = tempScript.ExecuteTo();
            tempScript.GoToNextStatement();
        }
    }   catch (Exception exc) {
        return "Exception thrown: " + exc.Message;
    }

    string stringRes = Output + "\n";
    stringRes += result == null ? "" : result.AsString();
    return stringRes;
}
Implementation of the REPL Client
You'll be implementing the REPL client using TypeScript (when you were creating the extension using the yo tool, there were only two options for the extension language, JavaScript and TypeScript).
The entry point of a VS Code extension is the activate() method of the extension.ts file. Its implementation is shown in Listing 6.
Listing 6: The activate() Method of extension.ts
import * as vscode from 'vscode';
import { CscsRepl } from './cscsRepl';

export function activate(context: vscode.ExtensionContext) {
    const config = vscode.workspace.getConfiguration('cscs');
    let connectTypeConfig = config.get('connectType');
    let hostConfig        = config.get('serverHost');
    let portConfig        = config.get('serverPort');
    let connectType   = connectTypeConfig ? connectTypeConfig.toString() : '';
    let host   = hostConfig ? hostConfig.toString() : '';
    let port   = portConfig ? parseInt(portConfig.toString()) : 0;

    let cscsRepl = new CscsRepl();
    cscsRepl.start(connectType, host, port);

    let outputChannel = vscode.window.createOutputChannel('CSCS');

    cscsRepl.on('onInfoMessage', (msg : string) => {
        vscode.window.showInformationMessage('REPL: ' + msg);
    });
    cscsRepl.on('onReplMessage', (data : string) => {
        outputChannel.append('REPL> ');
        let lines = data.toString().split('\n');
        let counter = 0;
        for (let i = 0; i < lines.length; i++) {
            let line = lines[i].trim();
            outputChannel.appendLine(line);
            counter++;
        }
    });

    const getCode = () => {
        let textEditor = vscode.window.activeTextEditor;
        if (!textEditor) {
            return "";
        }
        let selection = textEditor.selection;
        let text = textEditor.document.getText(selection);
        if (textEditor.selection.start.line === textEditor.selection.end.line &&
        textEditor.selection.start.character === textEditor.selection.end.character) {
            text = textEditor.document.lineAt(textEditor.selection.start.line).text;
        }
        return text;
    };

    let disposable = vscode.commands.registerCommand('extension.cscs.repl', () => {
        let code = getCode();
        if (code === '') {
            return;
        }
        cscsRepl.sendToServer('repl', code);
    });
    context.subscriptions.push(disposable);
}
First, it reads the configuration that you defined in the package.json file, namely:
"properties": {
    "cscs.connectType": {
        "type": "string",
        "default": "sockets"
    },
    "cscs.serverPort": {
        "type": "number",
        "default": 13337
    },
    "cscs.serverHost": {
        "type": "string",
         "default": "127.0.0.1"
    }
}
After reading the configuration, you connect to the Debugger that you implemented in the previous section. The code, implementing connection via sockets, is in the CscsRepl class, implemented in cscsRepl.ts. It's shown in Listing 7.
Listing 7: Connecting to the Debugger in Typescript
const Net               = require("net");
private _debugger       = new Net.Socket();
private _queuedCommands = new Array<string>();

public start(connectType: string, host: string, port: number) {
    if (this._init) {
        return;
    }
    this._init = true;
    this._connectType = connectType;
    this._host = host;
    this._port = port;
    this.connectToDebugger();
}

public connectToDebugger() : void {
    this._connected = false;

    if (this._connectType === "sockets") {
        console.log('Connecting to ' + this._port + " on  " + this._host + "...");
        this._debugger.connect(this._port, this._host, () => {
            this._connected = true;
            this.printInfoMsg('Connected to the server at ' + this._host + ":" + this._port);
            for (let i = 0; i < this._queuedCommands.length; i++) {
                this.sendToServer(this._queuedCommands[i]);
            }
            this._queuedCommands.length = 0;
        });

        this._debugger.on('data', (data : string) => {
            this.processFromDebugger(data.toString().trim());
        });

        this._debugger.on('close', () => {
            if (!this._connected) {
                this.printErrorMsg("Couldn't connect to " + this._host + ":" + this._port);
            }
            this._connected = false;
        });
    }
}
Note that you subscribe to the messages from CscsRepl and show them like pop-ups using this code:
cscsRepl.on('onInfoMessage', (msg : string) => {
    vscode.window.showInformationMessage('REPL: ' + msg);
});
Inside of CscsRepl, you pass the messages to the subscribers like this:
public printInfoMsg(msg : string) {
    this.sendEvent('onInfoMessage', msg);
}
protected processFromDebugger(data : string) {
    this.sendEvent('onReplMessage', msg);
}
The actual output from the debugger is shown in the extra output window, titled CSCS, that you created in this statement:
let outputChannel = vscode.window.createOutputChannel('CSCS');
The main part of the extension.ts activate() method is the implementation of the extension.cscs.repl command, that you previously defined in package.json:
let disposable=vscode.commands.registerCommand('extension.cscs.repl', () => {
    let code = getCode();
    if (code === '') {
        return;
    }
    cscsRepl.sendToServer('repl', code);
});
Each time the user executes the extension.cscs.repl command, you get what she has selected in the editor (using getCode() method, shown in Listing 8) and then send her selection to the server (see Listing 9). All of the replies from the server are shown in the cscsRepl.on('onReplMessage') method, also shown in Listing 8.
Listing 8: Sending REPL to the Debugger in Typescript
public sendToServer(cmd : string, data = "") {
    if (this._finished) {
        return;
    }
    let lines = data.split('\n');
    let load = "";
    for (let i = 0; i < lines.length; i++) {
        let lineData = lines[i].trim();
        if (lineData === "") {
            continue;
        }
        let lines2 = lineData.split('\r');
        load = load + lines2[0];
    }
    if (load !== "" || !cmd.includes('|')) {
        cmd = cmd + "|" + load;
    }
    if (!this._connected) {
        this._queuedCommands.push(cmd);
        return;
    }
    this._debugger.write(cmd + "\n");
}
Listing 9: A Fragment of the CSCS Debugger Project package.json File
"name": "cscs-debugger",
"displayName": "CSCS Debugger",
"activationEvents": ["onDebug"],
"contributes": {
    "languages": [{
        "id":           "cscs",
        "aliases":      ["CSCS", "cscs"],
        "extensions":   [".cscs"],
        "configuration": "./language-configuration.json"
    }],
    "breakpoints": [{"language": "cscs"}],
    "debuggers": [{
        "type": "cscs",
        "label": "CSCS Debug",
        "program": "./out/debugAdapter.js",
        "runtime": "node",
        "configurationAttributes": {
            "launch": { "required": ["program"] },
            "properties": {
                "program": {
                    "type": "string",
                    "description": "Absolute path to a text file.",
                    "default": "${workspaceFolder}/${command:AskForProgramName}"
                },
                "serverPort": {
                    "type": "number",
                    "description": "Number of the server port to connect to.",
                    "default": 13337
                },
            }
        }
    }
That's it! You saw the client and server implementations, so now's the time to see how the REPL works in real life.
The REPL Client in Action
Let's see how to use a REPL evaluator with the iOS debugging. Download the CSCS Xamarin project from https://github.com/vassilych/mobile. The VS Code CSCS REPL extension can be installed from https://marketplace.visualstudio.com/items?itemName=vassilik.cscs-repl.
The start.cscs script is where the CSCS processing starts. You can put just one statement in there:
StartDebugger();
This statement will start listening for the incoming connections on the default port 13337 (you can supply any other port number as an argument to the StartDebugger() function). Then start running the Xamarin project in the debug mode, choosing either a simulator or a real device. Xamarin starts an iOS app with an empty screen.
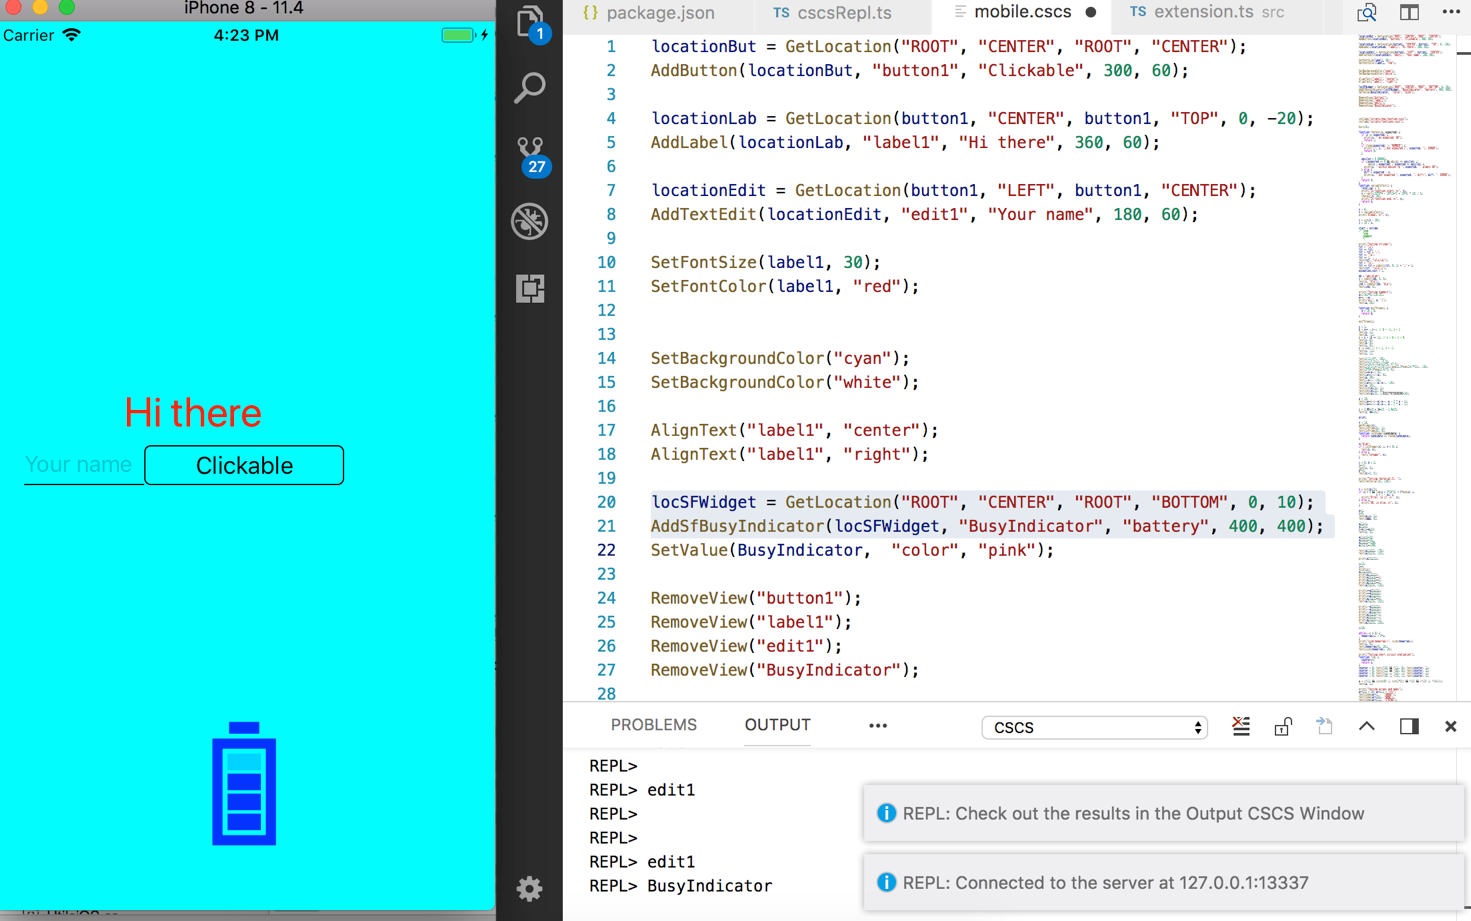
Using the REPL VS Code extension, you can add widgets to the iOS app on the fly.
Now you can start adding widgets to the iOS app on the fly, using the REPL evaluator from VS Code. See Figure 3 for some examples. You can also remove widgets, change labels, introduce new actions, and so on. Using the REPL evaluator is the fastest way to get the layout you need without restarting the debugger. Isn't it cool?
Adding a Debugger to Visual Studio Code
Implementing a debugger in VS Code is a bit more involved than implementing a REPL interpreter. I recommend that you read the Microsoft introduction (https://code.visualstudio.com/docs/extensions/example-debuggers) about writing a VS Code extension for a mock debugger. The mock debugger there imitates a connection to a real debugger. Here you're going to see the debugger extension connecting to the real debugger server.
First, create a new extension the same way you did before, using the yo command-line tool.
You also need to include more dependencies to implement a debugger, in particular, two npm modules: vscode-debugprotocol and vscode-debugadapter. See the contents of the package.json file in Listing 9. Note that after doing any changes related to the npm modules used by your extension, you need to run the npm install command, which downloads the corresponding modules to the node_modules folder under your project directory.
The structure of a VS Code Debugger project is different from a normal extension, like the REPL one you developed in the previous section.
First of all, the main actions aren't triggered by the extension activate method. The debugger itself runs as a stand-alone program, a so-called debug adapter. In order to implement a debugger, you must implement the debug adapter protocol. You'll see how to do it in the next sections.
The debugger that you're going to implement can perform the following debugger tasks:
- Setting and unsetting breakpoints
- Next, Continue, Step-in, and Step-out commands
- Keeping track of the local and global variables
- Keeping track of the variables being watched
- Keeping track of the call stack
- Showing variable values by hovering the mouse over them
- Showing function definitions by hovering the mouse over function names
- Handling code exceptions
The Debugger Client
On the client side, CscsDebugSession is the main debugger class. Like in the REPL case, all of the client code is in TypeScript. It extends and implements the LoginDebugSession, which extends the DebugSession class. Check out the fragments of its implementation in Listing 10. You can see the full implementation on GitHub (the link is provided in the sidebar).
Listing 10: Fragments of the CscsDebugger TypeScript Class
export class CscsDebugSession extends LoggingDebugSession {
    private static THREAD_ID = 1;
    private _runtime: CscsRuntime;

    public constructor() {
        super("cscs-debug.txt");
        this.setDebuggerLinesStartAt1(false);
        this.setDebuggerColumnsStartAt1(false);

        this._runtime = new CscsRuntime();
        this._runtime.on('stopOnStep', () => {
            this.sendEvent(new StoppedEvent('step', CscsDebugSession.THREAD_ID));
        });
        this._runtime.on('stopOnBreakpoint', () => {
            this.sendEvent(new StoppedEvent('breakpoint', CscsDebugSession.THREAD_ID));
        });
        this._runtime.on('output', (text, filePath, line, column) => {
            const e: DebugProtocol.OutputEvent = new OutputEvent(`${text}\n`);
            e.body.source = this.createSource(filePath);
            e.body.line = this.convertDebuggerLineToClient(line);
            this.sendEvent(e);
        });
    }

    protected initializeRequest(response: DebugProtocol.InitializeResponse,
                                    args: DebugProtocol.InitializeRequestArguments): void {

        response.body = response.body || {};
        response.body.supportsEvaluateForHovers = true;
        response.body.supportsStepBack = false;
        response.body.supportsSetVariable = false;
        response.body.supportsRestartRequest = false;
        response.body.supportsModulesRequest = false;

        this.sendResponse(response);
        this.sendEvent(new InitializedEvent());
    }

    protected continueRequest(response: DebugProtocol.ContinueResponse,
                                  args: DebugProtocol.ContinueArguments): void {
        this._runtime.continue();
        this.sendResponse(response);
    }
    protected nextRequest(response: DebugProtocol.NextResponse,
                              args: DebugProtocol.NextArguments): void {
        this._runtime.step();
        this.sendResponse(response);
    }
    protected evaluateRequest(response: DebugProtocol.EvaluateResponse,
                                  args: DebugProtocol.EvaluateArguments): void {
        let reply: string | undefined = undefined;

        if (args.context === 'hover') {
            reply = this._runtime.getHoverValue(args.expression);
        }   else if (args.context === 'watch') {
            reply = this._runtime.getVariableValue(args.expression);
        }

        response.body = { result: reply ? reply : "", variablesReference: 0
        };
        this.sendResponse(response);
    }
}
The CscsDebugSession is started in the debugAdapter.ts file as follows:
import { CscsDebugSession } from './cscsDebug';
CscsDebugSession.run(CscsDebugSession);
In the initializeRequest method, you can set up a few features of the debugger. Here are some of the options that I set:
response.body.supportsEvaluateForHovers = true;
response.body.supportsSetVariable       = false;
response.body.supportsRestartRequest    = false;
response.body.supportsRestartFrame      = false;
response.body.supportsModulesRequest    = false;
You can see all available options in the Capabilities section of the VS Code Debug Protocol on GitHub. (https://github.com/Microsoft/vscode/blob/master/src/vs/workbench/parts/debug/common/debugProtocol.d.ts).
The CscsDebuggerSession uses the CscsRuntime to do the actual work of connecting to the debug server and delegating to it most of the requests. Check out its implementation in the accompanying source code download. The code is very similar to what you saw when implementing the REPL evaluator extension in Listing 7.
The CscsDebuggerSession constructor subscribes to the events handled by the CscsRuntime and propagates them to the DebugSession:
this._runtime.on('stopOnStep', () => {
    this.sendEvent(new StoppedEvent('step', CscsDebugSession.THREAD_ID));
});
this._runtime.on('stopOnBreakpoint', () => {this.sendEvent(new StoppedEvent('breakpoint',
                                                           CscsDebugSession.THREAD_ID));
});
this._runtime.on('end', () => {
    this.sendEvent(new TerminatedEvent());
});
The connectToDebugger() method is similar to the method with the same name in the REPL extension you saw before in Listing 7, but there are a few differences. First, as soon as you connect to the debug server, you send the initial file that you're going to debug. That's done in this statement:
this.sendToServer("file", this._sourceFile);
You can assume that you're on the same computer as the debug server and send only the path to the file to be debugged.
Second, you send all of the breakpoints to the server.
As you can see in the accompanying source code, the CscsDebuggerSession class is basically a wrapper over the CscsRuntime class. On the other hand, the CscsRuntime class delegates most of the tasks to the debug server, communicating with it via sockets.
Adding and Removing Breakpoints
Once the user has opened a file to debug and as soon as the user clicks on the left side of the editor, the VS Code Framework calls the setBreakpointRequest() method in the CscsDebug class. This method is called in both cases: when a new breakpoint is either added or deleted. There's no indication of what triggered calling this method. Instead, the SetBreakPointsArguments parameter contains all of the breakpoints for a given file. So you just delete all of the existing breakpoints for a specified file and then add them all again, one by one. Here's the code fragment of that:
protected setBreakPointsRequest(response: DebugProtocol.SetBreakpointsResponse,
                                    args: DebugProtocol.SetBreakpointsArguments): void
{
    const path = <string>args.source.path;
    const clientLines = args.lines || [];
    this._runtime.clearBreakpoints(path);
    const actualBreakpoints = clientLines.map(l =>
    {
        let { verified, line, id } = this._runtime.setBreakPoint(path,
                                     this.convertClientLineToDebugger(l));
The registration of breakpoints will be delegated to the setBreakPoint() method in the CscsRuntime class. There, you create a map from line numbers of the source code to the breakpoints. This will be needed later on, when you need to know if a particular line contains a breakpoint or not.
Next, Step-In, Step-Out, and Continue
Next, Step-in, Step-out, and Continue are arguably the most common debug operations. When the user triggers any of the four, the corresponding functions are triggered on the CscsDebug class because it extends the DebugSession class. For example, in case of a next request, this method is executed in CscsDebug:
protected nextRequest(response:
        DebugProtocol.NextResponse, args:
        DebugProtocol.NextArguments): void {
            this._runtime.step();
            this.sendResponse(response);
}
Basically, all of the work is delegated to the CscsRuntime:
public step(event = 'stopOnStep') {
    this._continue = false;
    if (this._init) {
        this.runOnce(event);
    }   else {
        this.sendToServer('next');
    }
}
The sendToServer method is identical to the sendToServer method in the REPL client (see Listing 8). The runOnce() method is always executed on the program start (meaning that you always stop on the first line of the file to be debugged).
The runOnce() method calls the fireEventsForLine() method. The fireEventsForLine() method informs the debugSession what to do next. There are three cases:
- You have hit a breakpoint. Then you validate it, if not already validated, and inform the
debugSessionthat you should stop there:
let bp = this.getBreakPoint(ln);
if (bp) {
    this.sendEvent('stopOnBreakpoint');
    if (!bp.verified) {
        bp.verified = true;
        this.sendEvent('breakpointValidated', bp);
    }
    return true;
}
- You stop there because you're in the step event mode and the line isn't empty (the event is “stopOnStep”):
if (stepEvent && line.length > 0) {
    this.sendEvent(stepEvent);
    return true;
}
- Otherwise you continue execution. Check out the full implementation in the accompanying source code download.
Local and Global Variables
Each time a request is sent to the debug server (see Listing 8), you wait asynchronously for the reply in the processFromDebugger() method. Together with the reply, you await information about all current local and global variables. You also expect to receive the current call stack information with each reply.
Load all of the variables in the fillVars() method, which happens in this statement:
if (globLoc === '1') {
    this._globalVariables.push(item);
}   else {
    this._localVariables.push(item);
}
Periodically, the CscsDebugger asks the CscsRuntime for the global and local variables:
protected variablesRequest(response:
    DebugProtocol.VariablesResponse, args:
    DebugProtocol.VariablesArguments): void {

    let variables = args.variablesReference === this._localScope ?
        this._runtime.localVariables :
        this._runtime.globalVariables

    response.body = { variables: variables };
    this.sendResponse(response);
}
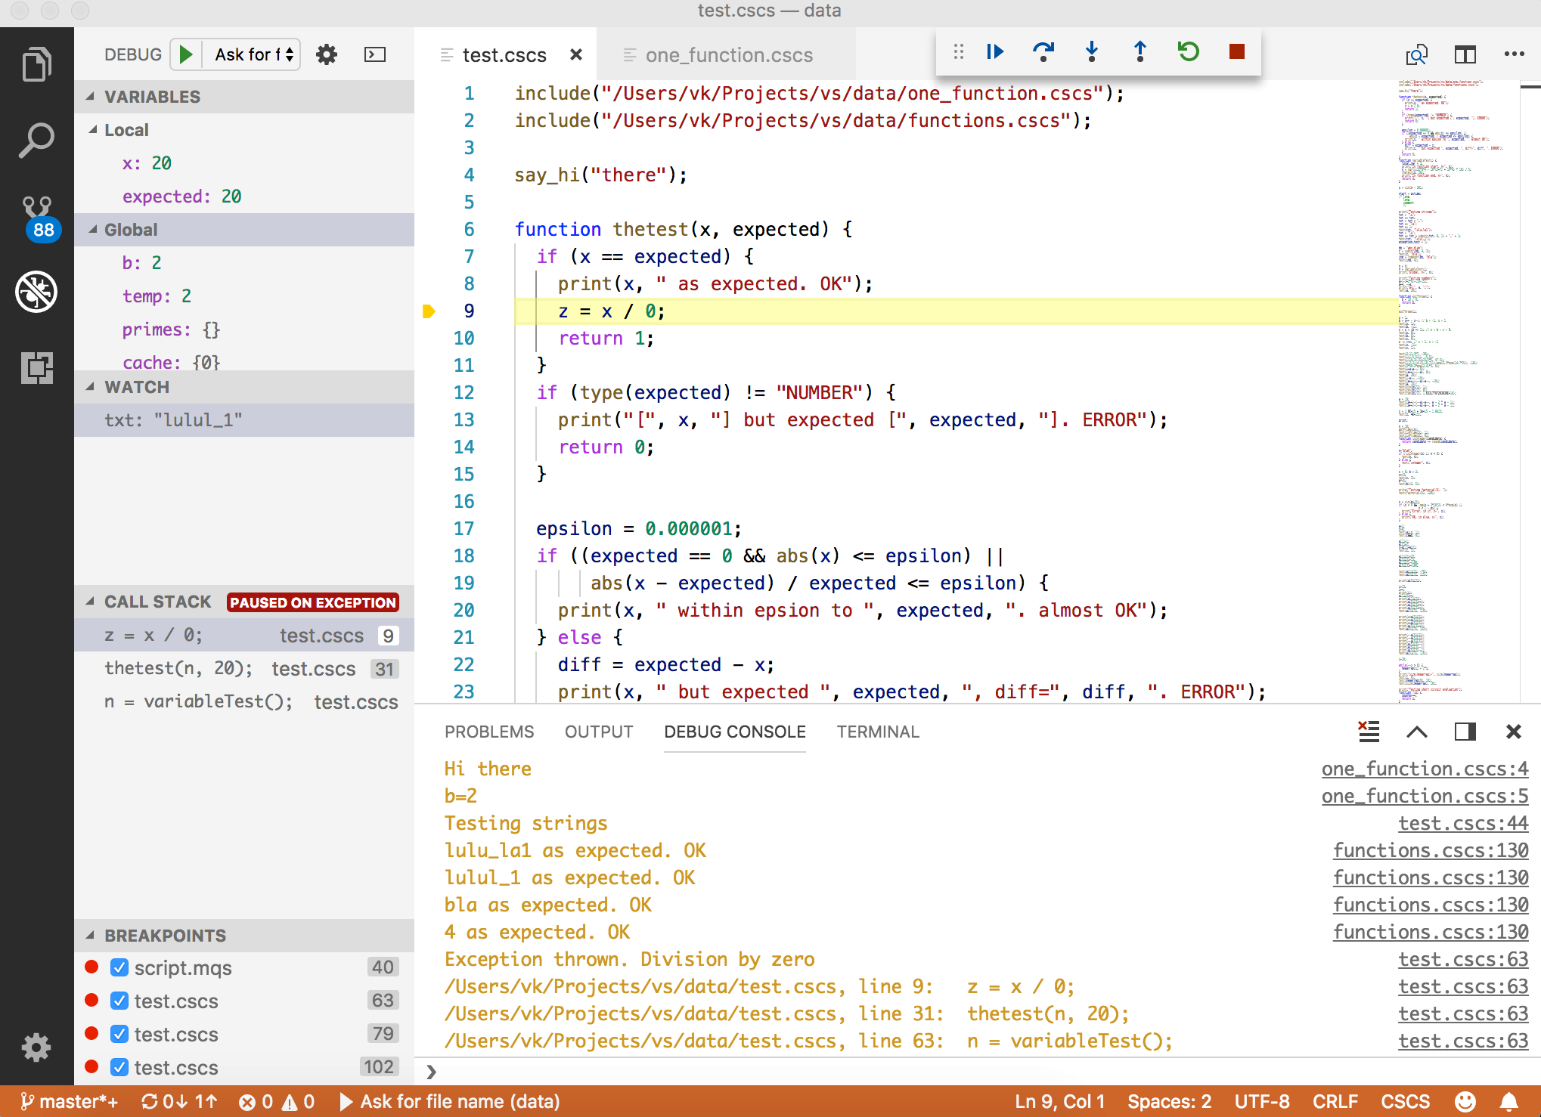
The variablesRequest() method is invoked twice: once for local, and once for global variables. Whatever you return is shown on the left editor pane of the VS Code. See Figure 4.
Watched and Hover Variables
Adding variables to watch is done entirely by the VS Code Framework. It's the same with hovering the mouse over a variable, but you still have to tell what the variable values are for both, watch and hover, when the VS Code Framework asks you.
This is done in the DebugSession evaluateRequest() method. This is a fragment of how CscsDebugger extends this method (see Listing 10 for the full code):
protected evaluateRequest(): void {
    let reply: string | undefined = undefined;
    if (args.context === 'hover') {
        reply = this._runtime.getHoverValue(args.expression);
    }   else if (args.context === 'watch') {
        reply = this._runtime.getVariableValue(args.expression);
    }
    this.sendResponse(response);
}
Basically, the evaluation of the hover and watch functionality is delegated to the CscsRuntime class. There, it looks up the variable value that it has stored before on a debug server reply:
public getVariableValue(key : string) : string {
    let val = this._variablesMap.get(key);
    if (val) {
        return val;
    }
    return "--- unknown ---";
}
For the hover requests, the code is similar:
public getHoverValue(key : string) : string {
    let hover = this._hoversMap.get(key);
    if (hover) {
        return hover;
    }
    hover = this._functionsMap.get(key);
    if (hover) {
        return hover;
    }
    return key;
}
The _variablesMap and _hoversMap variables are filled out in the fillVars() method. The _functionsMap variable is a special static map that has all of the custom language function definitions. It could be implemented and received from the server, but I decided that it's easier to hardcode it in the TypeScript client code. See the initFunctionNames() method in Listing 11 for details.
Listing 11: A Fragment of the initFunctionNames() TypeScript Method
private initFunctionNames() : void {
    let ifelse = "if(condition) { ... } elif (condition) {} else {}:
        if-elif-else control flow. Curly braces {} are mandatory!";
    this._functionsMap.set("if", ifelse);
    this._functionsMap.set("elif", ifelse);
    this._functionsMap.set("else", ifelse);
    this._functionsMap.set("while", "while(condition) { ... }:
        While control flow. Curly braces {} are mandatory!");
    this._functionsMap.set("for", "for(i : array) OR for(i=0; i<n;
        i++) { ...         }: For control flow statements. Curly braces {} are mandatory!");
    this._functionsMap.set("function", "function f(arg1, arg2, ...)
        { ... } : CSCS custom interpreted function (use cfunction for pre-compiled functions)");
    this._functionsMap.set("print", "print(arg1, arg2, ...): Prints passed arguments to console");
    this._functionsMap.set("type",  "type(arg): Returns type of the passed arg");
    this._functionsMap.set("include", "include(filename): includes CSCS code from the filename");
    this._functionsMap.set("sin", "sin(x): Returns sine of x");
}
Stack Trace Request
Together with each reply from the Debug Server, you also expect to receive the local and global variables and the current call stack information. You fill the stack in the fillStackTrace() method.
The object keeping the stack trace information is _stackTrace. It's an array of the StackEntry objects. Each StackEntry consists of the filename, line number, and name, which is the current statement:
export interface StackEntry {
    id: number;
    line: number;
    name: string;
    file: string;
}
This is the main code of the fillStackTrace() method that fills up the stack trace on the reply from the debug server:
let ln    = Number(lines[i]);
let file  = lines[i + 1].trim();
let line  = lines[i + 2].trim();
const entry = <StackEntry> {
    id: ++id, line : ln, name : line, file: file
};
this._stackTrace.push(entry);
Periodically, the CscsDebugger asks the CscsRuntime for the stack trace:
protected stackTraceRequest(): void {
    // ...
    const stk = this._runtime.stack(startFrame, endFrame);
    response.body = {
        stackFrames: stk.frames.map(f =>
            new StackFrame(f.index, f.name,
        this.createSource(f.file),
        this.convertDebuggerLineToClient(f.line))),
    totalFrames: stk.count
    };
    this.sendResponse(response);
}
Handling Exceptions
In case an exception is thrown by the client code, the debug server informs you about it with the special exc response. Upon receiving it, the CscsRuntime informs the CscsDebug session about it by sending the following event:
this.sendEvent('stopOnException');
Then the CscsDebug session propagates this event to the framework:
this._runtime.on('stopOnException', () => {
    this.sendEvent(new StoppedEvent('exception', CscsDebugSession.THREAD_ID));
});
This allows showing the Exception information and the stack trace on the VS Code left pane (see Figure 4).
On an exception, the full stack trace is received together with the exception from the debug server. You only have to call the fillStackTrace() method and the rest is done by the framework (see the previous section for details).
Implementation of the Debug Server
You can use the same debug server that you implemented for the REPL evaluator extension. You just need to extend it to handle more cases. The function that needs to be extended is ProcessClientCommand(). In case of the REPL evaluator, it was processing only the repl command. Listing 12 shows the implementation of the extended ProcessClientCommand().
Listing 12: A Fragment of the ProcessClientCommand() C# Method
void ProcessClientCommand(string data)
{
    string [] parts = data.Split(new char [] { '|' });
    string cmd = parts[0].ToLower();
    string result = "N/A";
    SteppingIn = SteppingOut = false;
    SendBackResult = true;

    if (cmd == "file") {
        m_filename = data.Substring(cmd.Length + 1);
        string rawScript = Utils.GetFileContents(m_filename);
        m_script = Utils.ConvertToScript(rawScript, out m_char2Line);
        m_debugging = new ParsingScript (m_script, 0, m_char2Line);
    }   else if (cmd == "setbp") {
        Breakpoints.Instance.AddBreakpoints(this, data);
        return;

    }   else if (cmd == "repl") {
        result = ProcessRepl(data.Substring(cmd.Length + 1));
        SendBack(result);
        return;
    }   else if (cmd == "continue") {
        Continue = true;
        cmd = "next";
    }   else if (cmd == "stepin") {
        SteppingIn = true;
        cmd = "next";
    }

    if (cmd == "next") {
        Variable res = ProcessNext();
        int origLineNumber = GetCurrentLineNumber();
        string filename = GetCurrentFilename ();
         result = CreateResult(filename, origLineNumber, Output, processedStr);
    }

    result = cmd + "\n" + result;
    SendBack(result);
}
Note that there are no specific commands to get a request for local/global variables and for the execution stack. The reason is that the server sends back the variables and the stack info with each request. Listing 13 shows the implementation of the CreateResult() method, which adds all of this information to the response to be sent to the client.
Listing 13: CreateResult() C# Method
string CreateResult(string filename, int lineNumber,
string output, string processed = "")
{
    int outputCount = output.Split('\n').Length;
    string result = filename + "\n";
    result += lineNumber + "\n";
    result += outputCount + "\n";
    result += output + "\n";

    string vars = GetVariables();
    int varsCount = vars.Split('\n').Length;
    result += varsCount + "\n";
    result += vars + "\n";
    string stack = GetStack();
    result += stack + "\n";

    return result;
The Debug Server implementation is specific for the CSCS language. Take a look at the implementation on GitHub and in the accompanying source code download and adjust it according to your language.
Wrapping Up
Arguably, Visual Studio Code came as an Eclipse IDE replacement and it's not by chance that Erich Gamma was involved with Eclipse development earlier. As a matter of fact, more and more developers are switching from Eclipse to VS Code. I find it easier to extend VS Code than Eclipse, and I also have a feeling that VS Code is a much more light-weight tool than Eclipse.
VS Code makes it possible to extend its functionality and support new languages. In this article, you saw how to extend the VS Code functionality in two ways: how to add an extension and how to add a new language support, including one of the major tasks of language support –debugging.
I hope you enjoyed the possibility of dynamic creation of the mobile apps using the REPL extension.
All of the code for all of the projects that you saw in this article is open source. See the accompanying source code download and GitHub links in the sidebar for the most up-to date developments.
I would like to give special thanks to Stefan Landvogt from Microsoft for providing me with priceless tips and suggestions.