Tom’s having a lot of fun playing with SQL Server 2005’s T-SQL enhancements.
In this article he combines a bunch of them in concert to solve an interesting problem.
A while ago I responded to a post in the public newsgroups. Basically, the poster had a table of inventory changes-with start and end dates, as well as the amount that was added. I gave him a solution but I got to thinking about how I would do this with SQL Server 2005.
If you knew the times that an aircraft entered and left an air traffic controller’s airspace, you could calculate-for any given time-how many aircraft that the controller was working.
I’ll present a generic solution here that you can apply against a broad range of problem domains. For example, if you knew the times that an aircraft entered and left an air traffic controller’s airspace, you could calculate-for any given time-how many aircraft that the controller was working. Similarly, if you knew when a party entered and left a restaurant, as well as the number of people in the party, you could then determine how many people were in the restaurant at any given time. Figure 1 shows how this would look, if represented as a Gantt-like chart.
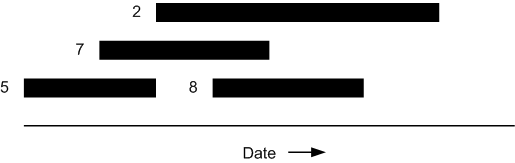
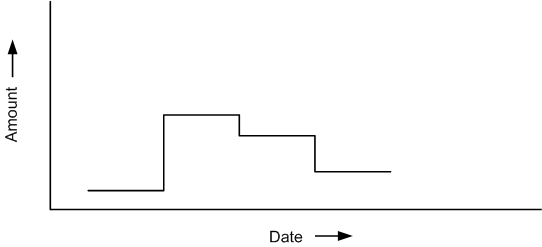
Each stripe on the chart corresponds to an entry in the table of values. Unfortunately, it doesn’t do a good job of showing you how much of whatever you’re monitoring is present at any given time. You want something along the lines of Figure 2 where you can see the rises and falls as increments are added and removed from the tally. This reminds me of my favorite subject in university-calculus. While you’re not using calculus here, the principle is the same. You’re integrating stuff. You start with something and add the increments between the start and the end and wind up with the new amount. It’s kind of like basic accounting.
Let me put together a table of raw data and work from there. Check out the code in Listing 1.
Note that the Start column is not null but the Finish column allows nulls. This is because at any given time, an amount may be on the books but it hasn’t yet been removed. Alternatively, you could put an end date of 9999-12-31 23:59:59, if you have an allergy to nulls.
In this example, no two entries would both start and finish on the same dates. Rather, the Amount would adjust to account for the combined total. The UNIQUE constraint on (Start, Finish) enforces this. Also, I added a CHECK constraint to ensure that the Finish date is on or after the Start date. Yes, you can have something that starts and finishes on the same day. Another CHECK constraint ensures that the Amount is positive.
As a first step, you need to unpivot the start and end dates. (I’ll show you how to use SQL Server 2005’s cool new UNPIVOT operator to do this, though you can do this using other techniques.) This has the effect of producing one row for the beginning of the entry and another for the end of the same entry. The Start event adds the amount, while the Finish event removes it. Therefore, the Start event should have a positive amount, while the Finish Event should have a negative amount. Indeed, they are mirror images of each other.
You have to account for the fact that the Start and Finish dates are the dates where the Amount was on the books, inclusive. That means that it goes off the books the following day. Therefore, you must add one day to the Finish date if you want things to work out correctly.
It’s not beyond the realm of possibility that several entries in the table could either start or stop on the same date. Consequently, after you unpivot, you have to take daily totals for each event. In this example, you have two entries that begin on 2006-01-01. This means that the unpivoted data will be summed, but grouped by event date.
The job’s still not done. What you have right now are the daily total increments. Assume that you had nothing on the books at the beginning of the exercise. Thus, all you have left to do is take a running total. That then gives you the total amount on record for any date on which the amount changes.
It’s easier to show you the code than to describe everything, so check out Listing 2.
Listing 2 is actually a view, since you’re going to be re-using it several times in what’s to come. It uses a CTE (Common Table Expression). In fact, it uses two of them, one of which depends on the other. CTE x simply adds 1 day to the Finish date, in preparation for the UNPIVOT, which you do in CTE y.
CTE y requires careful study. You’re unpivoting the Start and Finish columns. Their contents will go into a new column, named EventDate. The column names-Start and Finish-now disappear but are kept in another new column, Event. The other columns in CTE x are preserved through the UNPIVOT. After the UNPIVOT, you need to sum the Amounts, grouping on EventDate. As mentioned earlier, a Start event represents an addition, while a Finish event is a subtraction. This means that you need to use a CASE construct inside your sum.
Now that you have CTE y, you take the running total. Be careful here. It involves a self-join. You group on y1.EventDate, but you take the sum of y2.Amount.
At this point you can find out the totals for a range of dates by doing a simple SELECT, as shown in Listing 3. You’ll see that you get one row for every day where there was a change within the given range of dates.
It’s fairly easy to find the high-water mark-the highest amount on record-between any two dates, together with the date on which you recorded it (Listing 4).
Notice in Listing 4 that you used ORDER BY Amount DESC since you want the highest Amount. You did the SELECT TOP WITH TIES since it’s possible that you hit the same high-water level more than once. If you wanted the row for the date when the high water mark was initially set, then leave out the WITH TIES. If you want the most-recent high-water event, then change the ORDER BY to:
order by
  Amount    desc
, EventDate desc
Let’s up the ante a bit. Suppose you want to know the net change between any two dates. You’ll have to find the total for each date and then take the difference between the two. Listing 5 shows a solution that does not use variables since you can use set-level SQL to pull this off.
I call this a “bookend query”. Note the symmetry of the solution. Only the ORDER BY’s in the SELECT TOP 1’s differ. Also, you’re using the MAX(EventDate) in the BETWEEN predicates, so that you get the latest EventDate on or before the start date of the query-in this example that is 2006-01-08. Failing to do this would mean that you’d miss the total for your start date-if there was no Start or Finish event on 2006-01-08, in this example.
The ROW_NUMBER() function is a new, long-awaited feature in SQL Server 2005.
I then reflected on this type of query in light of the new T-SQL enhancements of SQL Server 2005. Listing 5 is really two queries that have been nicely put together into one result set. Each one had to go to the Totals view twice-once for each amount. I wondered if you could get the start and finish amounts without having to tap the view twice.
I thought about the new ROW_NUMBER() function (a new, long-awaited feature in SQL Server 2005). This gives you a running number based on a given sort order. Armed with this, you want the first and the last. The first is easy-it’s 1. The last requires some work since it’s equal to the number of rows involved.
Then it dawned on me. There’s nothing to stop you from using the ROW_NUMBER() function twice in the same SELECT. You can also give each one of them different sort criteria. What if you were to give them the same sort order, except one was ascending, while the other was descending? That would mean that you’d have ROW_NUMBER() = 1 for the first row when ascending, and ROW_NUMBER() = 1 for the last row when descending.
Check out Listing 6 for the solution.
You need the derived table-x-since you can’t use ROW_NUMBER() in the WHERE clause. I used the MIN() functions in concert with the CASE expressions to extract the correct Amounts. MAX() or SUM() would accomplish the same thing, since there is only one row where RowNumber1 = 1 or RowNumber2 = 1. I was very pleased to see that the relative query cost for this approach is 34% vs. 66 % for Listing 5-a 2:1 improvement.
If you examine Listing 6 closely, you’ll see that the MIN(CASE…) is essentially an unpivot without explicitly using UNPIVOT. I tried the explicit UNPIVOT, but the relative query cost was slightly worse than Listing 6. Also, because of certain restrictions with the UNPIVOT feature, I had to use an extra derived table, making the code a little difficult to read.
Here’s one more challenge for you: Try to find the days where the largest increment/decrement occurred. Since you’re interested in the changes and not the totals, you don’t need to use the Totals view. Your first impulse might be to go directly to the Deltas table. However, keep in mind that several increments can occur either starting on the same day or ending on the same day. For this job, you’ll need to use your own CTEs. Go ahead, and while you do that, I’ll head to the kitchen and top up my coffee.
Okay, I’m back. Let’s see how you did. Compare your code to what I did in Listing 7.
The CTEs begin life in the same manner as when you built the Totals view. Indeed, CTEs x and y are identical. You next take CTE y and do the same sort of bookend query that I talked about in Listing 6. (Thought that you were finished with that one, huh?) You’ll use ROW_NUMBER() = 1 to define the bookends for both sort orders and-voilá!-you’re there.
Before I go, I’ll leave you with some homework. Find the period(s) of time when there was nothing on the books. Hint: The total goes to 0 on a Finish Event and then goes to non-zero on the following Start event.
Listing 1: Build script for the dbo.Deltas table
create table dbo.Deltas
(
  ID     int      primary key
, Start  datetime not null
, Finish datetime null
, Amount int      not null
                  check (Amount > 0)
, unique (Start, Finish)
, check (Finish >= Start)
)
go
insert dbo.Deltas values (1, '20060101', '20060108', 5)
insert dbo.Deltas values (2, '20060101', '20060106', 2)
insert dbo.Deltas values (3, '20060104', '20060110', 3)
insert dbo.Deltas values (4, '20060112', null, 4)
insert dbo.Deltas values (5, '20060112', '20060114', 1)
insert dbo.Deltas values (6, '20060109', '20060110', 7)
Listing 2: Build script for the dbo.Totals view
create view dbo.Totals
as
with x
as
(
 select
   ID
 , Start
 , Finish + 1 as Finish
 , Amount
 from
      dbo.Deltas
)
, y
as
(
 select
   EventDate
 , sum (case Event
   when 'Start'  then  Amount
   when 'Finish' then -Amount
  end) Amount
 from
      x
 unpivot
 (
   EventDate for Event in (Start, Finish)
 ) as unpvt
 group by
   EventDate
)
select
  y1.EventDate
,         sum (y2.Amount) Amount
from
 y y1
join
 y y2 on y2.EventDate <= y1.EventDate
group by
 y1.EventDate
Listing 3: Finding totals for a date range
select
  *
from
     dbo.Totals
where
     EventDate between '20060104' and '20060107'
order by
     EventDate
Listing 4: Finding the high water mark for a given date range
select top 1 with ties
  *
from
     dbo.Totals
where
     EventDate between '20060104' and '20060110'
order by
  Amount desc
Listing 5: Finding the net change in totals between two dates
select
  (select top 1 Amount
   from dbo.Totals
   where EventDate between
    (select max (EventDate)
     from dbo.Totals
     where EventDate < ='20060108') and '20060113'
     order by EventDate desc) -
  (select top 1 Amount
   from dbo.Totals
   where EventDate between
    (select max (EventDate)
     from dbo.Totals
     where EventDate < ='20060108') and '20060113'
     order by EventDate)
Listing 6: Finding the net change in totals between two dates, using the ROW_NUMBER() function
select
 sum (case RowNumberType
   when 'RowNumber2' then  Amount
   when 'RowNumber1' then -Amount
  end)
from
(
 select
  *
 from
 (
  select
   *
  from
  (
   select
    Amount
   , row_number() over (order by EventDate)
       as RowNumber1
   , row_number() over (order by EventDate desc)
       as RowNumber2
   from
        dbo.Totals
   where
        EventDate between
        (select max (EventDate)
         from dbo.Totals
         where EventDate < ='20060108') and '20060113'
  ) x
  where
   1 in (RowNumber1, RowNumber2)
 ) y
 unpivot
 (
  RowNumber for RowNumberType in
                            (RowNumber1, RowNumber2)
 ) unpvt
) z
where
 RowNumber = 1
Listing 7: Finding the events with highest and lowest daily increments
with x
as
(
 select
   ID
 , Start
 , Finish + 1 as Finish
 , Amount
 from
  dbo.Deltas
)
, y
as
(
 select
   EventDate
 , sum (case Event
          when 'Start' then Amount
          when 'Finish' then -Amount
        end) Amount
 from
  x
 unpivot
 (
  EventDate for Event in (Start, Finish)
 ) as unpvt
 group by
  EventDate
)
, z
as
(
select
  y.*
, row_number () over (order by Amount)      RowNumber1
, row_number () over (order by Amount desc) RowNumber2
from
 y
)
select
  z.EventDate
, z.Amount
from
 z
where
 1 in (RowNumber1, RowNumber2)
| EventDate | Amount |
|---|---|
| 2006-01-04 00:00:00.000 | 10 |
| 2006-01-07 00:00:00.000 | 8 |