Creating custom column types for the DataGridView control isn’t nearly as tricky as it once was.
In this article, you’ll learn how to take advantage of inheritance to create your own bar graph column in a grid cell.
I tend to get random e-mail requests for programming help. I do the best I can to solve all the issues that come up, but generally refer random questions to the public newsgroups. If the question is really interesting, however, I can’t help myself from digging in. Recently, I got an e-mail from a friend that went something like this:
We display a table of values in a Web page. In one of the columns, we display a simple little bar graph corresponding to a value from a table. We create the bar by displaying a solid bitmap, setting the width to be the value from the field. Then we display the value of the field next to the bar. We’ve found this to be a totally effective way to include graphical information in a simple table. How do you do this in a DataGridView control?
Although it wasn’t my first thought, it quickly became clear after a little research that the answer was to create a new type of column for the DataGridView control. Remembering back to the painful experiences I had suffering a similar torture working with the GridView control in Visual Studio 2003, I started with some trepidation. It turns out that tasks once difficult have become simple, as is often the case in .NET-land. I quickly ripped out a version for my friend, and later solidified it for inclusion here.
To get you started creating your own column types for the DataGridView control, this article walks you through creating the bar graph cell type. Once you’ve worked through this example, you should be ready to graduate to more complex column types.
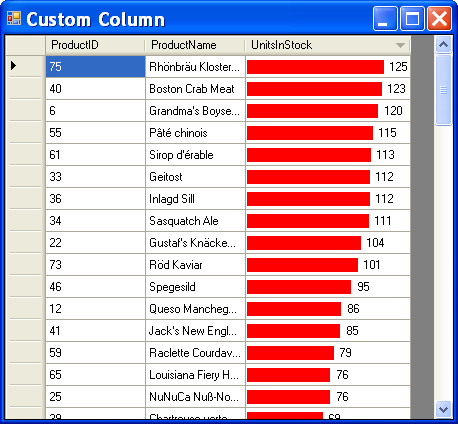
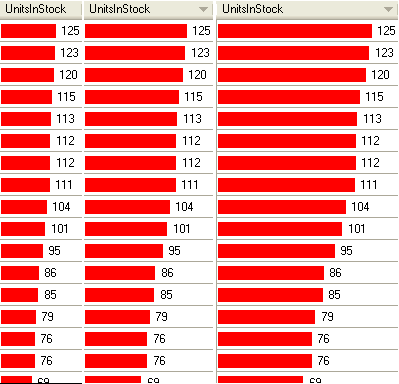
The finished result of your exercise should look something like the form shown in Figure 1. This form pulls its data from the SQL Server 2000 Northwind sample database, although you could easily choose a different table for your own demonstration-just make sure your data source includes an integer column. In addition, the column scales the data to fit within the cell bounds, given the maximum value for the column. As you expand the column, the bar expands to fill the available space. Figure 2 shows three views of the same column, at different widths, demonstrating the behavior of the sample column.
The concept behind creating your own custom DataGridView column type is simple. You start by creating a class that inherits from the DataGridViewCell class (or some class that itself inherits from the DataGridViewCell class). In your class, you can override any of the many protected members of the base class. If you want to change the way the cell draws its contents, you’ll need to override the class’ Paint method, as in this article’s example.
Once you’ve created the cell, you create a class that inherits from the DataGridViewColumn class. Although you can override many of the members of this class, you generally won’t need to. All you must do is set the CellTemplate property of your class from within its constructor. Finally, you set up your DataGridView so that it uses the new column type for the column in question, and you’re done! (I keep thinking back to the hundreds of lines of code that were required to create a column that displayed a ComboBox control in a GridView in the old days. Obviously, it pays to be patient.)
Getting Started Creating the Example
To walk through creating your own GridView column as shown in Figure 1, start by creating a new Windows Application project in Visual Studio 2005. Next, create a new data source: Select Data, and then Add New Data Source; create a data source that retrieves at least a few columns, one of which is an integer column. (The example shown here uses the ProductID, ProductName, and UnitsInStock fields from the Northwind Products table.) Make sure the Data Sources window is visible (select Data and then Show Data Sources if it’s not), open the project’s single form in the form designer, and drag the entire table over to the form. Visual Studio creates a DataGridView control on the form for you (along with the standard Windows Forms data binding plumbing, including DataSet, BindingSource, and TableAdapter instances). From the DataGridView control’s smart tag, select Dock in Parent Container. Finally, save the project and run the form to verify that you see the raw data in your DataGridView control.
Now that you’ve got the basics worked out, I’ll assume you’re using the same fields as shown in Figure 1 for the remainder of the demo. To get started with the real work, add a new class to your project named DataGridViewBarGraphColumn, and have your class inherit from the DataGridViewColumn class. Modify the class so that it looks like the following, adding stubs so that you can continue creating the custom cell type. You’ll come back and complete this class later.
[Visual Basic]
Public Class DataGridViewBarGraphColumn
  Inherits DataGridViewColumn

  Public MaxValue As Long
  Private needsRecalc As Boolean = True

  Public Sub CalcMaxValue()
  End Sub
End Class

[C#]
  public class DataGridViewBarGraphColumn :
    DataGridViewColumn
  {
    public DataGridViewBarGraphColumn()
    {
    }

    public long MaxValue;
    private bool needsRecalc = true;

    public void CalcMaxValue()
    {
    }
  }
Next, add a new class to your project named DataGridViewBarGraphCell. In this case, because you want to emulate the behavior of the standard text box cell, you’ll need your class to inherit from the DataGridViewTextBoxCell class. (This class takes care of things like drawing the cell’s background and content, which you’ll find useful.) In C#, you’ll need to add the using statements to the top of the file, as shown in the code snippet below:
[Visual Basic]
Public Class DataGridViewBarGraphCell
  Inherits DataGridViewTextBoxCell

End Class

[C#]
// Add these to your file:
using System.Drawing;
using System.Windows.Forms;

// Your class should look like this:
public class DataGridViewBarGraphCell :
  DataGridViewTextBoxCell
{
}
The Paint method is the only method of the base class that you’ll need to override, so inside the class type just enough of the method declaration to let Visual Studio know your intentions, and then let the tools fill in the details. You need to type only the following code, before pressing TAB:
[Visual Basic]
Overrides Paint

[C#]
public override Paint
At that point, Visual Studio completes the declaration, rearranged here to fit the available space (I’ve also removed extraneous namespace references, to make the code easier to read):
[Visual Basic]
Protected Overrides Sub Paint( _
 ByVal graphics As Graphics, _
 ByVal clipBounds As Rectangle, _
 ByVal cellBounds As Rectangle, _
 ByVal rowIndex As Integer, _
 ByVal cellState As DataGridViewElementStates, _
 ByVal value As Object, _
 ByVal formattedValue As Object, _
 ByVal errorText As String, _
 ByVal cellStyle As DataGridViewCellStyle, _
 ByVal advancedBorderStyle As _
  DataGridViewAdvancedBorderStyle, _
 ByVal paintParts As DataGridViewPaintParts)

  MyBase.Paint(graphics, clipBounds, cellBounds, _
   rowIndex, cellState, value, _
   formattedValue, errorText, cellStyle, _
   advancedBorderStyle, paintParts)
End Sub

[C#]
protected override void Paint(
  Graphics graphics,
  Rectangle clipBounds,
  Rectangle cellBounds,
  int rowIndex,
  DataGridViewElementStates cellState,
  object value, object formattedValue,
  string errorText,
  DataGridViewCellStyle cellStyle,
  DataGridViewAdvancedBorderStyle
  advancedBorderStyle,
  DataGridViewPaintParts paintParts)
{
  base.Paint(graphics, clipBounds,
    cellBounds, rowIndex, cellState,
    value, formattedValue, errorText,
    cellStyle, advancedBorderStyle,
    paintParts);
}
As you can see, the DataGridView control passes a large amount of information to the DataGridViewTextBoxCell class (and your class, by inheritance) as it paints each cell in the grid. Table 1 describes each of the parameters your Paint method override receives. For this example, you won’t need to use many of these, but it’s nice to know exactly what tools you have to work with, if you want to create more complex cell types.
This example is relatively simple-all you need to do is draw the bar and the formatted value, side by side. Of the parameters listed in Table 1, you’ll only need the cellBounds, cellState, value, and formattedValue items for this example.
To get started, within the Paint method override that you’ve already created, modify the call to the base class’ Paint method, removing the formattedValue from the list of parameters. Because you’re going to draw the value yourself, you don’t want the cell to do it itself:
[Visual Basic]
MyBase.Paint(graphics, clipBounds, cellBounds, _
 rowIndex, cellState, _
 value, "", errorText, cellStyle, _
 advancedBorderStyle, paintParts)

[C#]
base.Paint(graphics, clipBounds,
  cellBounds, rowIndex, cellState,
  value, "", errorText,
  cellStyle, advancedBorderStyle,
  paintParts);
Continue by adding code that retrieves the cell’s value. If the value is DBNull, treat it as 0. Then, if the value is 0, change it so that it’s 1 (that way, even if the value is 0, you’ll see a single-pixel-wide vertical bar). If you don’t care for this behavior, you can leave out the simple conversion:
[Visual Basic]
' Get the value of the cell:
Dim cellValue As Decimal
If IsDBNull(value) Then
  cellValue = 0
Else
  cellValue = CDec(value)
End If

' If cell value is 0, you still
' want to show something, so set the value
' to 1.
If cellValue = 0 Then
  cellValue = 1
End If

[C#]
//  Get the value of the cell:
decimal cellValue = 0;
if (Convert.IsDBNull(value))
{
  cellValue = 0;
}
else
{
  cellValue = Convert.ToDecimal(value);
}

//  If cell value is 0, you still
//  want to show something, so set the value
//  to 1.
if (cellValue == 0)
{
  cellValue = 1;
}
Add two constants that control the offset from the left, and the width between the bar and the text. You can modify these values, if you like:
[Visual Basic]
Const HORIZONTALOFFSET As Integer = 1
Const SPACER As Integer = 4
[C#]
const int HORIZONTALOFFSET = 1;
const int SPACER = 4;
Dealing with Geometry
Clearly, solving this programming problem introduces some mundane geometry issues, such as the width of the bar, compared to the width of the largest bar. In addition, how much room is available for the largest bar, leaving room for the text associated with that bar?
To solve these issues, you’ll need to be able to retrieve the maximum value for all the values in the column, and the parent column should handle this chore for you. You can use the cell’s OwningColumn property to retrieve a reference to the parent column. Add the following block of code (of course, the parent’s CalcMaxValue and MaxValue members don’t do much yet):
[Visual Basic]
' Get the parent column and the maximum value:
Dim parent As DataGridViewBarGraphColumn = _
 CType(Me.OwningColumn,
DataGridViewBarGraphColumn)
parent.CalcMaxValue()
Dim maxValue As Long = parent.MaxValue

[C#]
//  Get the parent column and the maximum value:
DataGridViewBarGraphColumn parent =
  (DataGridViewBarGraphColumn)this.OwningColumn;
parent.CalcMaxValue();
long maxValue = parent.MaxValue;
You can also now retrieve the font for the column, using the column’s InheritedStyle property:
[Visual Basic]
Dim fnt As Font = _
 parent.InheritedStyle.Font

[C#]
Font fnt = parent.InheritedStyle.Font;
(The DataGridView control’s support for inheriting styles in cells and columns is quite rich. For more information, look for the MSDN help topic titled, “Cell Styles in the Windows Forms DataGridView Control.”)
In order to calculate the amount of space you have to work with in each cell, you’ll need to know the width of the text for the maximum value. Given that width, you can calculate the maximum size for the bar in each cell. The Graphics.MeasureString method provides the value you need, so add the following code to calculate these values:
[Visual Basic]
Dim maxValueSize As SizeF = _
 graphics.MeasureString(maxValue.ToString, fnt)
Dim availableWidth As Single = _
 cellBounds.Width - maxValueSize.Width - _
 SPACER - (HORIZONTALOFFSET * 2)

[C#]
SizeF maxValueSize =
 graphics.MeasureString(maxValue.ToString(), fnt);
float availableWidth =
  cellBounds.Width - maxValueSize.Width -
  SPACER - (HORIZONTALOFFSET * 2);
Given the available width for the bars, you can calculate the width of the current cell’s bar, using the ratio of the current value to the maximum value, scaled to fit within the available space. Add the following code to work this out:
[Visual Basic]
cellValue = _
 CDec((cellValue / maxValue) * availableWidth)

[C#]
cellValue = Convert.ToDecimal(
 (Convert.ToDouble(cellValue) / maxValue) *
 availableWidth);
It’s time to start drawing content. Add the following code which calculates the size of the bar, and then draws it using a red brush:
[Visual Basic]
' Draw the bar, truncating to fit in the space
' you've got in the cell:
Const VERTOFFSET As Integer = 4
Dim newRect As New RectangleF( _
 cellBounds.X + HORIZONTALOFFSET, _
 cellBounds.Y + VERTOFFSET, _
 cellValue, _
 cellBounds.Height - (VERTOFFSET * 2))
graphics.FillRectangle(Brushes.Red, newRect)

[C#]
const int VERTOFFSET = 4;
RectangleF newRect = new RectangleF(
  cellBounds.X + HORIZONTALOFFSET,
  cellBounds.Y + VERTOFFSET,
  Convert.ToSingle(cellValue),
  cellBounds.Height - (VERTOFFSET * 2));
graphics.FillRectangle(Brushes.Red, newRect);
Next, add code that draws the text:
[Visual Basic]
' Get the text to draw and calculate its width:
Dim cellText As String = formattedValue.ToString()
Dim textSize As SizeF = _
 graphics.MeasureString(cellText, fnt)

' Calculate where text would start:
Dim textStart As PointF = _
 New PointF( _
 HORIZONTALOFFSET + cellValue + SPACER, _
 (cellBounds.Height - textSize.Height) / 2)

' Calculate the correct color:
Dim textColor As Color = _
 parent.InheritedStyle.ForeColor
If (cellState And _
 DataGridViewElementStates.Selected) = _
 DataGridViewElementStates.Selected Then
  textColor = parent.InheritedStyle.
    SelectionForeColor
End If

' Draw the text:
Using brush As New SolidBrush(textColor)
  graphics.DrawString(cellText, fnt, brush, _
   cellBounds.X + textStart.X, _
   cellBounds.Y + textStart.Y)
End Using

[C#]
string cellText = formattedValue.ToString();
SizeF textSize =
 graphics.MeasureString(cellText, fnt);

//  Calculate where text would start:
PointF textStart = new PointF(
  Convert.ToSingle(HORIZONTALOFFSET +
   cellValue + SPACER),
  (cellBounds.Height - textSize.Height) / 2);

//  Calculate the correct color:
Color textColor = parent.InheritedStyle.ForeColor;
if ((cellState &
  DataGridViewElementStates.Selected) ==
  DataGridViewElementStates.Selected)
{
  textColor = parent.InheritedStyle.
   SelectionForeColor;
}

// Draw the text:
using (SolidBrush brush =
 new SolidBrush(textColor))
{
  graphics.DrawString(cellText, fnt, brush,
    cellBounds.X + textStart.X,
    cellBounds.Y + textStart.Y);
}
This code starts by calculating where the text should start, and then creates a new Font object. Next, the code calculates the width of the text in the new font:
[Visual Basic]
Dim cellText As String = formattedValue.ToString()
Dim textSize As SizeF = _
 graphics.MeasureString(cellText, fnt)

[C#]
string cellText = formattedValue.ToString();
SizeF textSize =
 graphics.MeasureString(cellText, fnt);
Next, the code calculates where the text should start within the cell, given the width of the bar, the various offsets, along with the height of the cell and the text:
[Visual Basic]
Dim textStart As PointF = _
 New PointF( _
 HORIZONTALOFFSET + cellValue + SPACER, _
 (cellBounds.Height - textSize.Height) / 2)

[C#]
PointF textStart = new PointF(
  Convert.ToSingle(HORIZONTALOFFSET +
   cellValue + SPACER),
  (cellBounds.Height - textSize.Height) / 2);
Of course, a selected cell displays text differently than a standard cell, so the code must determine if the cell has been selected and then set up the appropriate text color. This code uses the cellState parameter to do its work:
[Visual Basic]
Dim textColor As Color = _
 parent.InheritedStyle.ForeColor
If (cellState And _
 DataGridViewElementStates.Selected) = _
 DataGridViewElementStates.Selected Then
  textColor = parent.InheritedStyle.SelectionForeColor
End If

[C#]
Color textColor = parent.InheritedStyle.ForeColor;
if ((cellState &
  DataGridViewElementStates.Selected) ==
  DataGridViewElementStates.Selected)
{
  textColor = parent.InheritedStyle.
   SelectionForeColor;
}
(Note that the cellState parameter can contain multiple values, combined together-you must use the And operator, as shown here, to determine if any single value is set within the parameter.)
Finally, the code draws the text at the correct location within the cell:
[Visual Basic]
Using brush As New SolidBrush(textColor)
  graphics.DrawString(cellText, fnt, brush, _
   cellBounds.X + textStart.X, _
    cellBounds.Y + textStart.Y)
End Using

[C#]
using (SolidBrush brush = new SolidBrush(textColor))
{
  graphics.DrawString(cellText, fnt, brush,
    cellBounds.X + textStart.X,
    cellBounds.Y + textStart.Y);
}
That takes care of the cell part of the story. Next, you must finish creating the column. Back in the DataGridViewBarGraphColumn class, add a default constructor, and modify the code so that it sets the column’s CellTemplate property, and forces the column to be read only:
[Visual Basic]
Public Class DataGridViewBarGraphColumn
  Inherits DataGridViewColumn

  Public Sub New()
    Me.CellTemplate = _
     New DataGridViewBarGraphCell()
    Me.ReadOnly = True
  End Sub

  Public MaxValue As Long
  Private needsRecalc As Boolean = True

  Public Sub CalcMaxValue()
  End Sub
End Class

[C#]
public class DataGridViewBarGraphColumn :
  DataGridViewColumn
{
  public DataGridViewBarGraphColumn()
  {
    this.CellTemplate =
      new DataGridViewBarGraphCell();
    this.ReadOnly = true;
  }

  public long MaxValue;
  private bool needsRecalc = true;

  public void CalcMaxValue()
  {
  }
}
Finally, you’ll need to provide a way for the column to calculate its maximum value. Because the column really doesn’t provide any simple means to hook itself into the parent control’s set of events, the simple solution is to have a procedure (CalcMaxValue) that each cell calls as it’s being painted. Of course, you don’t really need to calculate the maximum value for each cell; it’s just that there’s no other obvious and simple self-contained location in which to place code that you’re guaranteed won’t run until all the data has been loaded. (There may be other solutions to this particular problem, but the technique shown here is relatively benign, and works fine.)
Modify the CalcMaxValue procedure so that it scans the values in the current column, tracking the maximum value. When the procedure is done, it sets the NeedsRecalc field to false, so that subsequent calls to the procedure don’t calculate the maximum value again:
[Visual Basic]
Public Sub CalcMaxValue()
  If needsRecalc Then
    Dim colIndex As Integer = Me.DisplayIndex
    For rowIndex As Integer = 0 To _
     Me.DataGridView.Rows.Count - 1

      Dim row As DataGridViewRow = _
       Me.DataGridView.Rows(rowIndex)
      MaxValue = Math.Max(MaxValue, _
       CLng(row.Cells(colIndex).Value))
    Next
    needsRecalc = False
  End If
End Sub

[C#]
public void CalcMaxValue()
{
  if (needsRecalc)
  {
    int colIndex = this.DisplayIndex;
    for (int rowIndex = 0;
      rowIndex < this.DataGridView.Rows.Count;
      rowIndex++)
    {
      DataGridViewRow row =
        this.DataGridView.Rows[rowIndex];
      MaxValue = Math.Max(MaxValue,
        Convert.ToInt64(row.Cells[colIndex].Value));
    }
    needsRecalc = false;
  }
}
(You could make the needsRecalc field public, so that other callers could reset it. If, for example, you wanted to allow users to change values in the column, you would need to force a recalc of the maximum value. It’s possible that you could trap cell-changing events of the parent grid, and force a recalculation if a value in the corresponding column changed. I’ll leave that as an exercise for the reader!)
That’s it-that’s all you need. You’ve indicated that the template for cells in this column should use the DataGridViewBarGraphCell class, and that this column should be read only; you’ve added code that calculates the maximum value of the column.
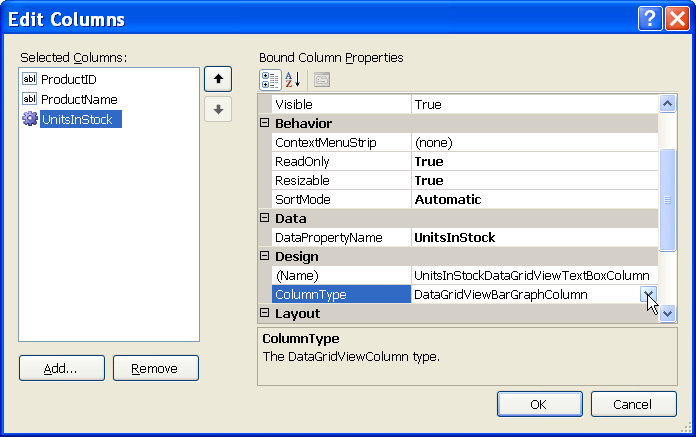
Back in your form’s Design view, edit the columns in the DataGridView control. For the UnitsInStock column (or whatever numeric column you’re using), select the DataGridViewBarGraphColumn type, as shown in Figure 3. Click OK, then save and run your project. If all goes well, you should see the bar graph column as shown in Figure 1.
Of course, you’re not limited to just this sort of customization. You can inherit from any of the various cell types, including columns that display Button, CheckBox, ComboBox, Image, or Link controls. Select the correct class to inherit from, and you’ll find that most of the work has been done for you. In addition, each of the base classes provide many protected methods you can override, providing you with the capability of creating exactly the cell type that you need. As in any such project, knowledge of the classes in the System.Drawing.Drawing2D namespace really comes in handy-take some time to investigate the classes you’ve seen in this example, if you haven’t worked with them before. You’ll certainly use them again.
| Parameter | Description |
|---|---|
| graphics | A Graphics object you can use when painting your cell. |
| clipBounds | A Rectangle that represents the area of the DataGridView control that needs to be repainted. |
| cellBounds | A Rectangle that represents the area of the cell in which you’re drawing. |
| rowIndex | The row index of the cell you’re drawing. |
| cellState | A bitwise combination of DataGridViewElementStates values (Displayed, Frozen, None, ReadOnly, Resizable, ResizableSet, Selected, Visible) indicating the state of the cell. |
| value | The data of the cell that you’re painting, as an object. |
| formattedValue | The formatted value for the cell you’re painting, as an object. |
| errorText | The error message associated with the cell. |
| cellStyle | A DataGridViewCellStyle instance that contains formatting and style information about the cell |
| advancedBorderStyle | A DataGridViewAdvancedBorderStyle instance that contains information about the border style for the cell. |
| paintParts | A bitwise combination of DataGridViewPaintParts values (All, Background, Border, ContentBackground, ContentForeground, ErrorIcon, Focus, None, SelectionBackground) that indicates the parts of the cell that need to be repainted. |