Software developers live and breathe debugging. It’s an essential and integral part of our day-to-day job. Whenever we are confronted with any bug in code, our typical first question is, “How can I reproduce this issue?” Any problems that cannot be reproduced are generally considered tricky to resolve. In order to really understand the challenges with debugging hard to reproduce issues, let’s walk through a few scenarios here.
Let’s say you are working on your company’s flagship product. While writing some code you come across some bugs. Frankly there is nothing abnormal in this scenario and as a software developer you always strive to minimize the number of bugs in your code. Most developers would just fix those bugs and move on.
Now let’s say your product is with the QA team and during testing they find some bugs in the product. Again, there is nothing exciting in this scenario because this is a typical step in the software development lifecycle.
Suppose that your product is released and deployed to customer sites. And only after release do you start getting complaints like application crashing, slow performance or the application has hung. Suppose these are problems that haven’t been seen before so your team may try to reproduce the problem but have no luck with it. As far as you can tell there is no hardware or software configuration difference that can cause this problem. So now you have to debug this problem that you cannot reproduce. What can you do here?
Let’s go a step even further. Let’s say your product is deployed to several customer sites. It’s working fine for all of them except one. At that site the client observes problems like app crashing and the application will hang. Your team cannot re-produce this problem in-house. You know this client generates most of the revenue for your company and because of product downtime, your company is losing money as well. This is really a pressure game; your team will be under lot of pressure to resolve these problem ASAP that you don’t know how to reproduce. These last two scenarios describe what it means to debug hard to reproduce issues. This article will talk about some approaches that you can take to tackle these types of situations.
Post-Mortem Debugging
For the situations described above, there are some proven methodologies that you can use to get to bottom of the issues. The main idea behind these methodologies is that when a process is in an unhealthy state, the process itself contains critical data that you can use to find what’s going on. If somehow you can look into the memory space of processes and get to the right data structures, there is a very good chance that you can find the root cause of problem. This methodology is called post-mortem debugging. Figure 1 describes the steps involved in the process.
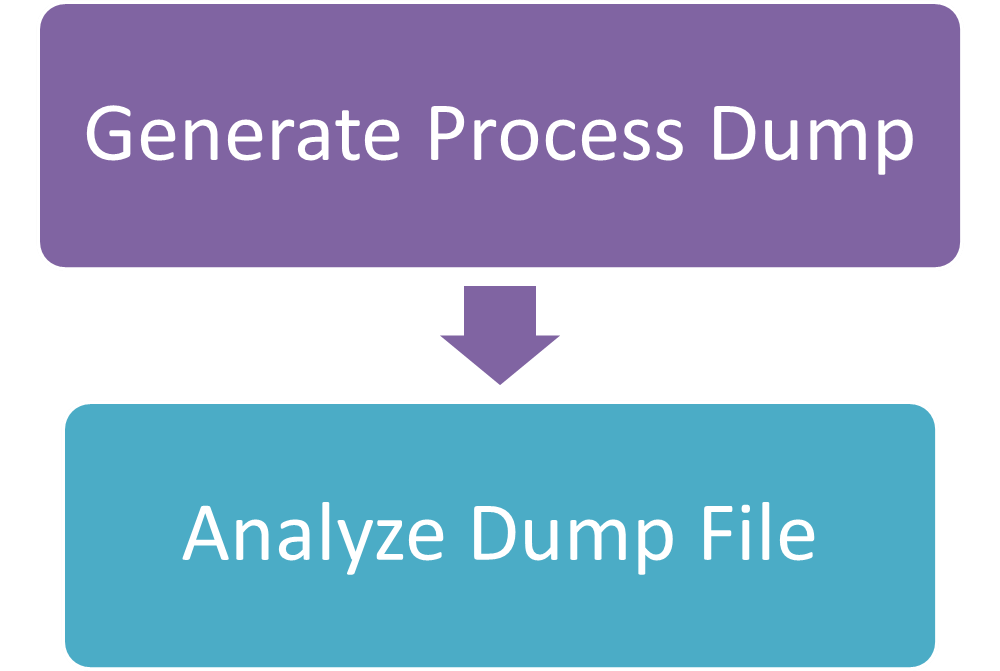
Post-mortem debugging involves two steps. First you write code to take a snapshot of processes which gives us a file with the extension dmp. This file is called a dump file. The critical thing here is the timing of generating process dump. You will have to generate process dump when the problem is actually happening. If you take a snapshot of a process when it is in a healthy state, then it may not contain the data that can help you figure out the root cause of the problem. The second step is to analyze the dump file. You can use one of several debuggers to perform this type of analysis such as cdb, nstd, Windbg, DebugDiag. You can even use Visual Studio for this type of analysis.
The chief advantage of this two-steps approach is that for analyzing the dump file, you don’t have to be on the same machine where the problem is happening. Once you generate the dump file, you can move it to any other computer for analysis. This is a huge benefit, because if the problem is happening at a client production data center, their system administrator will not be too eager to grant you permissions for dump file analysis.
What Is a Dump File?
Before I delve into details of how to capture a process dump file, let me explain what a dump file is. A dump file is basically a portion of process virtual memory that contains information like threads running in process, their call stacks, objects present on stack, objects present on the heap and exception records. All of this data becomes part of a dump file when you generate a memory snapshot. You can use dump files to troubleshoot problems like sluggish performance, application hangs or crashes.
When capturing a process dump, it is really important to use the right set of tools according to your target process. For instance, if your application is 32-bit running on a 64-bit operating system, you should use a 32-bit debugger to generate process dump. If you don’t use the correct version of the debugger, you will likely see incorrect call stacks that can completely throw off your analysis in the wrong direction.
You’ll use various tools available to generate process dumps. Which tools you use will depend upon the type of problem you are encountering. For example, a tool that you might use to generate process dump in a hang scenario, may not be very effective when you are investigating a crash or high CPU scenario. Given that most of the time you will have to use these tools in a production environment, generally you will prefer to use tools that have the smallest footprint. In this article I will discuss the following four tools for generating a dump file.
- Task manager
- ADPlus
- ProcDump
- DebugDiag
Let’s take look at how to generate a process dump using each of these tools.
Task Manager
The easiest way to generate a process dump is by using Task Manager. Starting from Windows Vista, Task Manager provides an option to generate a process dump. If you happen to use any operating system before Vista (e.g., Windows XP) you will not get this option within Task Manager. It is extremely simple to generate a dump file. All you have to do is launch Task Manager, click on the Processes tab, right-click to select a process and choose Create Dump File from the popup menu as shown in Figure 2.
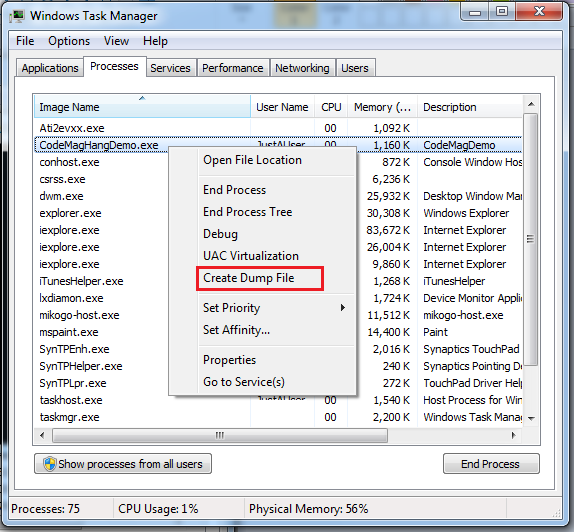
Once you click the Create Dump File option, Windows will create a snapshot of the selected process and will save the snapshot in the temp directory. Keep in mind that if you want to create a dump file for a 32-bit process running on a 64-bit OS, you should use the 32-bit version of Task Manager, which is typically located at C:\Windows\SysWOW64.
Even though generating a process dump using Task Manager is straightforward, it is still a manual process. You’ll encounter certain situations where generating process dump using Task Manager will not be trivial. Let’s say your application crashes intermittently at unpredictable times. In this situation, it is not practical to have someone monitoring the process in Task Manager and click Create Dump File at exactly the right time when the application crashes. Other tools are better suited in this type of situation. That’s where this next tool, ADPlus, comes into the picture.
ADPlus
ADPlus is a powerful and flexible tool to automate the dump file generation process. You can download it for free from Microsoft’s website at microsoft.com/whdc/devtools/debugging/default.mspx. ADPlus is part of what is called “Debugging Tools for Windows.” Earlier versions of ADPlus used to be a Visual Basic Script (vbs) file, but now ADPlus is available as a managed executable application. The older vbs scripts file is still part of that download. You can run ADPlus as a command-line application using switches to control the mode of operation and type of dump file you want to generate. ADPlus can also work using a configuration file that allows far more granular control to end users.
ADPlus supports two different execution modes for taking a snapshot of a faulty process.
Let’s take a look at couple of examples of how ADPlus can be used in these two modes. When you use ADPlus in hang mode, it’s pretty much the same action as generating a dump file using Task Manager. The following code snippet shows the command to use for generating a dump file in hang mode.
ADPlus -hang -pn CodeMagHangDemo.exe -o E:\Dumps
You start running this command using the hang switch. This switch instructs ADPlus to generate a dump file as soon as the command executes. The example used the -pn switch to define the target process name but it could have used the -p switch to configure a process by its process ID. The -p switch is useful in situations where you have more than one instance of the same process running and you want to generate a dump file for a particular instance. Finally, the example above uses the -o switch to configure the path where the dump file should be created.
Now let’s take a look at another example of using ADPlus to generate a dump file of an application that crashes at random times. Listing 1 shows the code used to exhibit this crash behavior. The example simulates randomness by asking the user to press a key.
In this scenario, using ADPlus in hang mode will not be a good choice as it’s not possible to predict when the process will crash. The following code snippet shows the command line to run ADPlus in crash mode.
ADPlus -crash -pn CodeMagCrashDemo.exe -o E:\Dumps
The primary difference between the two command lines is the use of a -hang vs. a -crash switch. When you run ADPlus in crash mode, a debugger gets attached to the target process and it waits for an unhandled exception to be raised. Once a process raises an exception, the debugger writes out the dump file.
The real flexibility of ADPlus comes from the long list of switches it supports. It uses an XML-based configuration file to provide granular control for items like when to generate a dump file, what actions should be taken and the type of dump file to create. ADPlus comes with a help document that provides details on switches and configuration file management.
ProcDump
ProcDump is another command-line tool used to generate dump files. You can download this free utility from Microsoft’s website at http://technet.microsoft.com/en-us/sysinternals/dd996900.aspx. Just like ADPlus, you can use ProcDump to monitor processes for hang or crashing issues. However, you get to see the real flexibility of ProcDump when you have to generate a dump file based on complex threshold criteria. Let’s take a look at an example. Figure 3 shows the CPU usage as consumed by our sample application CodeMagHighCPUDemo.
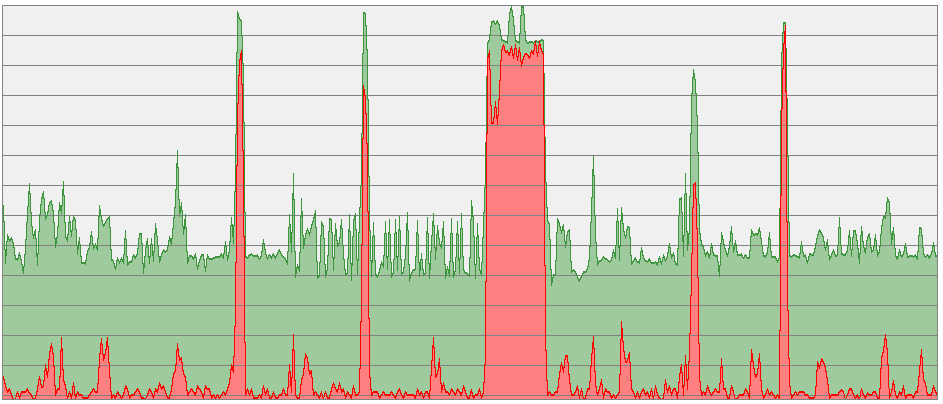
As you can see from Figure 3, our sample application consumes high CPU cycles intermittently. A few times, these CPU spikes are short, but you can also see sustained high CPU usage. Generally speaking, sustained high-CPU spikes for longer duration will be more concerning, and if you don’t know what is causing it, the next step will be to take a process dump when it’s consuming high CPU for a sustained period of time. Figure 4 shows the ProcDump command and its output.
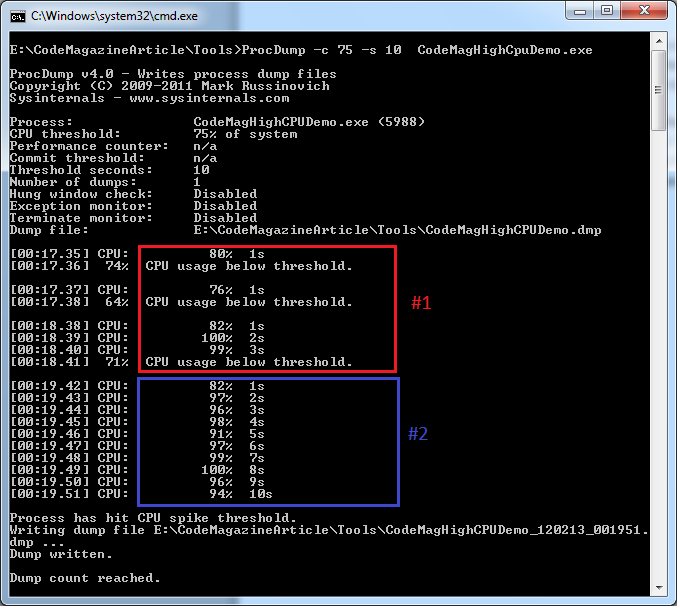
The command line for this example sets up ProcDump by first using the -c switch to configure the threshold for CPU usage. This example uses a threshold of 75%. The command line adds a -s switch to indicate that the dump file should be generated only when the CPU usage threshold exceeds 10 seconds. Finally, the command line indicates the application name (CodeMagHighCPUDemo.exe) that ProcDump will monitor. As you can see from the output of the ProcDump command in Figure 4, CPU usage hit the 75% threshold but it didn’t stay there for 10 seconds. However, when there was sustained CPU usage for 10 seconds, ProcDump generated the dump file.
ProcDump offers several other very useful switches. For instance, this example only generated one dump file. In some situations you might like to get more than one dump file. In that case you can use the -n switch to configure the number of dump files you would like to get. Another useful parameter is -u, which you can use to configure CPU usage relative to a single core, which could be quite handy when you are running process on a multi-core machine. Another interesting switch, -w*,* will make ProcDump wait for a target process to be launched in case it’s not already running. One more parameter I find interesting is -p*,* which you can use to configure thresholds based on specific performance counters.
I highly encourage readers to run the ProcDump -? command or look at the product documentation at http://technet.microsoft.com/en-us/sysinternals/dd996900.aspx and go over other switches supported by this tool.
DebugDiag
Debug Diagnostic Tool (DebugDiag) is yet another tool to troubleshoot issues like memory leaks, hangs, crashes etc. You can download it from the Microsoft Download Center. What makes it different from ADPlus or ProcDump is that it provides an easy to use UI to configure your rules and thresholds for capturing dump files. In addition, DebugDiag also has the ability to analyze dump files and determine the root cause of issues. The analysis service uses an extensible object model that a developer can use to write their own custom analysis scripts.
Before I delve into details of how to generate a crash dump via DebugDiag, let’s take a brief look at its four primary building blocks.
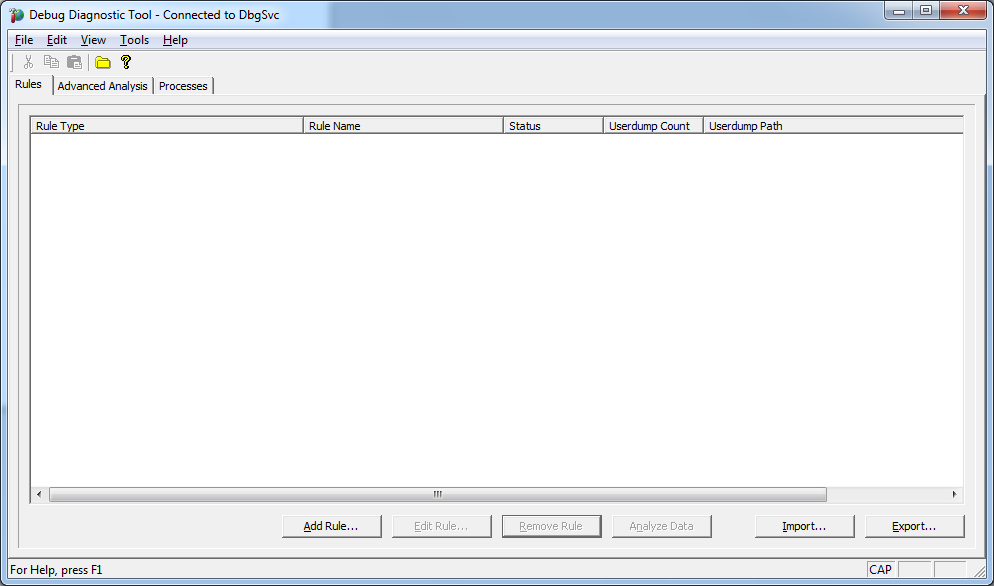
User Interface
Figure 5 displays DebugDiag’s main user interface. You’ll use it to configure the rules and threshold to generate process dump as well as for dump files analysis.
Host
Host application (DbgHost.exe) is used to perform post-mortem debugging on the dump file with the help of a control script. This script defines what actions the debugger takes for analyzing the dump files.
Service
DebugDiag contains a Windows service application that runs as a background process primarily to attach and detach host to target processes for crashing applications. In addition, this service also facilitates hang application detection, collection of performance monitor logs and dump counter maintenance, etc.
Leak Tracker
Leak Tracker is a dynamic link library used to monitor processes for troubleshooting memory leaks.
Collecting a Crash Dump with DebugDiag
Let’s take a look at how you can use DebugDiag to collect a crash dump. For this example, from the main UI (Figure 5) you will click the Add Rule button. This will take you to the Select Rule Type dialog box shown in Figure 6.
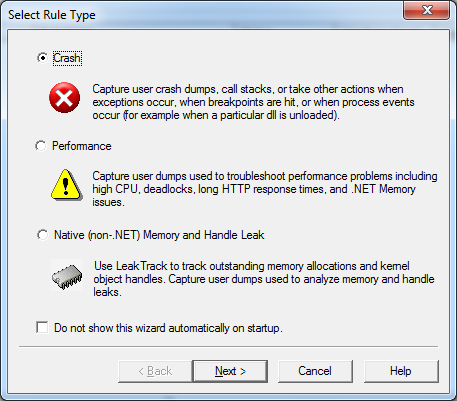
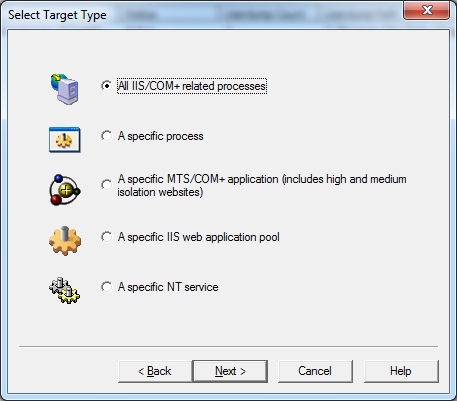
This dialog lets you configure a rule type. For this example, choose the Crash option and click Next. Now you can select the target type, as shown in Figure 7. This dialog box offers you several options. For this example, choose the A specific process option and then click Next.
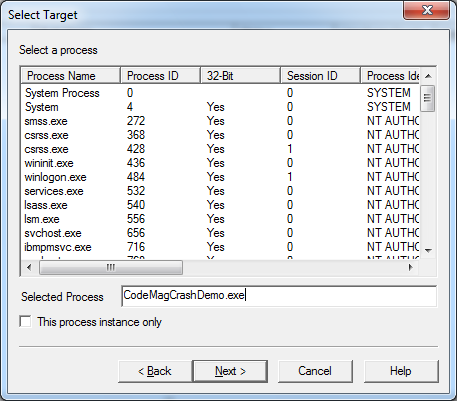
You should see the Select Target dialog box (Figure 8) for selecting a specific process. You can either choose a particular process instance or you can just type a process name.
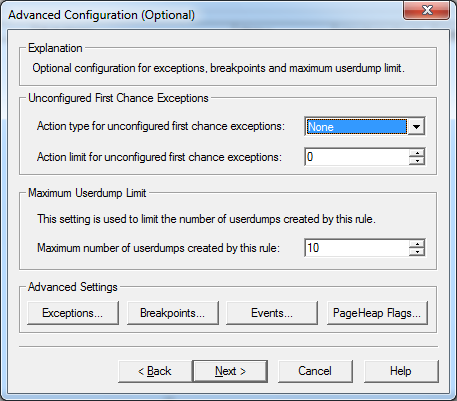
Once you select a target process and click Next, you’ll get a chance to configure some advanced optional parameters (Figure 9). You can set things like the number of dump files to generate, actions to be taken for first chance exception, etc. This example doesn’t require advanced configuration so leave the default settings and click Next.
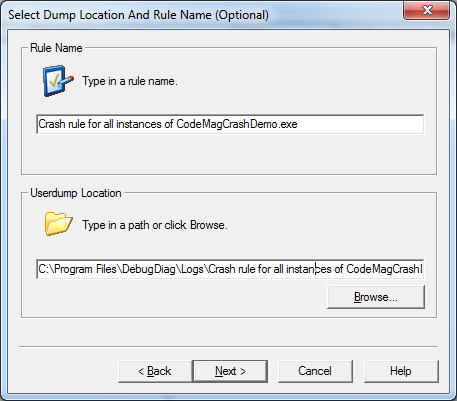
You’ll now see Figure 10 which lets you provide a name for this newly defined rule and choose a path for the dump file. Leave the defaults and click Next.
On the last screen (Figure 11) you can choose to either activate this rule right away or leave it to activate at another time. If you don’t activate the rule right away, you will still have the ability to activate the rule later. For this demo, choose Activate the rule now and then click Finish.
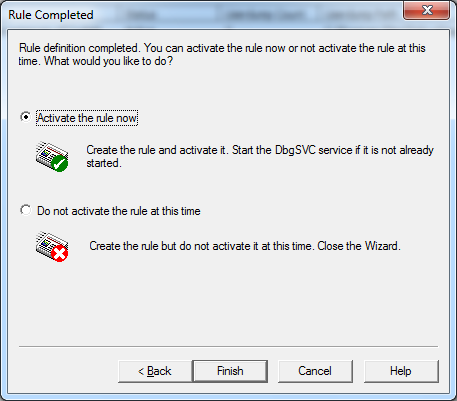
At this point the rule is configured. If you launch the sample application, CodeMagCrashDemo.exe, you should get a crash dump file at the configured location.
DebugDiag UI makes it very easy to configure different types of rules, however, it may not be your first choice tool for capturing process dump in a production envionment due to installation requirements of its components. DebugDiag also contains a simplified UI just for performing dump file analysis called Debug Diagnostics Tool (Analysis Only*).* It lets you generate process dumps from any of the light-weight tools discussed above and then use DebugDiag Analysis Only to analyze those dump files to find the root cause of an application’s problem.
Dump File Analysis
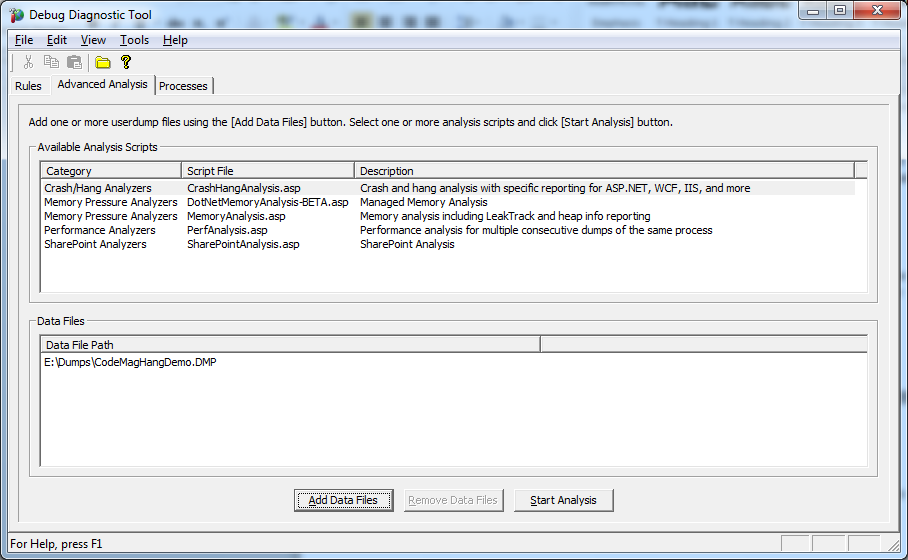
Now that you have learned several different ways of capturing process dump, let me discuss how to analyze dump files. Like I mentioned earlier there are several different debuggers. In this article I will show you how to use DebugDiag. As shown in Figure 12, DebugDiag UI has an Advanced Analysis tab that can help you to perform analysis on a dump file. First you have to choose the analysis script you want to execute. Out of box, DebugDiag provides useful analysis script for problems like crash, hang, performance and memory issues. You can also add your own custom scripts. In this article we’ll analyze the dump file for CodeMagHangDemo process to try to solve why the application hangs. From the list of Available Analysis Scripts, choose the option for Crash/Hang Analyzers. Next, you can add the dump file by clicking the Add Data Files button. In some cases, you may get more than one process dump file. For example, if your application is hosted under IIS and if that IIS instance contains multiple web applications, you will see multiple w3wp.exe processes active at a time. In this case, if DebugDiag is configured to generate crash dump via process name (and not process ID) you will end up getting multiple dump files, one for each of the running w3wp process. In this situation you may not be sure as to which w3wp process needs to be analyzed. Your best choice will be add all those dump files by using the Add Data Files button.
Once the analysis script and data file are set up, click the Start Analysis button. DebugDiag will analyze the dump file and will produce an HTML report that you can open in a browser. As shown in Figure 13, the report starts with a summary of issues that it has found. In the later part of this report, it contains more information about the process, threads in process, their call stack, etc. In this particular case, the report warns that thread 0 is making a sleep call. Click on thread # 0 to learn further details about it.
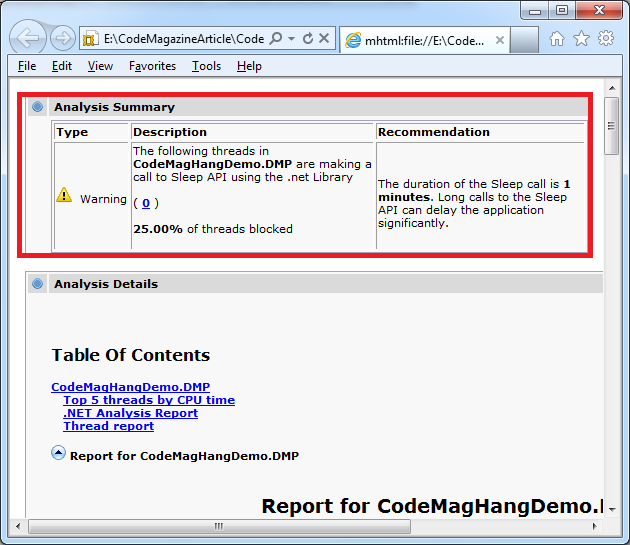
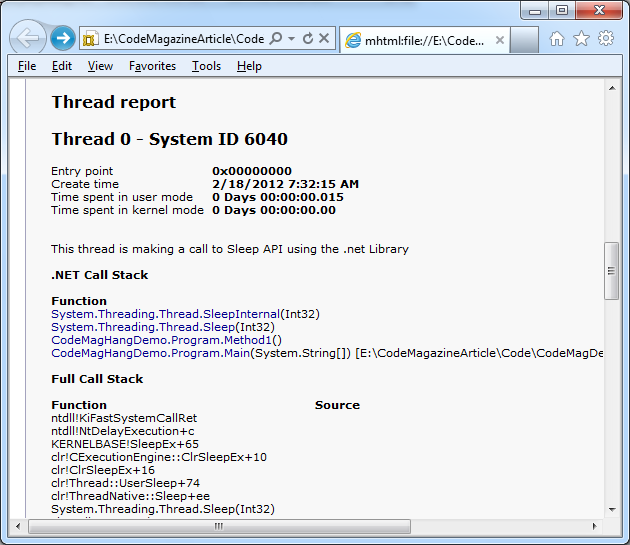
Figure 14 shows the details of thread 0 including the call stack. From this report we can conclude that the process goes into hang state because it makes a Sleep call.
Summary
This article described the challenges associated with debugging hard-to-reproduce issues. It introduced post-mortem debugging and also looked at various tools that can help you to generate a dump file and later analyze those files. All the demos in this article are very basic. These tools provide much more flexible configurations too. I strongly encourage readers to read the support documentation of these tools and get familiar with those additional features.
Listing 1: Code exhibiting crash behavior
class Messenger
{
   public string Message { get; set; }
}

class Program
{
   static void Main(string[] args)
   {
      Console.WriteLine("Press any key to crash this application");
      Console.Read();
      Print(null);
   }
   static void Print(Messenger p)
   {
      Console.WriteLine(p.Message);
   }
}