


Developing User Interfaces with GitHub Copilot, Part 4
by John Miller | First published: May 29, 2025 - Last Updated: February 11, 2026
In the conclusion to this series on AI-assisted UI development, I'll have GitHub Copilot (GHC) add client-side sorting to a data table. If you missed any of the previous posts, you can find them here: Part 1, Part 2, and Part 3.
Whenever data is rendered in a table, users often find it useful to sort the table by the data in one column. Modern UIs often let a user click on a column header to sort. Typically this requires changes to the HTML to trigger the sorting, code changes to sort the data, control the sort direction, and render the sorted data. Style changes are needed to provide user feedback. Sorting by more than one column complicates the implementation.
Rather than hand-coding the changes, it could be more effective to ask GHC to attempt the implementation, as it will likely be faster and hopefully of good quality. The prompt to GHC and its response are enclosed in horizontal lines.
Here is the prompt I gave Claude 3.7 Sonnet with the context of the vSalesFunnelSummary.vue.
Prompt: Add the ability to sort the detail table by Status, Total Deal Value, or Average Age.
Here is the Copilot response:
GHC: # Adding Sorting Functionality to the Sales Funnel Summary Table.
I'll add the ability to sort the details table by implementing sort functionality on the table headers.
Step-by-Step Solution:
- Add state variables to track the sort field and direction.
- Create a computed property that returns the sorted data.
- Implement a toggle sort function.
- Update the table headers to be clickable and show sort indicators.
- Use the sorted data in the table rendering.
GHC generated a new version of the Vue with several modifications. I'll talk through what GHC's modification is, rather than the entire code listing. If you're interested in the rest of the code, it's included as Listing 1 at the end of the post.
Update the Table Headers to be Clickable and Show Sort Indicators
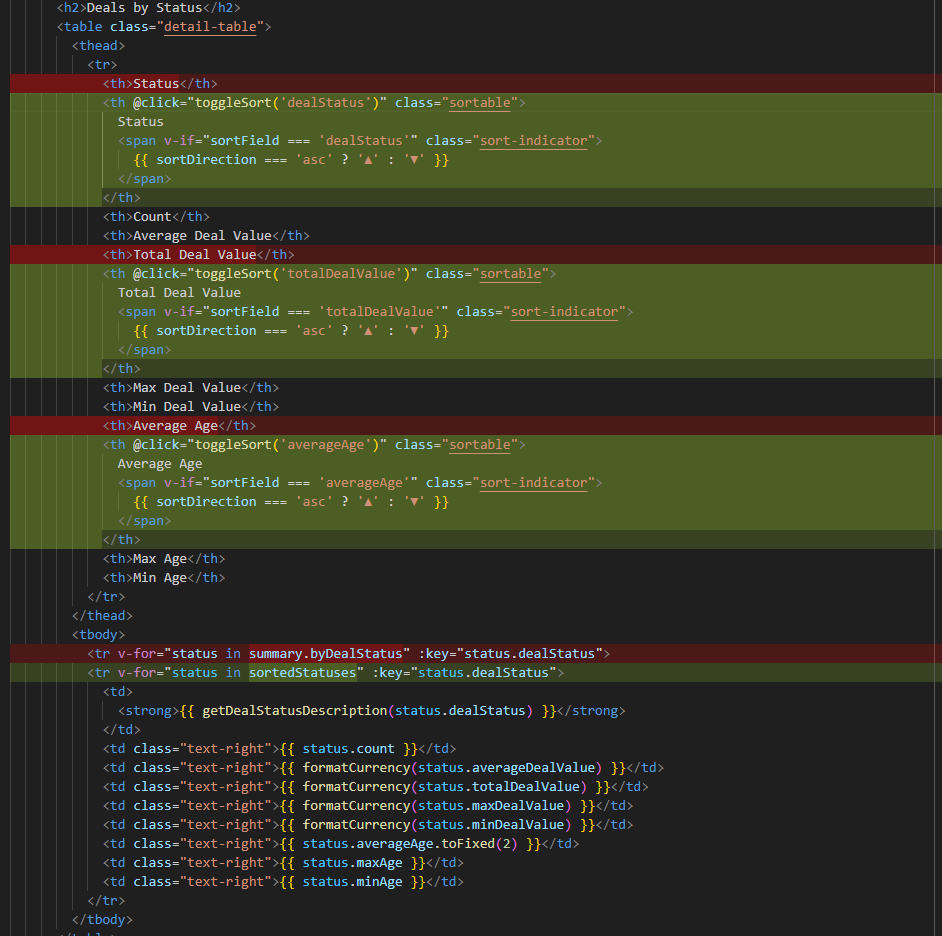
First up are the HTML changes. GHC updated the Status, Total Deal Value, and Average Age column header cells to add the UI and triggers needed to implement the sorting.
The column header cell is interactive: it uses the @click directive to call a method named toggleSort with an argument associated with the sorted column (dealStatus, totalDealValue, and averageAge) whenever the header is clicked. This suggests that clicking the header will sort the table rows based on the associated field.
The class="sortable" adds a CSS class to visually indicate that the column can be sorted by adding a hover effect.
Inside the header, there is a conditional <span> element that displays a sort indicator (an up or down arrow) only if the current value of sortField matches the associated field. The arrow direction is determined by the value of sortDirection: an upward arrow (▲) for ascending order and a downward arrow (▼) for descending order. This provides a clear visual cue to users about the current sort state of the column.
Use the Sorted Data in the Table Rendering
The last code change in this section is the change to render the sortedStatus collection instead of the summary.byDealStatus collection.
Here are the HTML changes to the vSalesFunnelDetail Vue.
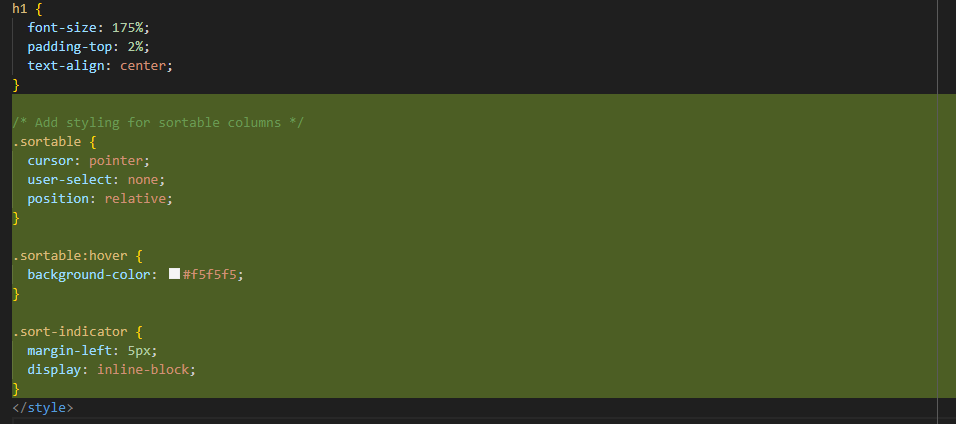
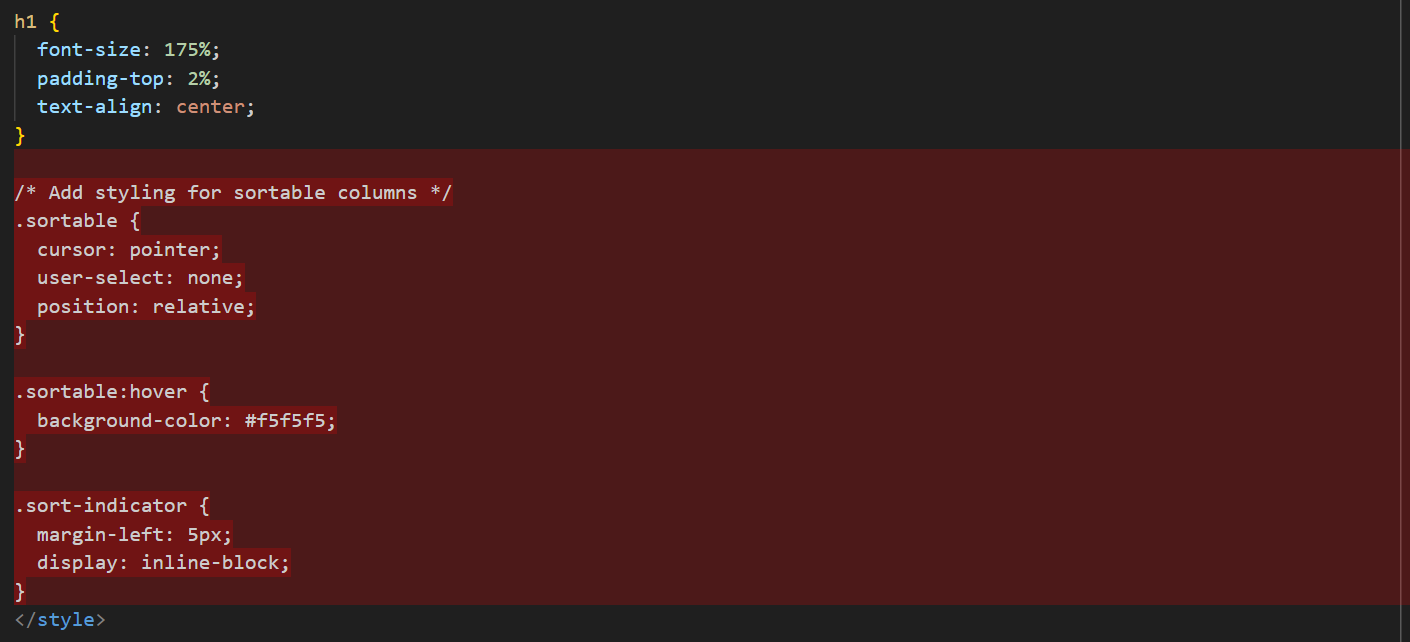
The style changes for sortable columns are fairly straightforward. The .sortable class is applied to table headers that users can click to sort data. It changes the cursor to a pointer, signaling interactivity, and disables text selection to prevent accidental highlighting when clicking. The position: relative; property allows for absolutely positioned child elements, such as the sort indicators.
When a user hovers over a sortable column, the .sortable:hover selector changes the background color to a light gray (#f5f5f5), providing visual feedback that the column is interactive. The .sort-indicator class is used for elements (like arrows or icons) that visually indicate the current sort direction. It adds a small left margin and ensures the indicator is displayed inline with the column header text.
Here are the style changes to the vSalesFunnelDetail Vue.
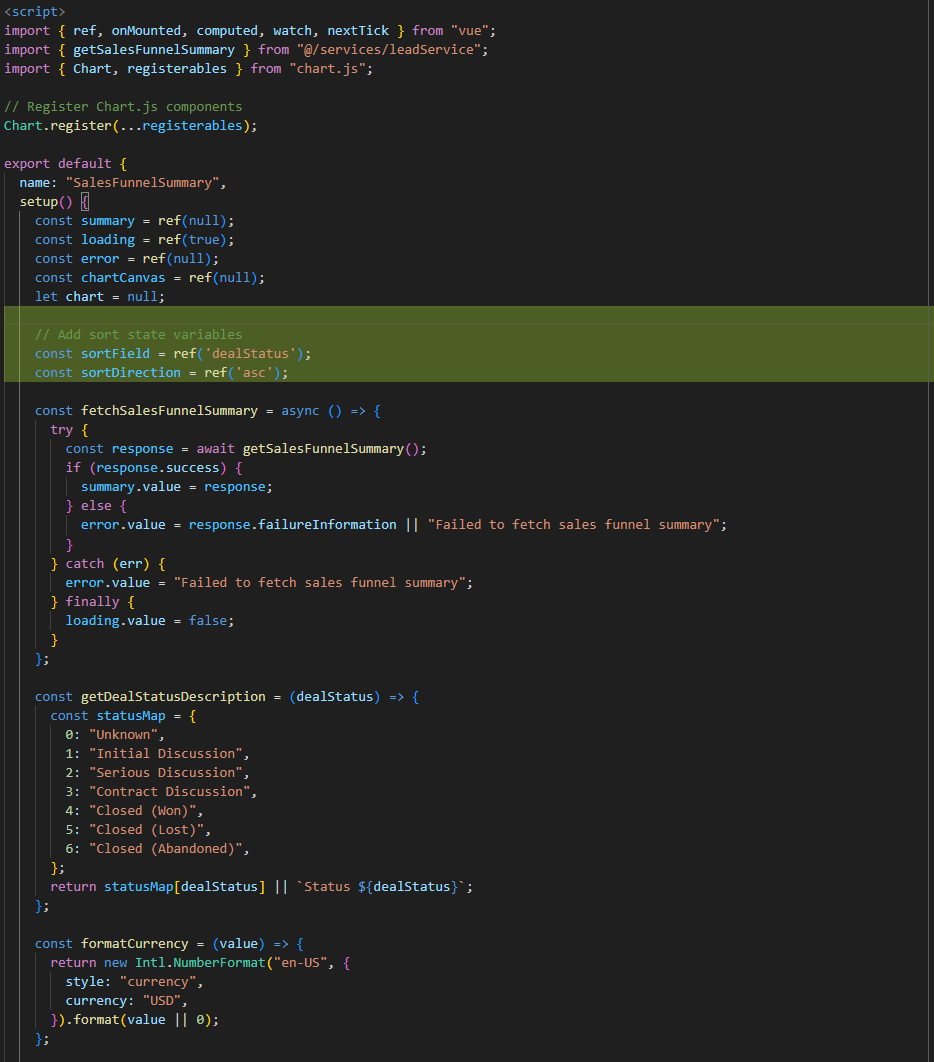
Add State Variables to Track the Sort Field and Direction
The first set of code changes defines two reactive variables using Vue's Composition API and the ref function. The first variable, sortField, is initialized with the string 'dealStatus'. This means that, by default, any sorting logic in the component will use the 'dealStatus' property of the data as the field to sort by. The second variable, sortDirection, is initialized with the string 'asc', which stands for ascending order, which is the default sorting direction.
By using ref, both sortField and sortDirection become reactive references. This means that if their values change (for example, when a user clicks a column header to change the sort order), Vue will automatically update any part of the template or computed properties that depend on these values.
Here are the state variable code changes to the vSalesFunnelDetail Vue.
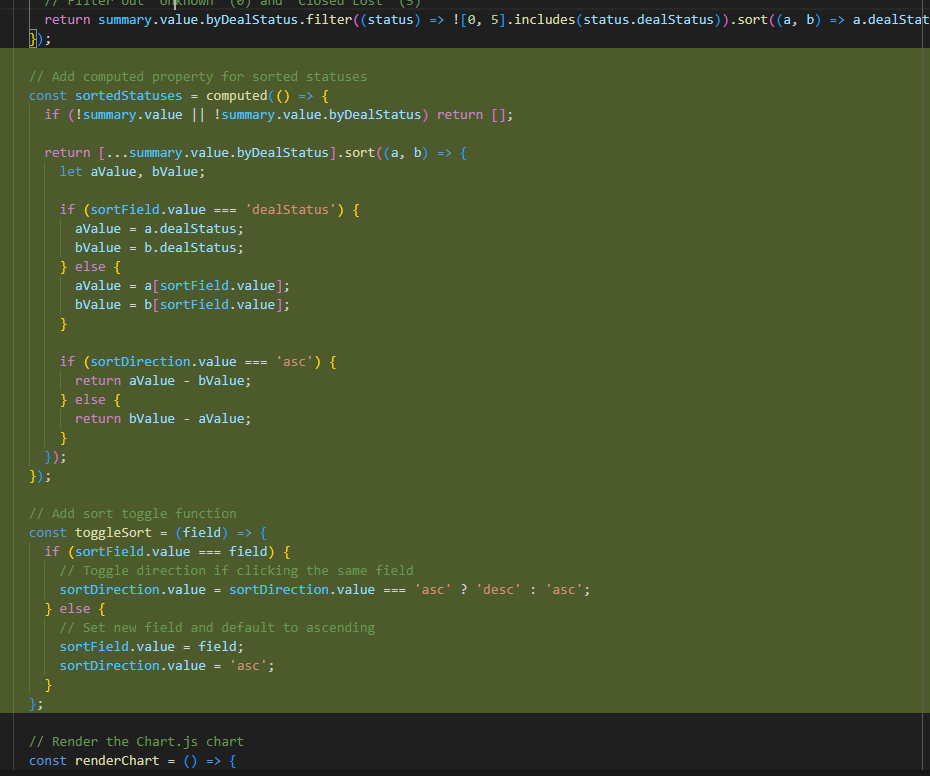
Create a Computed Property That Returns the Sorted Data
The main code changes to implement sorting are defining a computed property called sortedStatuses and a function called toggleSort within a Vue component using the Composition API. The purpose of sortedStatuses is to provide a dynamically sorted array of deal statuses, which is used to display a sortable table in the UI.
The sortedStatuses computed property first checks if the summary object and its byDealStatus property are available. If not, it returns an empty array to prevent errors. If the data exists, it creates a shallow copy of the byDealStatus array and sorts it based on the currently selected sort field and direction. The sorting logic checks whether the sortField is 'dealStatus'; if so, it sorts by the dealStatus property of each item. Otherwise, it sorts by the property specified by sortField.value. The sort direction is controlled by sortDirection.value, toggling between ascending ('asc') and descending ('desc'). The comparison uses subtraction, which works for numeric fields, but could cause issues if the fields are strings (a potential “gotcha” to watch for).
Implement a Toggle Sort Function
The toggleSort function changes the sorting behavior when a user interacts with the UI (for example, by clicking a column header). If the user clicks the same field that's already being sorted, the function toggles the sort direction. If a new field is selected, it sets that as the new sort field and defaults the direction to ascending.
Here are the main code changes to the vSalesFunnelDetail Vue.
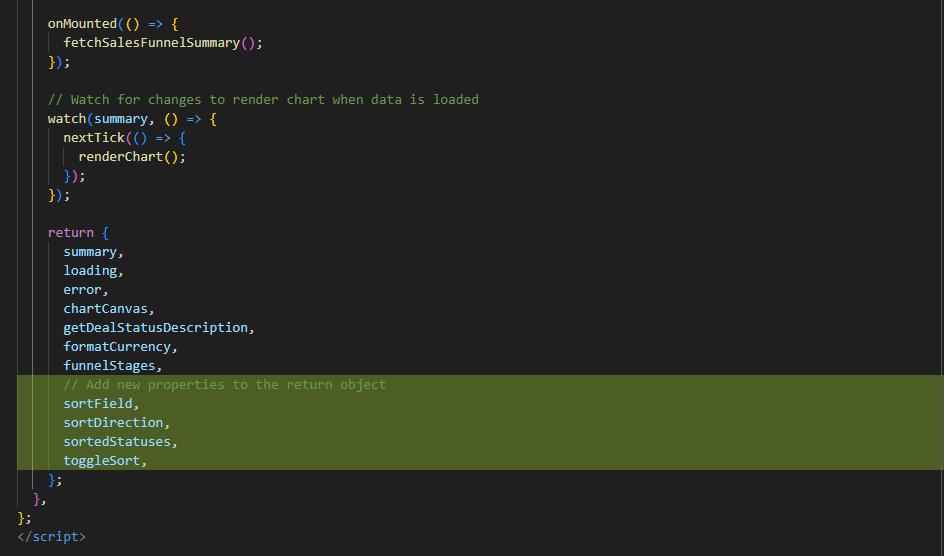
The final set of changes to the code are modifications to the setup() function return statement. In this context, the return statement exposes specific variables, computed properties, and functions to the component's template, making them accessible for data binding and event handling. Here, Copilot added sortField, sortDirection, sortedStatuses, and toggleSort.
By returning these properties and methods, the component ensures they are available for use in the template, supporting dynamic rendering, user interaction, and data presentation.
Here are the code changes to the return in the vSalesFunnelDetail Vue
The Rendered vSalesFunnelDetail Vue
Here is the rendered Vue showing that the Total Deal Value is sorted in descending order:
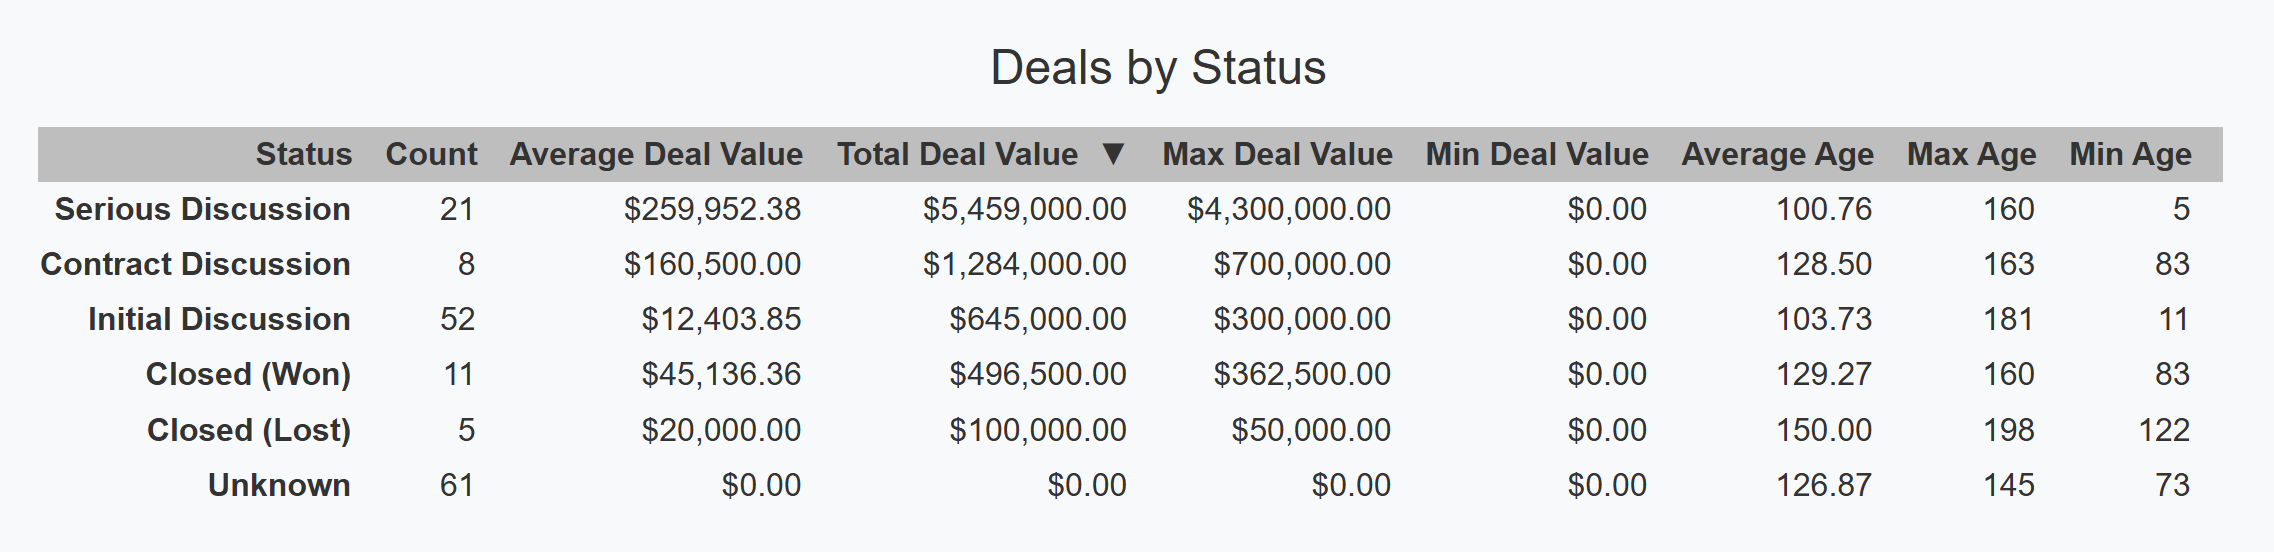
This is another good example of GHC making a seamless change to a user interface with no more effort than a reasonably accurate prompt. In this case, the first prompt submitted produced something very close to the desired results. Outside of some minor cosmetic changes, the only significant issue with the implementation is that there is some repeating logic that could be eliminated by turning the sortable header into a separate component. I'll improve the implementation by asking GHC to componentize the sortable table header.
Prompt: Extract the sortable header as a separate component. Include all of the relevant code, HTML, and CSS. Replace the existing implementation with the new component.
GHC: Create a new component for the sortable table header. Import and use the new
SortableHeadercomponent in place of the previous implementation.
Let's review the suggested changes.
As requested, Copilot created a new SortableHeader Vue. This Vue defines a table header (<th>) that is designed to be sortable. The :class binding applies the class sortable to the header by default, and conditionally adds the active class if the isActive property is true. This allows for visual feedback to indicate which column is currently being sorted.
The @click="onClick" directive attaches a click event handler, so when the header is clicked, it triggers the onClick method.
Inside the <th>, the <slot /> element allows you to insert custom content, such as the column label, from the parent component. If the column is active (i.e., currently being sorted), a <span> with the class sort-indicator is displayed. This span shows an upward arrow (▲) if the sortDirection is "asc" (ascending), or a downward arrow (▼) if it is "desc" (descending). This visual cue helps users understand the current sort state of the column.
Here is the new SortableHeader component HTML:
<template>
  <th :class="['sortable', { active: isActive }]" @click="onClick">
    <slot />
    <span v-if="isActive" class="sort-indicator">
      {{ sortDirection === "asc" ? "▲" : "▼" }}
    </span>
  </th>
</template>
The component accepts three required properties: field, sortField, and sortDirection, all of which are strings. The field property identifies which column this header represents. The sortField property indicates which column is currently being sorted, and sortDirection specifies the current sort order (for example, "asc" or "desc").
A computed property, isActive, checks if the current header is the one being sorted by comparing sortField to field. This is useful for visually indicating the active sort column in the UI.
The component emits a toggle-sort event when the header is clicked, passing its field value as a payload. This allows the parent component to update the sorting state accordingly. The onClick method handles this event emission.
Here is the new SortableHeader component script:
<script>
export default {
  name: "SortableHeader",
  props: {
    field: { type: String, required: true },
    sortField: { type: String, required: true },
    sortDirection: { type: String, required: true },
  },
  emits: ["toggle-sort"],
  computed: {
    isActive() {
      return this.sortField === this.field;
    },
  },
  methods: {
    onClick() {
      this.$emit("toggle-sort", this.field);
    },
  },
};
</script>
The .sortable class gives elements a pointer cursor to indicate interactivity, disables text selection for a smoother user experience, and sets the position to relative, which is often used to position child elements absolutely within the header. The .sortable:hover selector changes the background color when the user hovers over the header, providing a visual cue that the element is interactive. The .sort-indicator class adds a small left margin and ensures the indicator (such as an arrow or icon) is displayed inline with the header text. The .active class makes the font bold, typically used to highlight the currently sorted column.
Because the styles are scoped, they only apply to this component, preventing unintended side effects elsewhere in your application.
Here is the new SortableHeader component CSS:
<style scoped>
.sortable {
  cursor: pointer;
  user-select: none;
  position: relative;
}
.sortable:hover {
  background-color: #f5f5f5;
}
.sort-indicator {
  margin-left: 5px;
  display: inline-block;
}
.active {
  font-weight: bold;
}
</style>
Now for the changes to the vSalesFunnelDetail Vue. If you're interested in the rest of the code, it's included as Listing 2 at the end of the post.
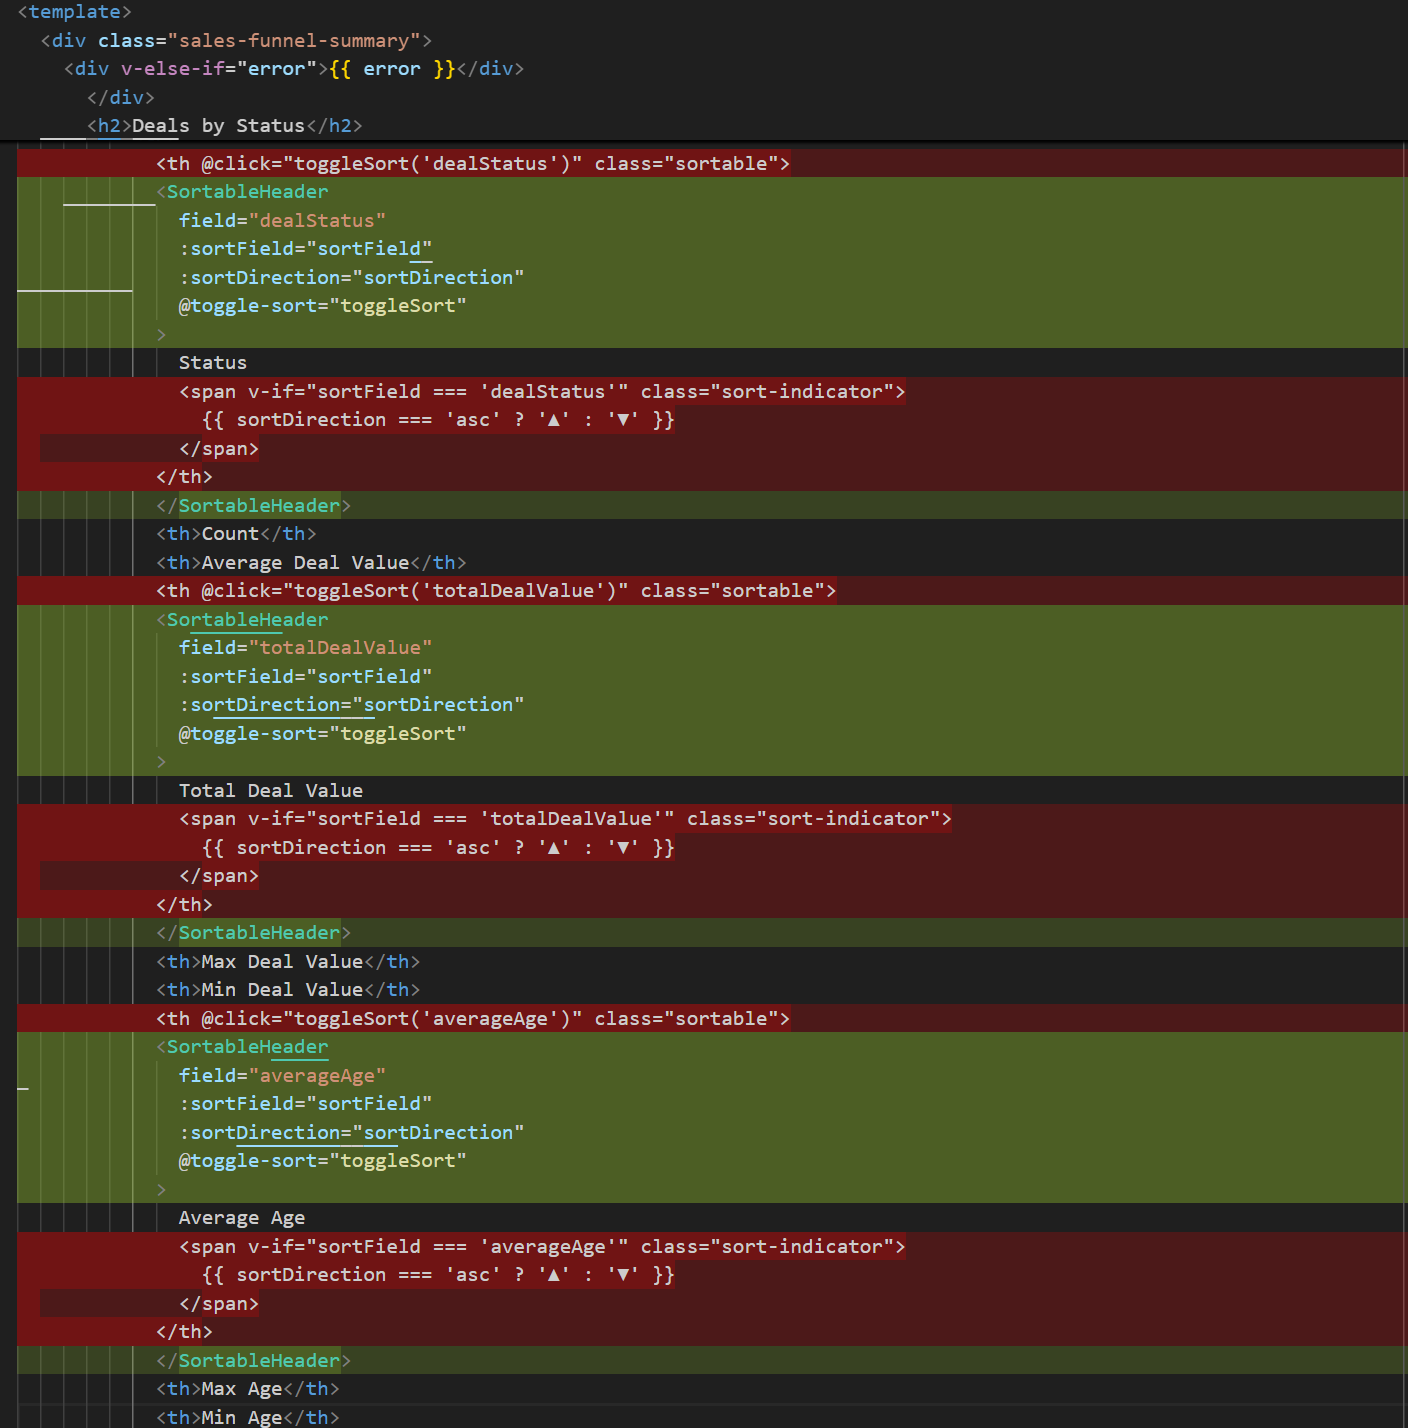
In the HTML, Copilot has replaced the <th> elements with references to the new SortableHeader component.
The field="dealStatus" property tells the component which data field it represents. The :sortField="sortField" and :sortDirection="sortDirection" properties are bound to reactive data or computed properties in your parent component, indicating the current field being sorted and the direction of the sort (ascending or descending).
The @toggle-sort="toggleSort" part is an event listener. When the SortableHeader emits a toggle-sort event (when the user clicks the header), it triggers the toggleSort method in the parent component, updating the sorting state.
Here are the changes Copilot made to the vSalesFunnelDetail HTML:
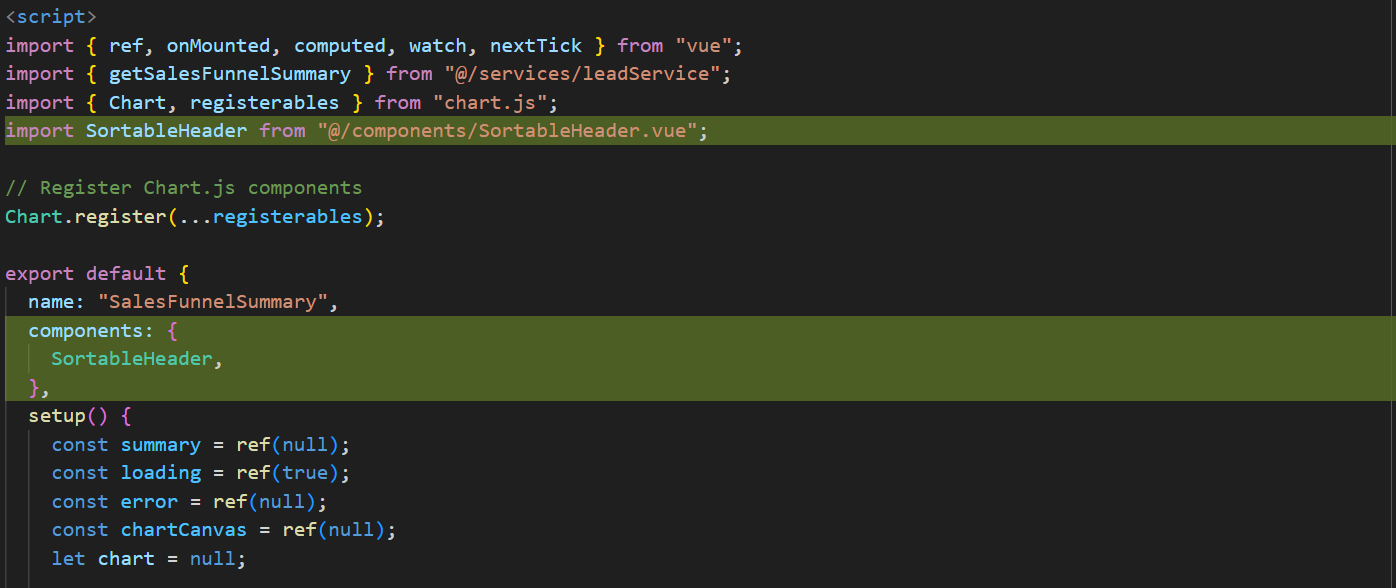
The import statement brings in the SortableHeader component from the specified path ("@/components/SortableHeader.vue"). By importing SortableHeader, we can use it as a child component within the current Vue component (vSalesFunnelSummary.vue), promoting code reuse and modularity. Encapsulating the logic and presentation of the sortable table headers in a dedicated component isolates the code in the component from the rest of the app, reducing side effects.
In Vue, the components option is used to locally register other components that you want to use within the template of the current component. By listing SortableHeader inside the components object, you make it available for use as a custom element (e.g., <SortableHeader />) in the template section of vSalesFunnelSummary.vue.
Here are the changes Copilot made to the vSalesFunnelDetail script:
Copilot drops the CSS used by the sortable header in the vSalesFunnelDetail Vue. These styles now reside in the SortableHeader component.
Here are the changes Copilot made to the vSalesFunnelDetail CSS:
This helps keep the code modular and organized by breaking down complex UIs into smaller, reusable components. The SortableHeader component can be used in any Vue that needs this functionality.
This concludes this series on using AI to develop user interfaces. I'll likely return to UI development in the future.
Feedback Loop
Feedback is always welcome. Please direct it to john.miller@codemag.com
Disclaimer
AI contributed to the writing of this blog post, but humans reviewed, refined, enhanced, and gave it soul.
- Prompts: I use the /explain prompt assist in describing the code changes.
Listings
Listing #1
<template>
  <div class="sales-funnel-summary">
    <h1>Sales Funnel Summary</h1>
    <div v-if="loading">Loading...</div>
    <div v-else-if="error">{{ error }}</div>
    <div v-else>
      <table class="summary-table">
        <tbody>
          <tr>
            <th>Total Count</th>
            <td>{{ summary.count }}</td>
          </tr>
          <tr>
            <th style="width: 200px">Average Deal Value</th>
            <td>{{ formatCurrency(summary.averageDealValue) }}</td>
          </tr>
          <tr>
            <th style="width: 200px">Total Deal Value</th>
            <td>{{ formatCurrency(summary.totalDealValue) }}</td>
          </tr>
          <tr>
            <th style="width: 200px">Max Deal Value</th>
            <td>{{ formatCurrency(summary.maxDealValue) }}</td>
          </tr>
          <tr>
            <th style="width: 200px">Min Deal Value</th>
            <td>{{ formatCurrency(summary.minDealValue) }}</td>
          </tr>
          <tr>
            <th style="width: 200px">Average Age</th>
            <td>{{ summary.averageAge.toFixed(2) }}</td>
          </tr>
          <tr>
            <th style="width: 200px">Max Age</th>
            <td>{{ summary.maxAge }}</td>
          </tr>
          <tr>
            <th style="width: 200px">Min Age</th>
            <td>{{ summary.minAge }}</td>
          </tr>
        </tbody>
      </table>

      <!-- Replace CSS Funnel with Chart.js Canvas -->
      <h2>Sales Pipeline</h2>
      <div class="chart-container">
        <canvas ref="chartCanvas"></canvas>
      </div>

      <h2>Deals by Status</h2>
      <table class="detail-table">
        <thead>
          <tr>
            <th @click="toggleSort('dealStatus')" class="sortable">
              Status
              <span v-if="sortField === 'dealStatus'" class="sort-indicator">
                {{ sortDirection === 'asc' ? '▲' : '▼' }}
              </span>
            </th>
            <th>Count</th>
            <th>Average Deal Value</th>
            <th @click="toggleSort('totalDealValue')" class="sortable">
              Total Deal Value
              <span v-if="sortField === 'totalDealValue'" class="sort-indicator">
                {{ sortDirection === 'asc' ? '▲' : '▼' }}
              </span>
            </th>
            <th>Max Deal Value</th>
            <th>Min Deal Value</th>
            <th @click="toggleSort('averageAge')" class="sortable">
              Average Age
              <span v-if="sortField === 'averageAge'" class="sort-indicator">
                {{ sortDirection === 'asc' ? '▲' : '▼' }}
              </span>
            </th>
            <th>Max Age</th>
            <th>Min Age</th>
          </tr>
        </thead>
        <tbody>
          <tr v-for="status in sortedStatuses" :key="status.dealStatus">
            <td>
              <strong>{{ getDealStatusDescription(status.dealStatus) }}</strong>
            </td>
            <td class="text-right">{{ status.count }}</td>
            <td class="text-right">{{ formatCurrency(status.averageDealValue) }}</td>
            <td class="text-right">{{ formatCurrency(status.totalDealValue) }}</td>
            <td class="text-right">{{ formatCurrency(status.maxDealValue) }}</td>
            <td class="text-right">{{ formatCurrency(status.minDealValue) }}</td>
            <td class="text-right">{{ status.averageAge.toFixed(2) }}</td>
            <td class="text-right">{{ status.maxAge }}</td>
            <td class="text-right">{{ status.minAge }}</td>
          </tr>
        </tbody>
      </table>
    </div>
  </div>
</template>

<script>
import { ref, onMounted, computed, watch, nextTick } from "vue";
import { getSalesFunnelSummary } from "@/services/leadService";
import { Chart, registerables } from "chart.js";

// Register Chart.js components
Chart.register(...registerables);

export default {
  name: "SalesFunnelSummary",
  setup() {
    const summary = ref(null);
    const loading = ref(true);
    const error = ref(null);
    const chartCanvas = ref(null);
    let chart = null;

    // Add sort state variables
    const sortField = ref('dealStatus');
    const sortDirection = ref('asc');

    const fetchSalesFunnelSummary = async () => {
      try {
        const response = await getSalesFunnelSummary();
        if (response.success) {
          summary.value = response;
        } else {
          error.value = response.failureInformation || "Failed to fetch sales funnel summary";
        }
      } catch (err) {
        error.value = "Failed to fetch sales funnel summary";
      } finally {
        loading.value = false;
      }
    };

    const getDealStatusDescription = (dealStatus) => {
      const statusMap = {
        0: "Unknown",
        1: "Initial Discussion",
        2: "Serious Discussion",
        3: "Contract Discussion",
        4: "Closed (Won)",
        5: "Closed (Lost)",
        6: "Closed (Abandoned)",
      };
      return statusMap[dealStatus] || `Status ${dealStatus}`;
    };

    const formatCurrency = (value) => {
      return new Intl.NumberFormat("en-US", {
        style: "currency",
        currency: "USD",
      }).format(value || 0);
    };

    // Computed property for filtered funnel stages
    const funnelStages = computed(() => {
      if (!summary.value || !summary.value.byDealStatus) return [];

      // Filter out "Unknown" (0) and "Closed Lost" (5)
      return summary.value.byDealStatus.filter((status) =>
        ![0, 5].includes(status.dealStatus)).sort((a, b) =>
          a.dealStatus - b.dealStatus);
    });

    // Add computed property for sorted statuses
    const sortedStatuses = computed(() => {
      if (!summary.value || !summary.value.byDealStatus) return [];

      return [...summary.value.byDealStatus].sort((a, b) => {
        let aValue, bValue;

        if (sortField.value === 'dealStatus') {
          aValue = a.dealStatus;
          bValue = b.dealStatus;
        } else {
          aValue = a[sortField.value];
          bValue = b[sortField.value];
        }

        if (sortDirection.value === 'asc') {
          return aValue - bValue;
        } else {
          return bValue - aValue;
        }
      });
    });

    // Add sort toggle function
    const toggleSort = (field) => {
      if (sortField.value === field) {
        // Toggle direction if clicking the same field
        sortDirection.value = sortDirection.value === 'asc' ? 'desc' : 'asc';
      } else {
        // Set new field and default to ascending
        sortField.value = field;
        sortDirection.value = 'asc';
      }
    };

    // Render the Chart.js chart
    const renderChart = () => {
      if (!chartCanvas.value || !funnelStages.value.length) return;

      // Destroy existing chart if it exists
      if (chart) {
        chart.destroy();
      }

      const ctx = chartCanvas.value.getContext("2d");

      // Prepare data for chart
      const labels = funnelStages.value.map((stage) =>
        getDealStatusDescription(stage.dealStatus));
      const counts = funnelStages.value.map((stage) => stage.count);

      // Color palette for chart bars
      const colors = ["rgba(52, 152, 219, 0.8)", "rgba(46, 134, 193, 0.8)",
        "rgba(40, 116, 166, 0.8)", "rgba(33, 97, 140, 0.8)",
        "rgba(26, 82, 118, 0.8)"];

      const borderColors = ["rgb(52, 152, 219)", "rgb(46, 134, 193)",
        "rgb(40, 116, 166)", "rgb(33, 97, 140)", "rgb(26, 82, 118)"];

      // Create the chart
      chart = new Chart(ctx, {
        type: "bar",
        data: {
          labels: labels,
          datasets: [
            {
              label: "Number of Deals",
              data: counts,
              backgroundColor: colors,
              borderColor: borderColors,
              borderWidth: 1,
            },
          ],
        },
        options: {
          indexAxis: "y", // Horizontal bar chart
          responsive: true,
          maintainAspectRatio: false,
          plugins: {
            tooltip: {
              callbacks: {
                label: (context) => {
                  const index = context.dataIndex;
                  const stage = funnelStages.value[index];
                  return `Count: ${stage.count} deals`;
                },
                afterLabel: (context) => {
                  const index = context.dataIndex;
                  const stage = funnelStages.value[index];
                  return [`Total: ${formatCurrency(stage.totalDealValue)}`,
                  `Avg Age: ${stage.averageAge.toFixed(1)} days`];
                },
              },
            },
            legend: {
              display: false, // Hide legend
            },
          },
          scales: {
            x: {
              beginAtZero: true,
              title: {
                display: true,
                text: "Number of Deals",
              },
            },
            y: {
              title: {
                display: true,
                text: "Pipeline Stage",
              },
            },
          },
        },
      });
    };

    onMounted(() => {
      fetchSalesFunnelSummary();
    });

    // Watch for changes to render chart when data is loaded
    watch(summary, () => {
      nextTick(() => {
        renderChart();
      });
    });

    return {
      summary,
      loading,
      error,
      chartCanvas,
      getDealStatusDescription,
      formatCurrency,
      funnelStages,
      // Add new properties to the return object
      sortField,
      sortDirection,
      sortedStatuses,
      toggleSort,
    };
  },
};
</script>

<style scoped>
.summary-table th {
  width: fit-content;
  text-align: right;
}

.summary-table td {
  padding-left: 10px;
}

.detail-table th {
  text-align: right;
  padding-right: 15px;
  width: fit-content;
}

.detail-table td {
  text-align: right;
  padding-right: 16px;
  width: fit-content;
}

/* Chart Container */
.chart-container {
  height: 400px;
  max-width: 900px;
  margin: 25px auto;
  padding: 15px;
  background-color: #f8f9fa;
  border-radius: 8px;
  box-shadow: 0 2px 4px rgba(0, 0, 0, 0.05);
}

h2 {
  margin-top: 30px;
  margin-bottom: 15px;
  font-size: 150%;
  text-align: center;
}

h1 {
  font-size: 175%;
  padding-top: 2%;
  text-align: center;
}

/* Add styling for sortable columns */
.sortable {
  cursor: pointer;
  user-select: none;
  position: relative;
}

.sortable:hover {
  background-color: #f5f5f5;
}

.sort-indicator {
  margin-left: 5px;
  display: inline-block;
}
</style>
Back to main article
Listing #2
<template>
  <div class="sales-funnel-summary">
    <h1>Sales Funnel Summary</h1>
    <div v-if="loading">Loading...</div>
    <div v-else-if="error">{{ error }}</div>
    <div v-else>
      <table class="summary-table">
        <tbody>
          <tr>
            <th>Total Count</th>
            <td>{{ summary.count }}</td>
          </tr>
          <tr>
            <th style="width: 200px">Average Deal Value</th>
            <td>{{ formatCurrency(summary.averageDealValue) }}</td>
          </tr>
          <tr>
            <th style="width: 200px">Total Deal Value</th>
            <td>{{ formatCurrency(summary.totalDealValue) }}</td>
          </tr>
          <tr>
            <th style="width: 200px">Max Deal Value</th>
            <td>{{ formatCurrency(summary.maxDealValue) }}</td>
          </tr>
          <tr>
            <th style="width: 200px">Min Deal Value</th>
            <td>{{ formatCurrency(summary.minDealValue) }}</td>
          </tr>
          <tr>
            <th style="width: 200px">Average Age</th>
            <td>{{ summary.averageAge.toFixed(2) }}</td>
          </tr>
          <tr>
            <th style="width: 200px">Max Age</th>
            <td>{{ summary.maxAge }}</td>
          </tr>
          <tr>
            <th style="width: 200px">Min Age</th>
            <td>{{ summary.minAge }}</td>
          </tr>
        </tbody>
      </table>

      <!-- Replace CSS Funnel with Chart.js Canvas -->
      <h2>Sales Pipeline</h2>
      <div class="chart-container">
        <canvas ref="chartCanvas"></canvas>
      </div>

      <h2>Deals by Status</h2>
      <table class="detail-table">
        <thead>
          <tr>
            <SortableHeader field="dealStatus" :sortField="sortField"
            :sortDirection="sortDirection" @toggle-sort="toggleSort">
              Status </SortableHeader>
            <th>Count</th>
            <th>Average Deal Value</th>
            <SortableHeader field="totalDealValue" :sortField="sortField"
            :sortDirection="sortDirection" @toggle-sort="toggleSort">
              Total Deal Value </SortableHeader>
            <th>Max Deal Value</th>
            <th>Min Deal Value</th>
            <SortableHeader field="averageAge" :sortField="sortField"
              :sortDirection="sortDirection" @toggle-sort="toggleSort">
              Average Age </SortableHeader>
            <th>Max Age</th>
            <th>Min Age</th>
          </tr>
        </thead>
        <tbody>
          <tr v-for="status in sortedStatuses" :key="status.dealStatus">
            <td>
              <strong>{{ getDealStatusDescription(status.dealStatus) }}</strong>
            </td>
            <td class="text-right">{{ status.count }}</td>
            <td class="text-right">{{ formatCurrency(status.averageDealValue) }}</td>
            <td class="text-right">{{ formatCurrency(status.totalDealValue) }}</td>
            <td class="text-right">{{ formatCurrency(status.maxDealValue) }}</td>
            <td class="text-right">{{ formatCurrency(status.minDealValue) }}</td>
            <td class="text-right">{{ status.averageAge.toFixed(2) }}</td>
            <td class="text-right">{{ status.maxAge }}</td>
            <td class="text-right">{{ status.minAge }}</td>
          </tr>
        </tbody>
      </table>
    </div>
  </div>
</template>

<script>
import { ref, onMounted, computed, watch, nextTick } from "vue";
import { getSalesFunnelSummary } from "@/services/leadService";
import { Chart, registerables } from "chart.js";
import SortableHeader from "@/components/SortableHeader.vue";

// Register Chart.js components
Chart.register(...registerables);

export default {
  name: "SalesFunnelSummary",
  components: {
    SortableHeader,
  },
  setup() {
    const summary = ref(null);
    const loading = ref(true);
    const error = ref(null);
    const chartCanvas = ref(null);
    let chart = null;

    // Add sort state variables
    const sortField = ref("dealStatus");
    const sortDirection = ref("asc");

    const fetchSalesFunnelSummary = async () => {
      try {
        const response = await getSalesFunnelSummary();
        if (response.success) {
          summary.value = response;
        } else {
          error.value = response.failureInformation || "Failed to fetch
                                                    || sales funnel summary";
        }
      } catch (err) {
        error.value = "Failed to fetch sales funnel summary";
      } finally {
        loading.value = false;
      }
    };

    const getDealStatusDescription = (dealStatus) => {
      const statusMap = {
        0: "Unknown",
        1: "Initial Discussion",
        2: "Serious Discussion",
        3: "Contract Discussion",
        4: "Closed (Won)",
        5: "Closed (Lost)",
        6: "Closed (Abandoned)",
      };
      return statusMap[dealStatus] || `Status ${dealStatus}`;
    };

    const formatCurrency = (value) => {
      return new Intl.NumberFormat("en-US", {
        style: "currency",
        currency: "USD",
      }).format(value || 0);
    };

    // Computed property for filtered funnel stages
    const funnelStages = computed(() => {
      if (!summary.value || !summary.value.byDealStatus) return [];

      // Filter out "Unknown" (0) and "Closed Lost" (5)
      return summary.value.byDealStatus.filter((status) =>
        ![0, 5].includes(status.dealStatus)).sort((a, b) =>
          a.dealStatus - b.dealStatus);
    });

    // Add computed property for sorted statuses
    const sortedStatuses = computed(() => {
      if (!summary.value || !summary.value.byDealStatus) return [];

      return [...summary.value.byDealStatus].sort((a, b) => {
        let aValue, bValue;

        if (sortField.value === "dealStatus") {
          aValue = a.dealStatus;
          bValue = b.dealStatus;
        } else {
          aValue = a[sortField.value];
          bValue = b[sortField.value];
        }

        if (sortDirection.value === "asc") {
          return aValue - bValue;
        } else {
          return bValue - aValue;
        }
      });
    });

    // Add sort toggle function
    const toggleSort = (field) => {
      if (sortField.value === field) {
        // Toggle direction if clicking the same field
        sortDirection.value = sortDirection.value === "asc" ? "desc" : "asc";
      } else {
        // Set new field and default to ascending
        sortField.value = field;
        sortDirection.value = "asc";
      }
    };

    // Render the Chart.js chart
    const renderChart = () => {
      if (!chartCanvas.value || !funnelStages.value.length) return;

      // Destroy existing chart if it exists
      if (chart) {
        chart.destroy();
      }

      const ctx = chartCanvas.value.getContext("2d");

      // Prepare data for chart
      const labels = funnelStages.value.map((stage) =>
        getDealStatusDescription(stage.dealStatus));
      const counts = funnelStages.value.map((stage) => stage.count);

      // Color palette for chart bars
      const colors = ["rgba(52, 152, 219, 0.8)", "rgba(46, 134, 193, 0.8)",
        "rgba(40, 116, 166, 0.8)", "rgba(33, 97, 140, 0.8)",
        "rgba(26, 82, 118, 0.8)"];

      const borderColors = ["rgb(52, 152, 219)", "rgb(46, 134, 193)",
        "rgb(40, 116, 166)", "rgb(33, 97, 140)", "rgb(26, 82, 118)"];

      // Create the chart
      chart = new Chart(ctx, {
        type: "bar",
        data: {
          labels: labels,
          datasets: [
            {
              label: "Number of Deals",
              data: counts,
              backgroundColor: colors,
              borderColor: borderColors,
              borderWidth: 1,
            },
          ],
        },
        options: {
          indexAxis: "y", // Horizontal bar chart
          responsive: true,
          maintainAspectRatio: false,
          plugins: {
            tooltip: {
              callbacks: {
                label: (context) => {
                  const index = context.dataIndex;
                  const stage = funnelStages.value[index];
                  return `Count: ${stage.count} deals`;
                },
                afterLabel: (context) => {
                  const index = context.dataIndex;
                  const stage = funnelStages.value[index];
                  return [`Total: ${formatCurrency(stage.totalDealValue)}`,
                  `Avg Age: ${stage.averageAge.toFixed(1)} days`];
                },
              },
            },
            legend: {
              display: false, // Hide legend
            },
          },
          scales: {
            x: {
              beginAtZero: true,
              title: {
                display: true,
                text: "Number of Deals",
              },
            },
            y: {
              title: {
                display: true,
                text: "Pipeline Stage",
              },
            },
          },
        },
      });
    };

    onMounted(() => {
      fetchSalesFunnelSummary();
    });

    // Watch for changes to render chart when data is loaded
    watch(summary, () => {
      nextTick(() => {
        renderChart();
      });
    });

    return {
      summary,
      loading,
      error,
      chartCanvas,
      getDealStatusDescription,
      formatCurrency,
      funnelStages,
      // Add new properties to the return object
      sortField,
      sortDirection,
      sortedStatuses,
      toggleSort,
    };
  },
};
</script>

<style scoped>
.summary-table th {
  width: fit-content;
  text-align: right;
}

.summary-table td {
  padding-left: 10px;
}

.detail-table th {
  text-align: right;
  padding-right: 15px;
  width: fit-content;
}

.detail-table td {
  text-align: right;
  padding-right: 16px;
  width: fit-content;
}

/* Chart Container */
.chart-container {
  height: 400px;
  max-width: 900px;
  margin: 25px auto;
  padding: 15px;
  background-color: #f8f9fa;
  border-radius: 8px;
  box-shadow: 0 2px 4px rgba(0, 0, 0, 0.05);
}

h2 {
  margin-top: 30px;
  margin-bottom: 15px;
  font-size: 150%;
  text-align: center;
}

h1 {
  font-size: 175%;
  padding-top: 2%;
  text-align: center;
}
</style>
Back to main article
blogs\uiai4\uiai4.md