


Power BI is a powerful business analytics tool that allows users to visualize and analyze data from a wide range of sources. With its seamless integration with the Power Platform, Power BI can be used to create interactive reports and dashboards that provide valuable insights into your business data. This article explores seven ways in which Power BI can be integrated with other tools in the Power Platform to enhance its capabilities and provide even more value to your business:
- Refreshing on a schedule with Power Automate
- Refreshing on change with Power Automate
- Real-time reporting with Dataverse
- Writeback using the Power Apps visual
- Real-time survey results with Power Automate and Microsoft Forms
- Alerting with dashboards and Power Automate
- Data-driven subscriptions with Power Automate
Refreshing on a Schedule With Power Automate
Power BI reports run their queries against Power BI datasets. A dataset typically contains a cache of data that is pulled from any number of sources. The cached data is stored in a highly optimized fashion that allows for analytical queries to be processed with blazing speed. The data cached in the dataset becomes stale over time. This is known as data latency. It is therefore necessary to refresh these datasets on a periodic basis.
You can set up a schedule in the Power BI service to periodically refresh the dataset. Depending on your licensing model, you can perform up to 8 or 48 refreshes per day, but if you own any form of Power BI Premium capacity (a “premium license”) that limitation is for the user interface only.
Refreshes can be triggered through the Power BI API at any time. Power Automate has a dataset refresh action that can also be called at any time. If you are not running in a Premium capacity, you are still limited to 8 refreshes per day, but if you do have a Premium license, then your only limitation is refresh speed. Since a Power Automate flow can be scheduled, this gives you complete control over your refresh schedule.
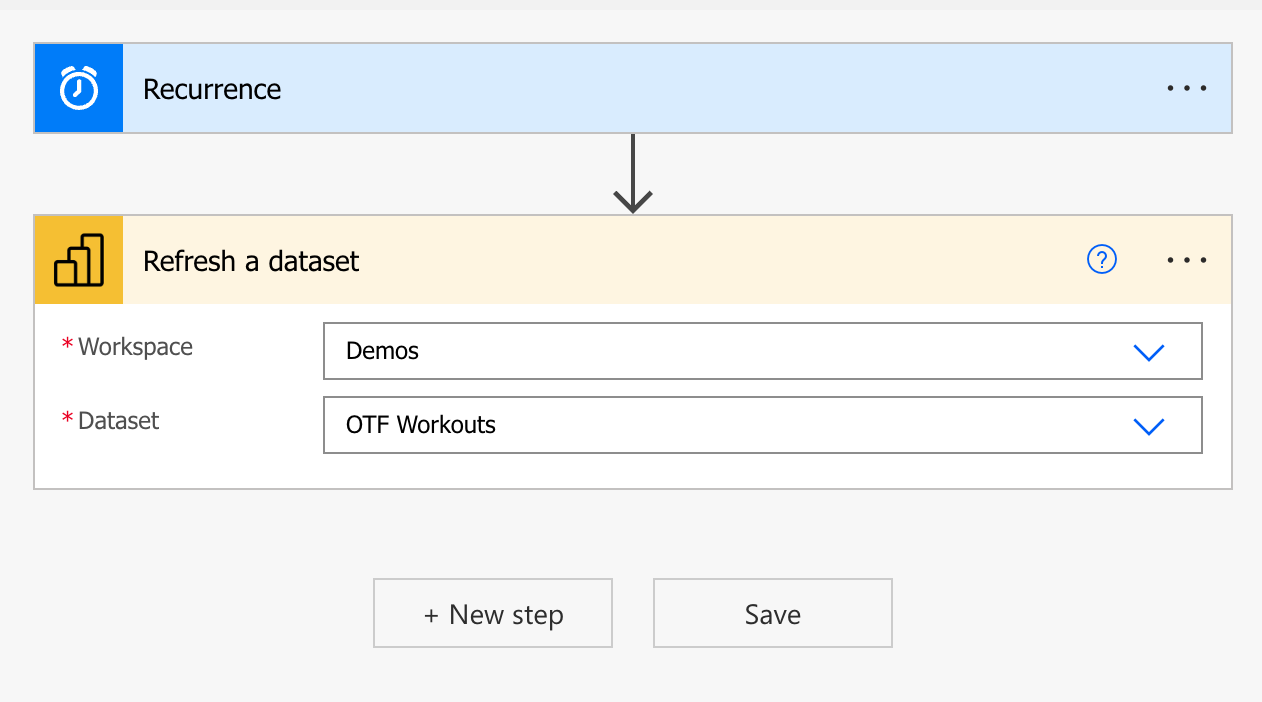
To configure a scheduled refresh flow as seen in Figure 1, follow these steps:
- Navigate to Power Automate and sign in.
- Go to My Flows, then choose + New flow, and select Scheduled cloud flow from the dropdown.
- Choose a starting time and a repeat interval. The repeat interval will be based on the starting time.
- Add the Refresh a dataset action and set the workspace and dataset to be refreshed.
- Save.
The recurrence trigger can be configured down to a one-second granularity and can be set to run from a specific time. If it is set to run every 15 minutes, beginning at 12:05, the target dataset will be refreshed 96 times per day (exceeding the supposed 48 refresh limit) and will run at five, 20, 35, and 50 minutes past the hour.
You can realize several benefits by controlling your own refresh schedule. The first and most obvious benefit is that you can refresh more than 48 times per day. When refreshing frequently, you need to consider the overall refresh time. If your refresh takes one hour, and you schedule refreshes every half an hour, you'll have trouble.
When refreshing frequently, you need to consider the overall refresh time. If your refresh takes one hour, and you schedule refreshes every half an hour, you'll have trouble.
If you've ever needed to configure a dataset for frequent refresh using the Power BI user interface, you'll know how inconvenient it is. Each time slot for refresh has three drop-down fields to configure - one for the hour, one for the minute (00 or 30) and one for AM/PM. Configuring a refresh for every half an hour throughout the day requires setting 48x3 = 144 different fields. Setting a single interval of 30 minutes is much simpler.
Finally, and possibly most importantly, starting many refreshes at the same time can demand a significant number of resources. If you are running on a Premium capacity, those resources are finite, and this can result in a degradation of performance overall. In addition, if the same data source is being targeted by multiple refreshes, this can place a significant load on the data source itself. If a group of datasets need to be refreshed hourly, it may be better to stagger the refresh start times over the course of the hour instead of launching them all simultaneously at the bottom or top of the hour.
Refreshing on Change With Power Automate
Microsoft Lists are commonly used to contain non-relational list-based data. Power BI has some very powerful connectors for working with these lists, in particular the SharePoint Online List data source. Using Power Query, the possibilities are almost endless for list reporting options. The Power BI web part means that the reports can be embedded directly in a SharePoint page, and report tabs allow these reports to be embedded directly into Teams alongside the list itself.
This visibility and ease of access really helps with data insights, but it does introduce a significant usability problem. Inevitably, a user will add or edit an item in that list and then open the report to see the effect of their edits. Unless that user was extremely lucky and saved their change immediately before a refresh cycle, they will not see their changes reflected in the report. It is necessary to wait until the next refresh.
Of course, the user can initiate a manual refresh themselves from the Power BI user interface, but a much more elegant solution is to have the edit itself trigger the refresh. For this, we can turn once again to Power Automate and then Refresh a dataset activity. However, this time, instead of using the Recurrence trigger, we'll start the flow when the list item changes.
To configure an event-driven flow as seen in Figure 1, follow these steps:
- Navigate to Power Automate and sign in.
- Go to My Flows, then choose + New flow, and select Automated cloud flow from the dropdown.
- Give the flow a name and enter SharePoint in the search field.
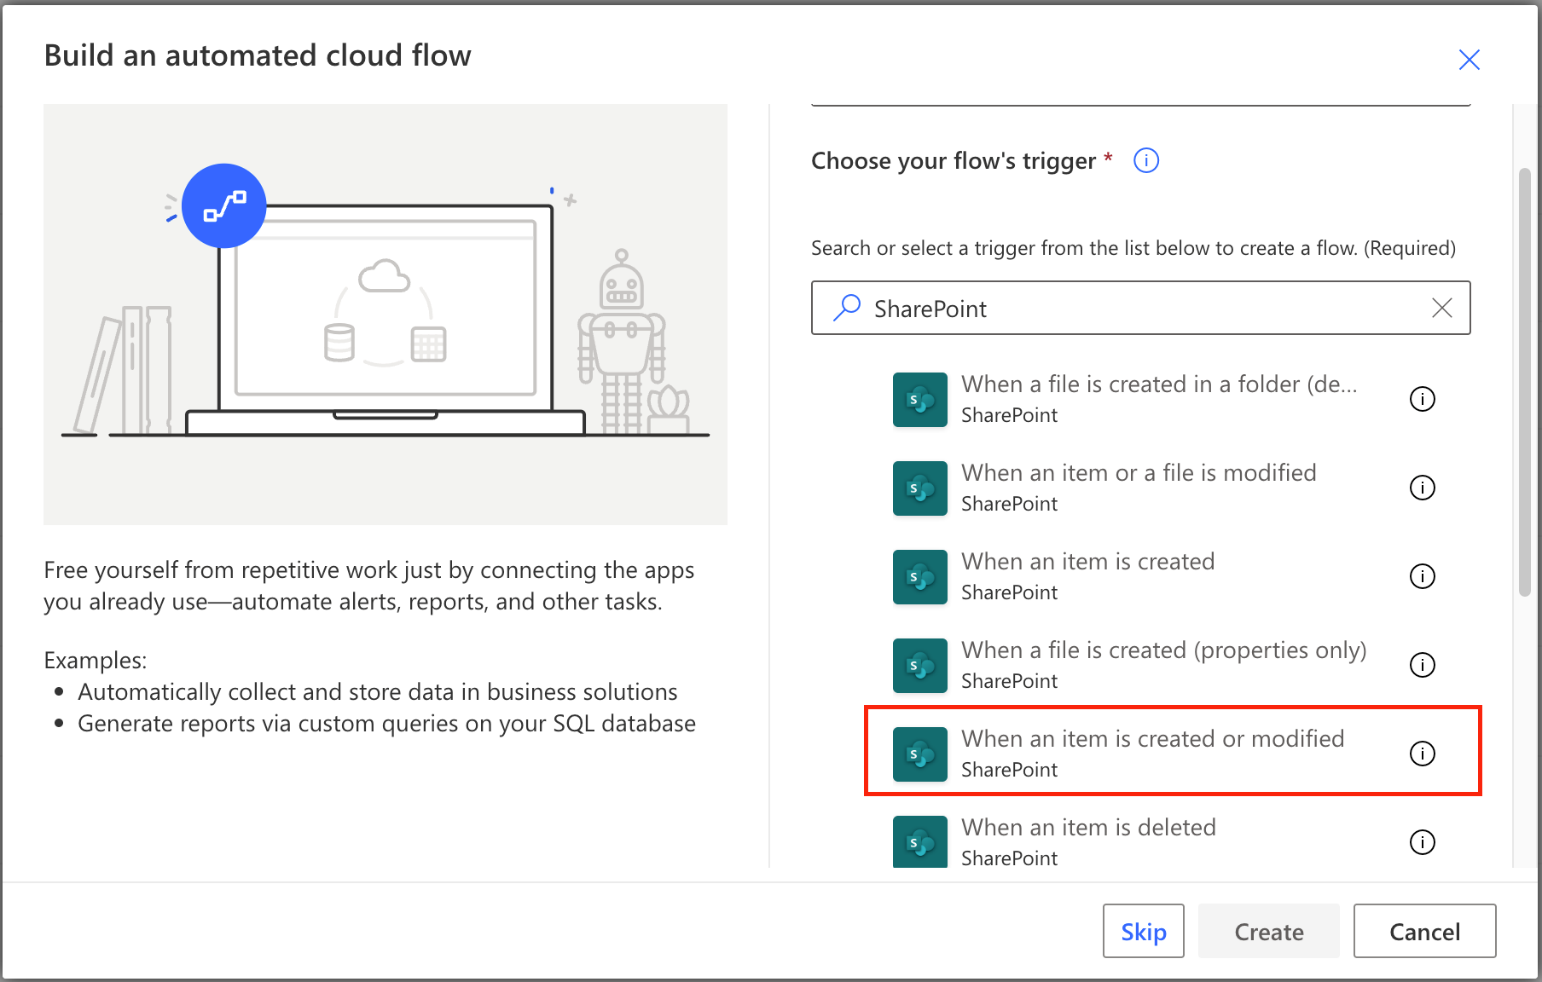
- Scroll down and select the When an item is created or modified action (Figure 2).
- Click Create.
- Select the site that contains the list, then select the list from the drop-down menus.
- Add the Refresh a dataset action and set the workspace and dataset to be refreshed.
- Save.
Once activated, whenever a new item is added, or an existing item is edited, the targeted dataset will be refreshed. As with the scheduled refresh option above, this will not override license limitations. If your dataset is not connected to a Premium capacity, you will still be limited to eight refreshes per day. If your list is relatively static, then this may be acceptable but otherwise, a Premium capacity is strongly recommended.
See the sidebar, Using Power BI Datasets Using Copilot" at at the end of this article.
You should also keep in mind that a refresh is not instantaneous. Refresh normally requires at least a few minutes to complete, so if users immediately navigate to the corresponding report, they will likely not see their changes for a few minutes. Finally, it should be noted that dataset refresh is not the same as report refresh. Once the dataset has updated, a report on screen will still need to be refreshed to reload the changes.
Real-time Reporting With Dataverse
As mentioned above, Power BI reports query a cache of data that is loaded from a data source and periodically needs to be refreshed. Using this model there is always some amount of data latency, which is the time required for a data change on the source system to be reflected in the report. True real-time reporting has no tolerance for data latency, and, to support that, Power BI has a data access mode known as DirectQuery.
When you construct a dataset in Power BI, you use Power Query. Power Query is a powerful tool for connecting to data sources and transforming data. You use Power Query to perform several steps to transform data into the shape that you need. When your Power Query uses DirectQuery to connect to the data source, the data is not cached in the dataset. Instead, the Power Query steps are converted into the native query language of the source and executed there.
DirectQuery has the benefit of eliminating data latency, but it does come at a cost. Not all Power Query steps can be turned into native query languages, and you are limited to using the ones that can be converted. An obvious limitation is that the data source must have a native query language. This is true of databases, but is not true of many data sources, like CSV, JSON files, and, unfortunately, Microsoft Lists.
Microsoft Dataverse provides another low-code alternative for storing data. Dataverse lets you securely store and manage data within a set of tables and includes a base set of standard tables that cover typical scenarios, but you can also create custom tables specific to your purpose. Dataverse provides the storage layer for Power Apps and CRM and is easily accessed from Power BI.
One significant difference between Dataverse and Microsoft Lists is that Dataverse is a database with a native query engine. In fact, the engine is the Microsoft SQL engine complete with its query language. It is therefore possible to report on Dataverse data in real time using DirectQuery.
To create a Power BI report connected to Dataverse in DirectQuery mode, follow these steps:
- Open Power BI Desktop.
- Select Get data, Power Platform, and then Dataverse. Click the Connect button.
- Sign in if necessary and click the Connect button.
- You will be presented with a folder for each of your Dataverse environments. Open the one that contains your data.
- Select the tables that will be needed in your report. Click the Transform Data button when all tables have been selected.
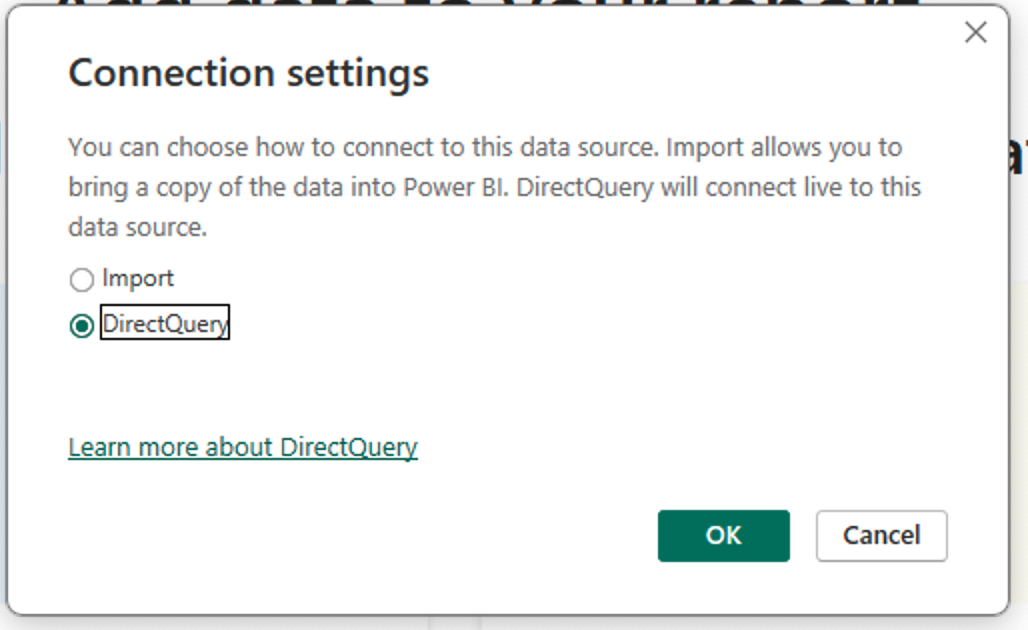
- Select DirectQuery (see Figure 3).
- Build your report.
Since DirectQuery does not cache any data, it is not necessary to refresh the dataset. Every time the report is loaded, new queries will run against Dataverse. It's important to note, however, that data changes are not pushed to the report interface, and the visuals are only updated when the report is reloaded. Power BI DirectQuery reports can utilize a feature called “Automatic Page Refresh” to refresh the report visuals. This is particularly useful for non-interactive reports running in a “kiosk” mode.
More detail on Automatic Page Refresh in Power BI can be found here: https://learn.microsoft.com/en-us/power-bi/create-reports/desktop-automatic-page-refresh.
Writeback Using the Power Apps Visual
Power BI datasets are read-only, period. Whether or not it's running in import or DirectQuery mode, the data only flows one way. This is obviously a limitation when changes need to be performed on the data. Normally, it requires a user to log into the source data system, make the changes, and then either initiate, or wait for a data refresh. Taking the user out of their flow in this manner is a real problem when a user wants to perform a “what if” sort of analysis. The budgeting process is a perfect example of such a scenario.
Happily, Power Platform has this scenario covered. The Power Apps visual allows for a Power App to be bound to a Power BI dataset and displayed as a visual within the Power BI report itself. The fact that this visual surfaces a full Power Apps app, means that it can take advantage of the full breadth of Power App capabilities, including connecting to the source data and performing full Create, Read, Update, and Delete (CRUD) capabilities.
To begin, the Power Apps visual must be added to the report from the Power BI service, NOT in Power BI Desktop. The dataset should also be as near to complete as possible, as it will be used as the jumping off point for the Power App. Open your report in edit mode in the Power BI service. Open the visuals pane, locate the Power App visual icon (A in Figure 4) and add it to the canvas. You will immediately be prompted to choose an environment (B) and to indicate whether this dataset will be bound to an existing Power App or used to create a new one (C). If it is only for the purposes of the report, you will likely want to create a new one.
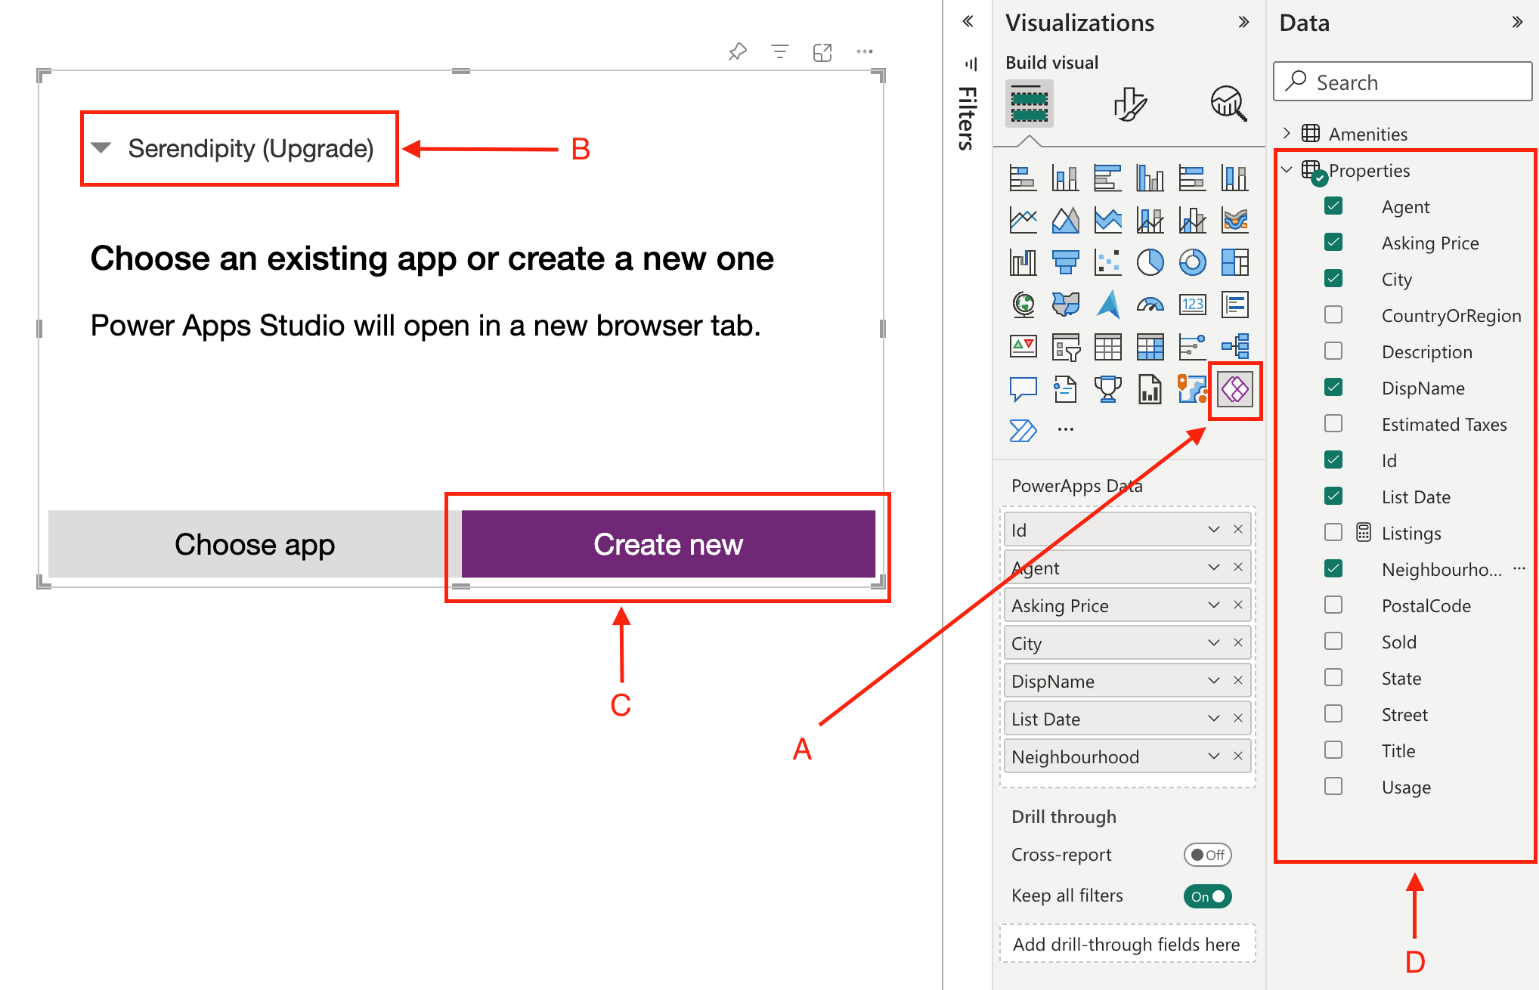
Before making your choice, be sure to select all the fields that you will want to utilize in the app (D). At the very least, you must select a unique identifier to be able to write updates back to the source. Once ready, click the Create new button (C), and the Power Apps studio will be loaded in a browser window. Skip the initial dialog screen, as an initial gallery is created for you, and bound to the PowerBIIntegration object as can be seen in the Items binding for the control. This object is the link back to the Power BI dataset.
The gallery displays the value of the first field in the list, but other layouts can be chosen from the Layout property of the gallery and different fields can be displayed by changing the binding of the relevant gallery item or adding new ones. This is a Power App; you can do other things like adding a screen title.
When ready, save the app and give it a name. When you navigate back to your Power BI report, you should see the app loaded within the visual. The contents of the visual will be filtered according to the overall filter context of the page. If all you want is to use Power Apps as a custom visual editor, no more action is required. In this article, I am aiming to do more, so further changes are necessary. To edit the Power App, first select the visual, then select the ellipsis in the upper right corner and click Edit. The Power App studio will again be loaded.
As mentioned above, the Power BI dataset is read only. What you need to do is to connect the Power App back to the original data source and build some edit controls.
First, you add the data source by selecting the data icon from the left rail of the designer, then click the Add data button. Next, if your connector is not already there, you need to create a new one. In this case, the source data is a SharePoint list, so you'll enter SharePoint in the search box and either select an existing connection or create a new one. Each connector will have different parameters to complete, but for the SharePoint list, you'll select the site and the list, and then click Create. The new connector will appear in the data list.
Next, you need to create the edit screen that can be bound to the data source. To do that, navigate back to the Power App tree view (Figure 5), select + New screen, click the Templates tab, and select Form.
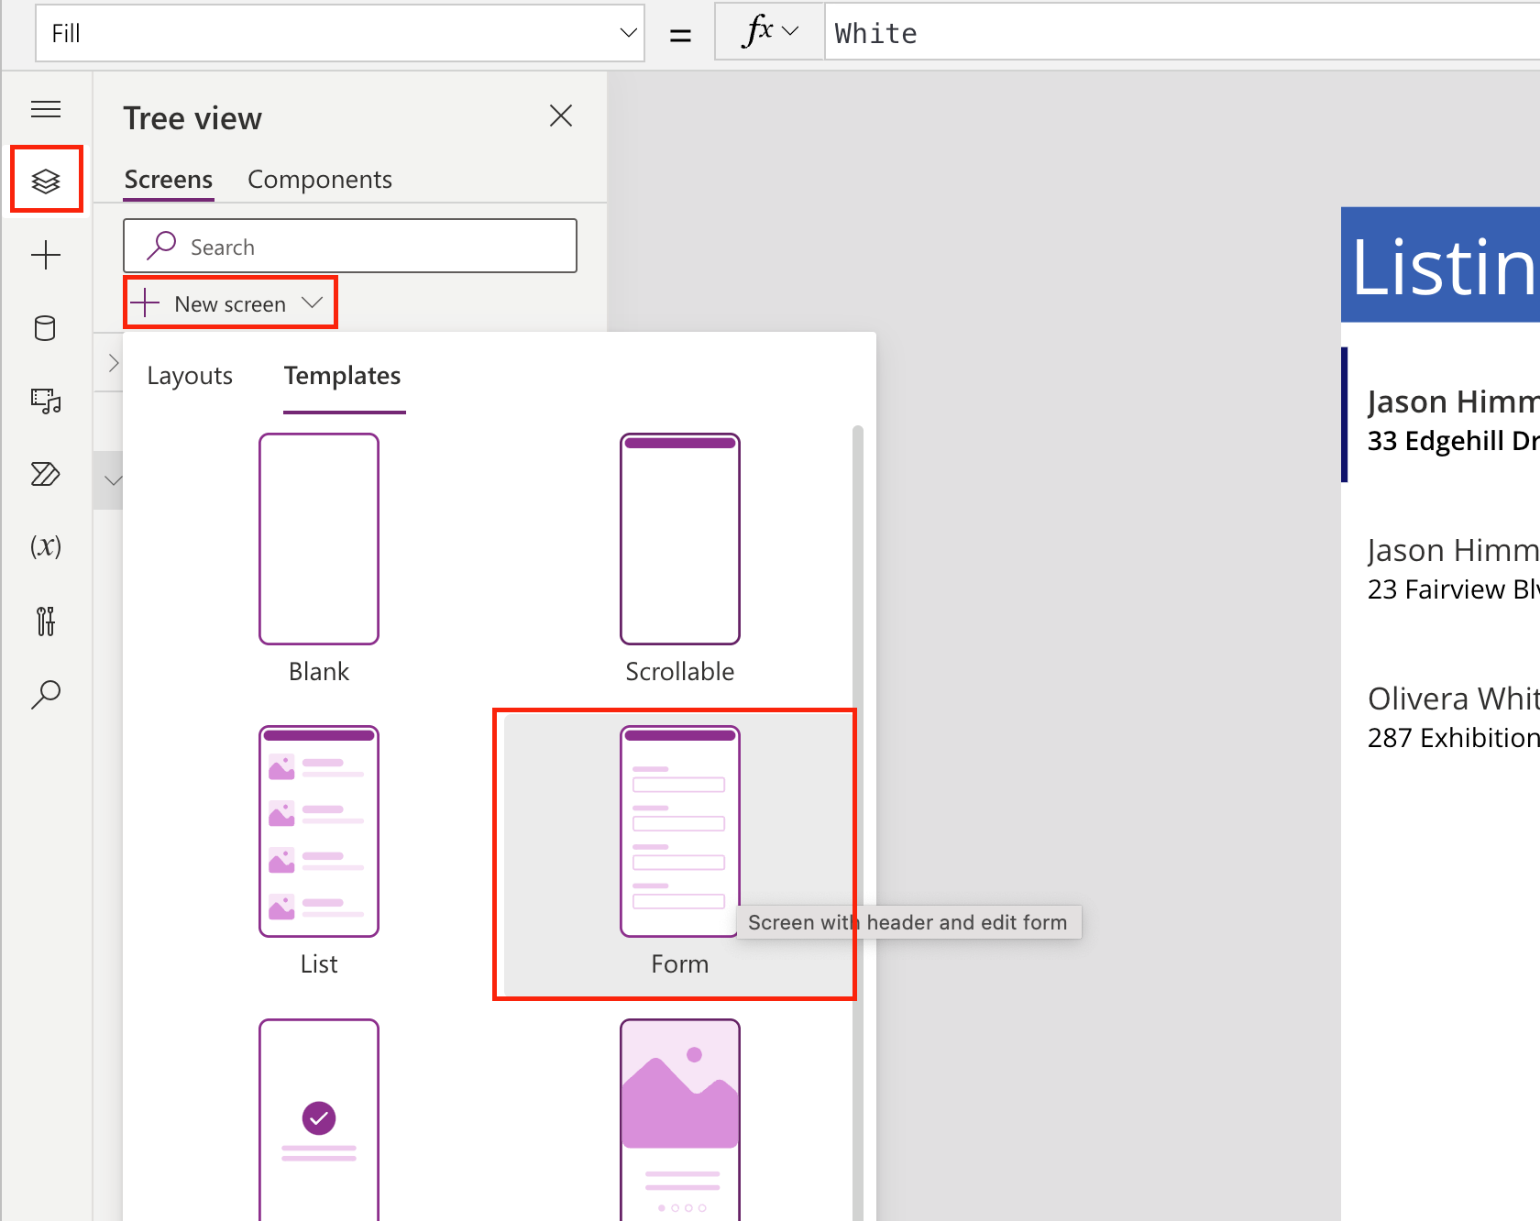
Once created, give the form a name, and connect the new form to the data source by setting the Data source property of the form. Now that it's bound to the data source, you will notice that all the source fields are added to the form. If that's not wanted, it's a good idea to remove any fields that won't be used.
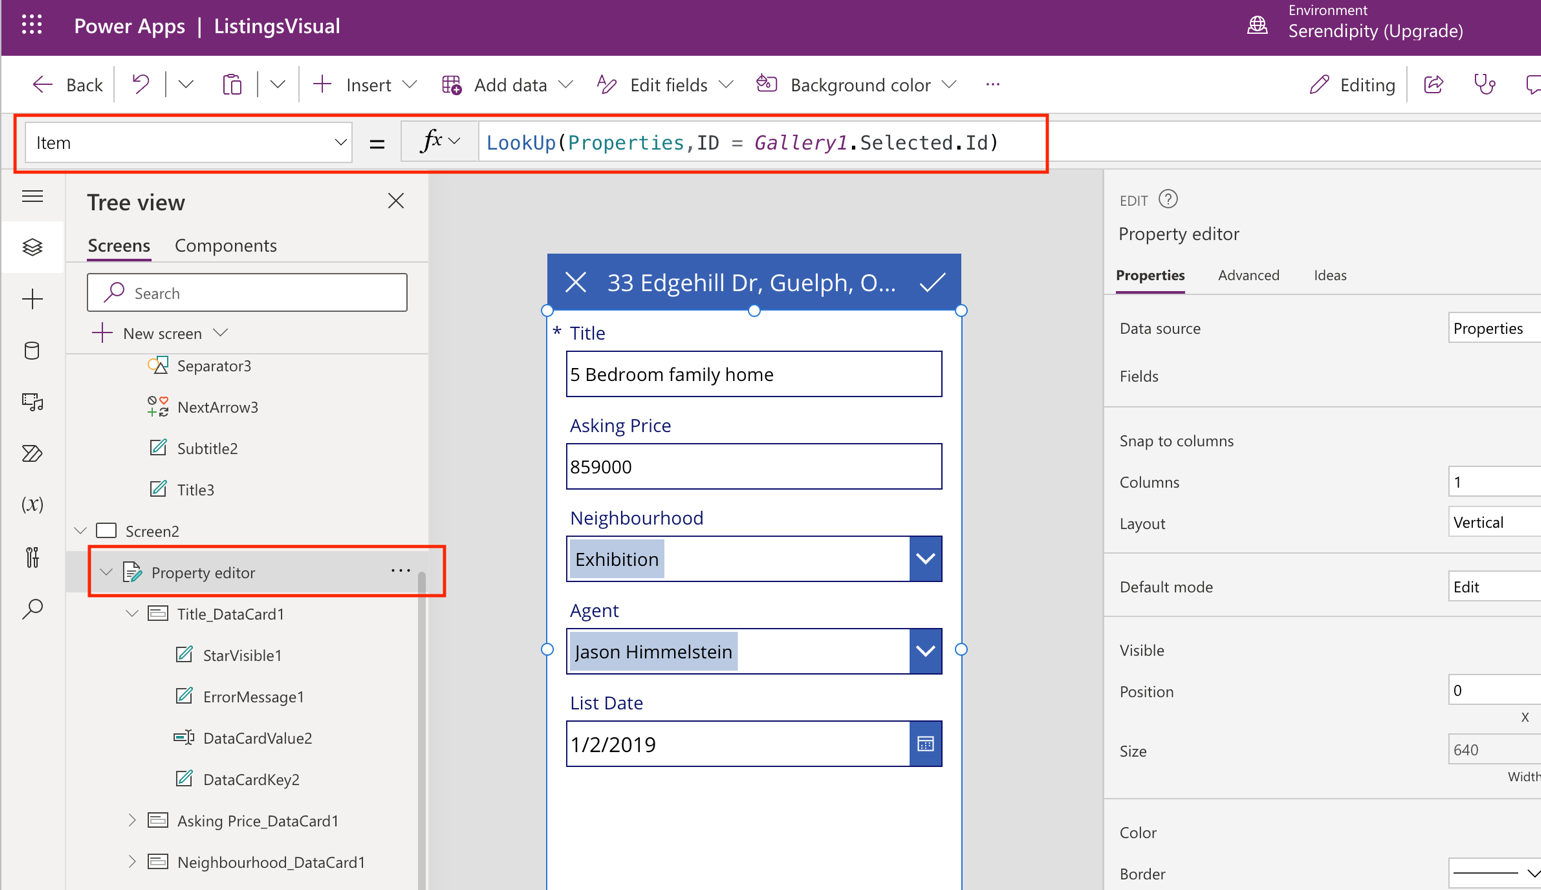
Now you have two screens, each bound to a different data source: one to the Power BI dataset, and the other to the original data source. It is necessary to join them together. The form screen has an Item property, and you want to set that to the source item. To do that, you set its value by calling the Lookup function and looking up the source item with the same ID as the currently selected item in the gallery (Figure 6).
At this point, the form will write any changes back to the data source whenever the checkbox is clicked. To complete the picture, you should set the OnSuccess and the OnFailure properties of the form to the following values:
OnSuccess:  Notify("Update succeeded", NotificationType.Success,2000);
    Navigate(Screen1);
OnFailure: Notify("Update failed", NotificationType.Failure,2000);
    Navigate(Screen1);
In both cases, upon submission, the user will be presented with a status message, and then returned to the original form with the gallery of data. Finally, set the OnSelect property of the Cancel icon to navigate back to the first form:
Navigate(Screen1)
It should now be possible to make changes directly from the Power App visual in the Power BI report. There is, however, an important caveat to keep in mind. When the source data is updated, the import dataset is not automatically refreshed. This means that if the data item edit is displayed in the visual, the new value is not immediately reflected in the dataset. This is not an issue if display items cannot be edited, but it is if they can.
If it is necessary to keep these values in sync, there are several strategies that can be adopted. A Power Automate flow can be launched to refresh the dataset, or a refresh can be launched directly from Power Apps using the PowerBI.Refresh command. As discussed above, refreshes themselves take some time, so if data must always be up to date, it's a good idea to use a DirectQuery report with the Power Apps visual, which means that the data needs to be in a source that supports it, like Dataverse, as opposed to one that doesn't, like SharePoint lists.
Real-time Survey Results With Power Automate and Microsoft Forms
Microsoft Forms is a simple, low-code way to collect data from both internal and anonymous sources. It offers a simple canvas for forms design and can be published anonymously for distribution to a wide audience. Reporting on forms data can be challenging though. The product offers its own summary reports, which don't allow for much detailed analysis. Raw data can be downloaded into Excel but that must be done interactively as a manual process. Unfortunately, there is no Power BI connector for Microsoft Forms.
There is a special type of dataset available in Power BI called a “push” dataset. Unlike most other datasets, data is pushed into it through the Power BI API, Azure Streaming Analytics, or from a Power Automate action. When a Power BI report is connected to a push dataset, and visuals from that report are pinned to a Power BI dashboard, the visuals on screen will update automatically without user interaction whenever the data changes. This is ideal for the kiosk scenario.
Power Automate can also be triggered when a new item is submitted to Microsoft Forms and can therefore be used as an intermediary between Microsoft Forms and Power BI. There are several steps required to get this up and running.
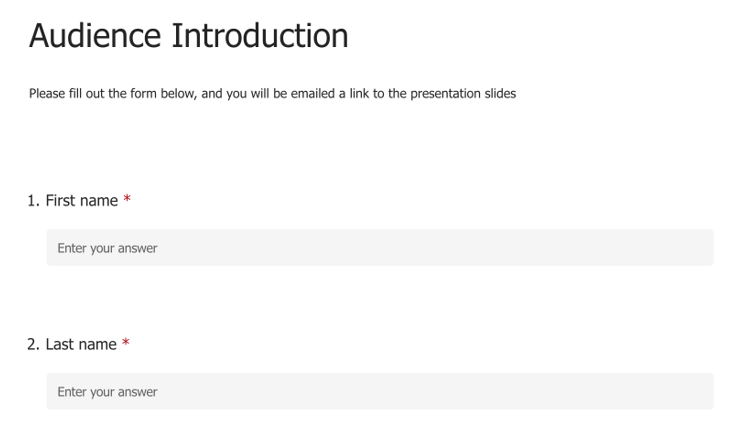
- Log in to Microsoft Forms and create your form (Figure 7). Make note of the fields used and their data types.
- Save and publish the form.
- Log in to Power BI and navigate to the workspace that will contain the dataset. From the New button, select Streaming dataset (a push dataset is a type of streaming dataset).
- Select API and click Next.
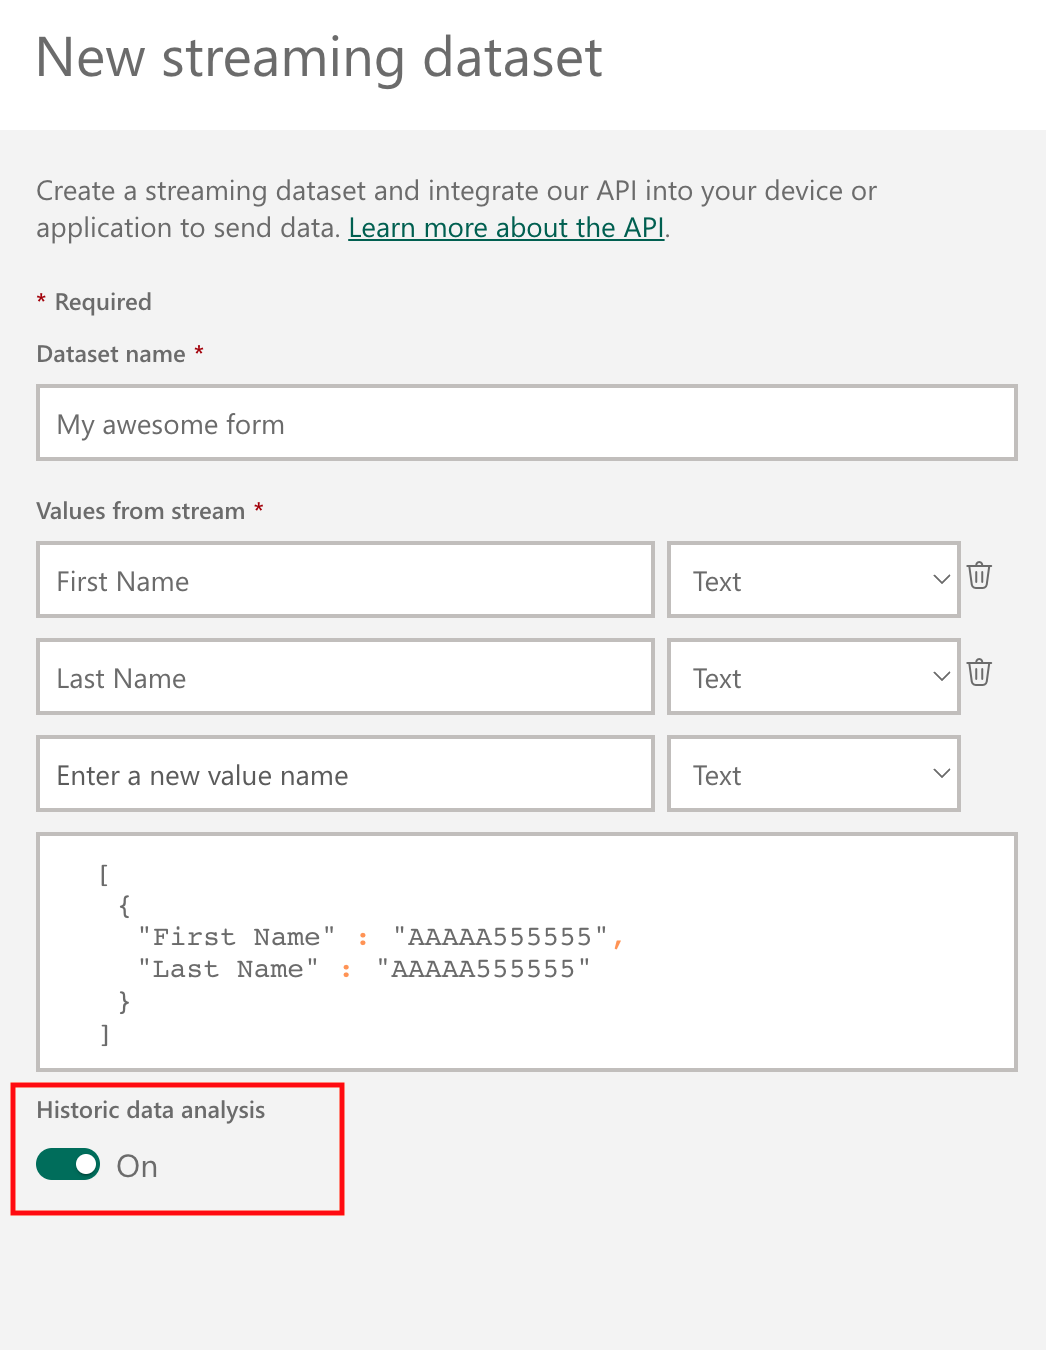
- Give the dataset a name, and then add the fields that you want to report on. These fields should correspond to the fields contained in your form. Each field can be a Text, Number, or DateTime field.
- As you add your fields, the dataset's definition will be built automatically as a block of JSON text.
- Turn on the Historic data analysis switch (Figure 8). This switch distinguishes a push dataset from a real-time streaming dataset. Data in the latter type is only stored for one hour.
- Save the dataset.
- Navigate to Power Automate and sign in.
- Go to My flows and click the +New flow button. Select Automated cloud flow.
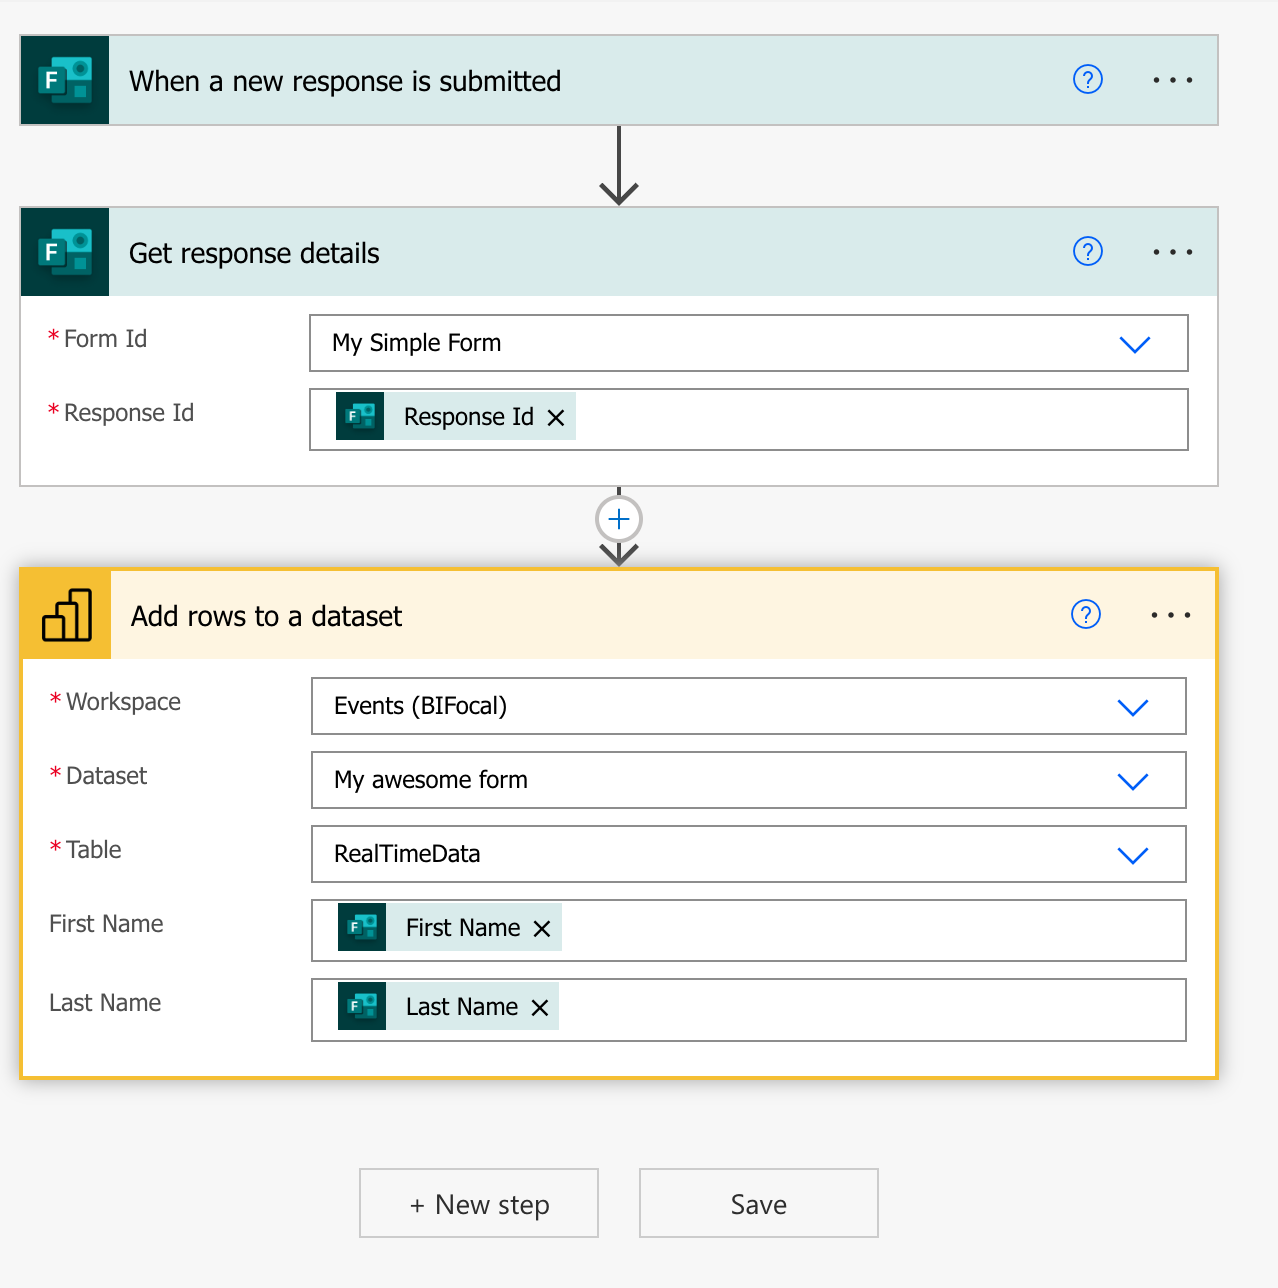
- Give the flow a name, then select the When a new response is submitted action from Microsoft Forms. Click Create.
- Pick your form from the Form Id dropdown.
- Click the New step button. Enter Microsoft Forms in the Search connectors and actions field, then select the Get Response Details action. Set the Form Id to your form name and the Response Id to the dynamic output Response Id of the trigger action (Figure 9).
- Click the New step button. Enter Power BI in the Search connectors and actions field, then select the Add rows to a dataset action.
- Select the Workspace and Dataset for your dataset. Select RealTimeData as the table name (the name will always be RealTimeData).
- Use the output values from the Get response details action to fill the values for the dataset fields.
- Save the flow.
At this point, the dataset will be populated with all form responses. Of course, you can use other flow actions at the same time, like emailing respondents an acknowledgement of receipt.
Once you have data flowing, you need to create a report, connect it to the dataset, publish it, and then pin your important visuals to a dashboard. These are the steps required to accomplish this.
- Log in to the Power BI service and select OneLake data hub from the left side panel.
- Locate the push dataset created above and select it.
- Click the + Create a report button from the toolbar. You can use auto create or choose to create the report manually.
- Save the report when ready. Ensure that it is saved to the same workspace as the dashboard is/will be.
- Click the Edit button in the toolbar.
- Select the visual to monitor by clicking. On it, click on the pin icon in the upper right-hand corner of the visual (Figure 10).
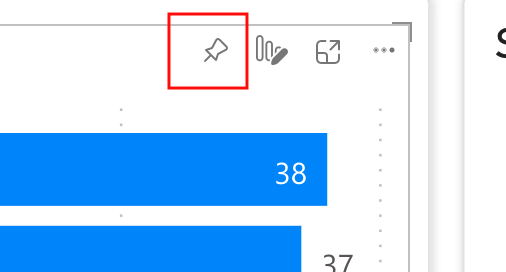
- Select an existing dashboard or create a new dashboard. Repeat for all required visuals.
- Navigate to the dashboard and make any required changes. The visuals on the dashboard will now update whenever someone fills out the form.
The visuals on the dashboard will update with no user interaction at all. This scenario can be useful when soliciting feedback from a relatively large group and gaining insights in real time.
Alerting With Dashboards and Power Automate
Dashboards can also be used for generating alerts in Power BI. You can configure an alert from a dashboard tile, and the alert will send notification emails when it is triggered. These alerts can also trigger a Power Automate flow when they are triggered. This allows for automated action to be taken based on Power BI measures. You must be using a gauge, KPI, or card tile to create an alert on a dashboard.
The following steps will allow you to create a Power Automate flow trigger for changing data:
- Navigate to a dashboard that contains a gauge, KPI, or card visual.
- Hover over the visual, click on the ellipsis, and select Manage alerts.
- Click the +Add alert rule button.
- Give the alert a title, then select a condition and threshold. The alert will fire after dataset refresh if the condition is met (Figure 11).
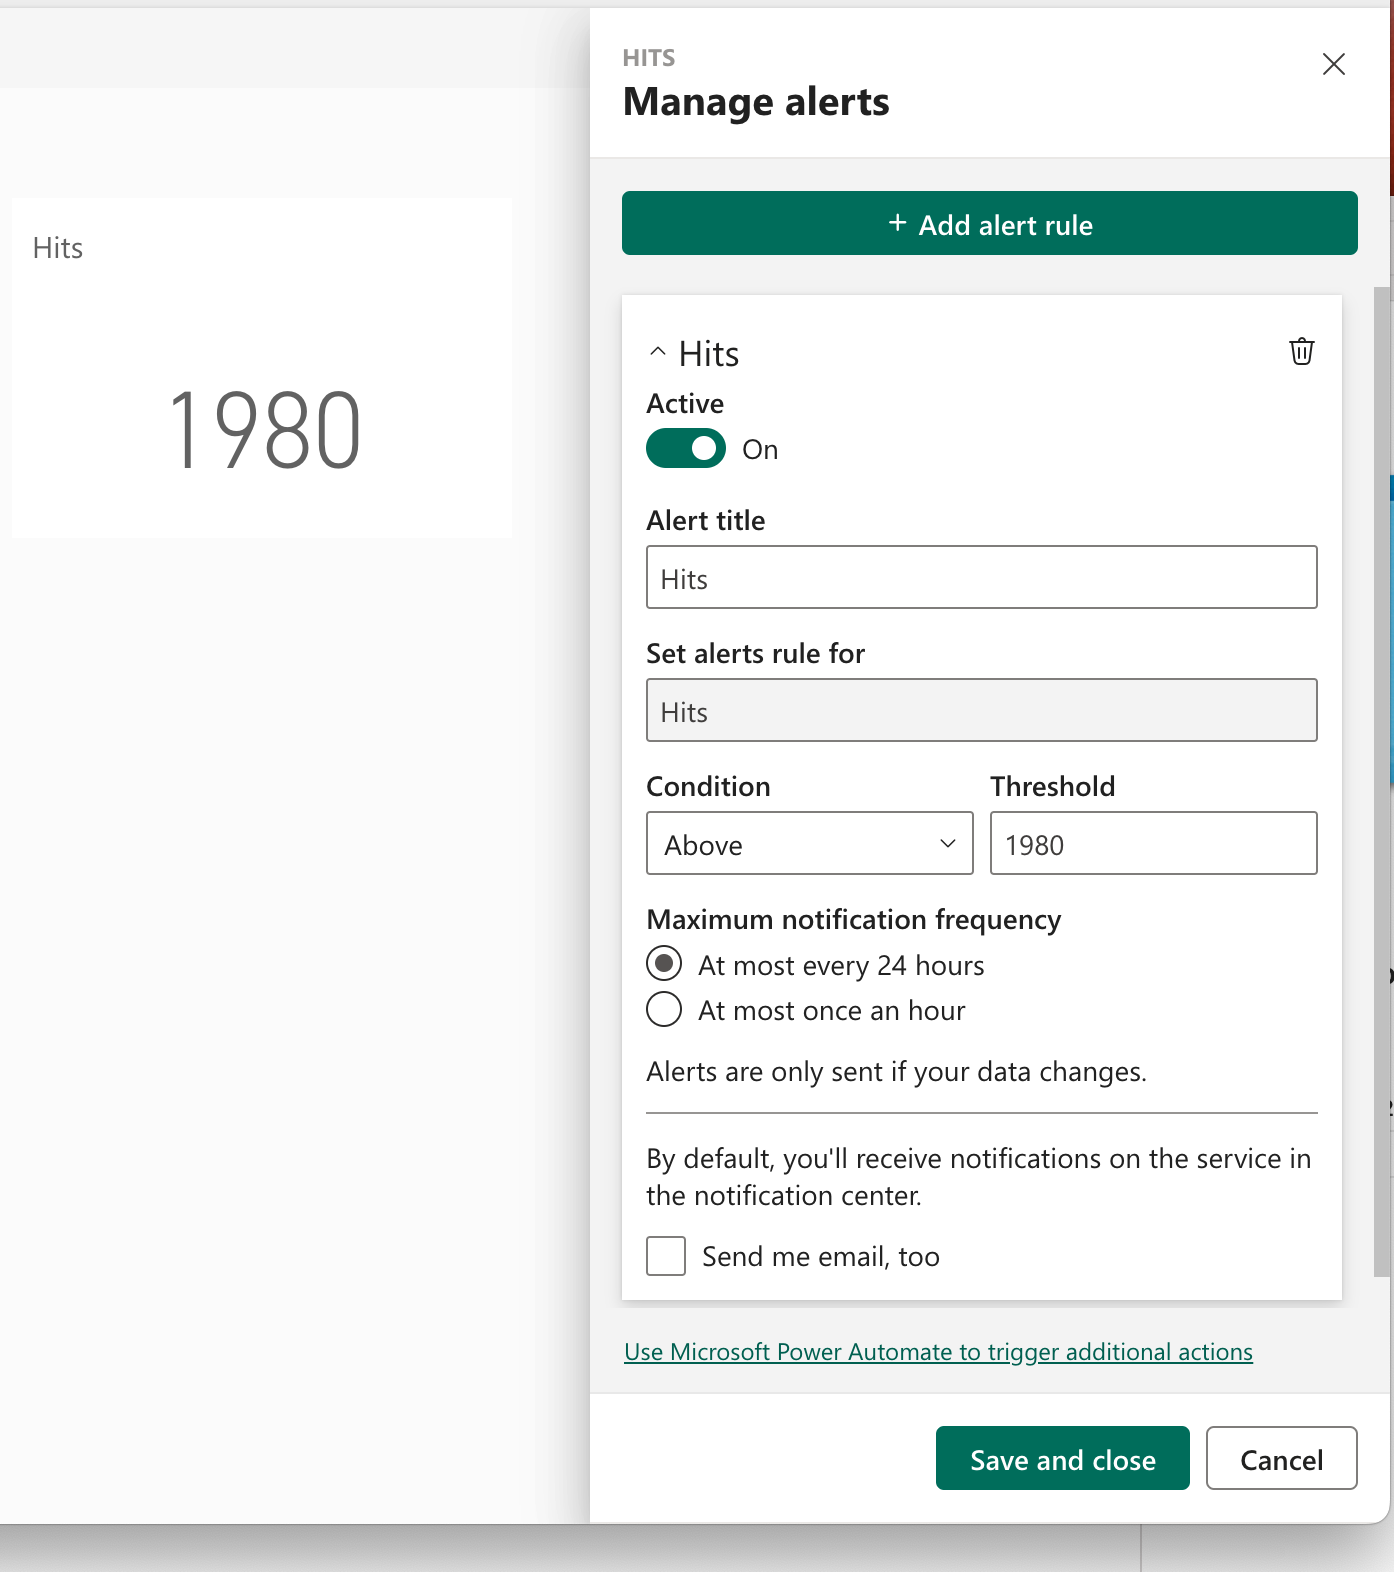
- If required, set the maximum alert frequency, and set the email option if you wish to receive emails when the alert fires.
- Click the Save and close button (do not click the Power Automate link at this point).
- Repeat step 2 to bring up the alert list, and select the alert created above.
- Click the link at the bottom of the panel Use Microsoft Power Automate to trigger additional actions. (Note: Power Automate requires the alert to be saved, which is why we need to reopen it.)
- Click the continue button.
- Select your alert from the dropdown and build your flow.
The flow will be triggered anytime the data changes and the configured threshold is reached. This change will be reflected on refresh, so you need to be aware of your refresh schedule. An alert can't be triggered more frequently than the refresh schedule.
Data-driven Subscriptions With Power Automate
Users can subscribe to Power BI reports through the Power BI user interface. Once subscribed, the user will receive an email containing an image of the report and, optionally, a PDF or PowerPoint attachment. These reports can be sent out as frequently as hourly or based on the data refresh schedule. A paginated report has significantly more options for the report format, and those additional outputs can contain data, which makes them searchable. You can also use parameters in the paginated report subscription, providing a way to subscribe to a single report multiple times to receive different content.
These subscriptions are targeted at individual users, or email addresses. It is possible for a user to manage their own subscriptions, but there is, at present, no way to centrally manage subscriptions across a tenant. Additionally, subscriptions can only be triggered according to a schedule, explicitly defined or aligned to the refresh schedule of a dataset. Power BI lacks a data-driven subscription feature.
Power Automate can, once again, fill in the blanks here, providing a platform to build your own data-driven subscription solution. The details of the solution will be unique to every circumstance, so I won't outline a step-by-step solution here, rather, outline the components and how they all fit together within the Power Automate flow. A traditional data-driven subscription system will run on a schedule, iterate through several subscription definitions, and deliver reports based on those definitions, so that is the model outlined here. However, it is totally feasible to use event-driven definitions, even combining them with the alert scenario outlined above for a more robust alerting scenario.
To begin, you will need a repository to store the subscription definitions. This repository can be in your location of choice. A good solution would be to build your subscription management solution using Power Apps and store the subscriptions themselves in Dataverse. Microsoft lists is also a good platform for this solution, as this is simple non-relational table-based data. A scheduled subscription should include, but is not limited to:
- Run frequency
- Report ID
- Report type
- Destination information
- Status
When the scheduled flow runs, it queries the subscription table and iterates through each subscription. The run frequency, or data derived from the run frequency, is used to determine whether each definition is to be executed. If so, the flow continues along a path determined by the subscription definition. There are two important definition elements that should be used to determine the path, report type, and destination.
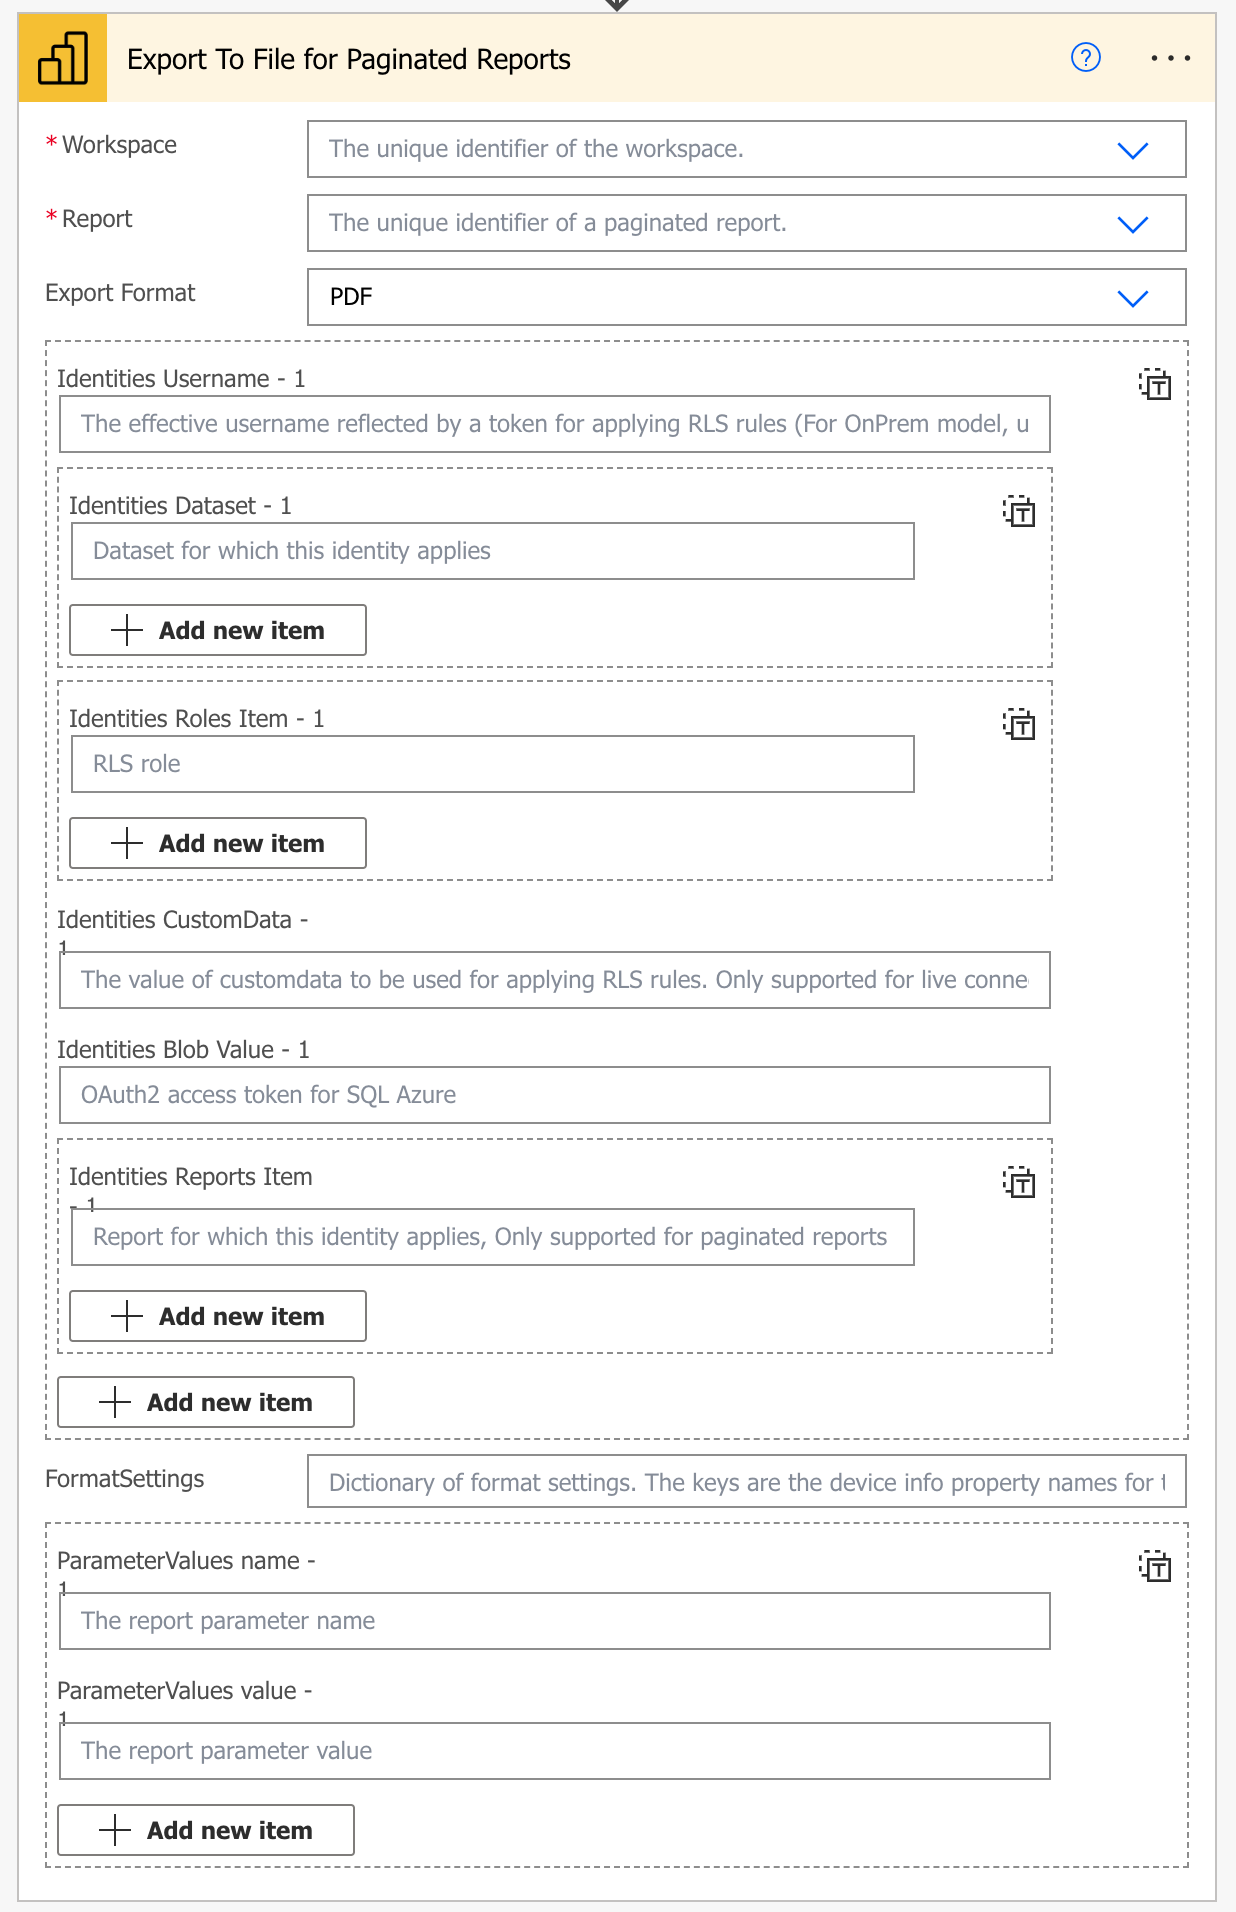
Power Automate has two different activities for rendering reports: Export to File for Power BI Reports and Export to File for Paginated Reports. There are a lot of items to control within each of these activities that I won't go into here, but you can find a complete description at https://learn.microsoft.com/en-us/power-bi/collaborate-share/service-automate-power-bi-report-export and https://learn.microsoft.com/en-us/power-bi/collaborate-share/service-automate-paginated-integration. The choice of activity obviously depends on the type of report, but it is important to note that they are different. For example, the export activity for paginated reports (Figure 12) supports report parameters, so the parameter values could be retrieved from the subscription configuration or retrieved by the flow some other way to tailor the output of the report.
Once the report is rendered, it must be delivered to the destination. Subscriptions within Power BI deliver reports to emails. Power Automate supports this through several email actions, including the ability to mail to groups, but all sorts of other destinations are also possible. A good choice is to deliver the report to a SharePoint document library and then optionally send a link to the subscription recipients. This allows the contents to be searched (if the source was a paginated report) and a history of the reports to be maintained. The subscription should include information of the destination type (e.g., email of library) and the destination identification, so that the flow can follow the correct path.
Power Automate affords virtually infinite flexibility for how report subscriptions can be configured.
Conclusion
Power BI is a wonderful tool for allowing mere mortals to drill into data and discover insights. But when it comes to taking action on those insights, the rest of the Power Platform has a wealth of tools, all tightly integrated with Power BI to enable many of these scenarios. This article has discussed seven of them, but there are many more. Given the breadth of the Power Platform, the possibilities are truly endless.
If you got here and you wonder what else to read in this issue, I suggest Chris Huntingford's article, The Rise of the Low-Code Ecosystem is a great read, as is David Yack's article, Power Platform ❤ Code Developers.