


Microsoft's Power BI works as the ultimate power tool for data analysis. Building a model lets you tap into many functionalities within Power BI-like visuals, Power Query, and DAX calculations. DAX is a language available in Power BI that enables you to build formulas and expressions for many kinds of calculations.
DAX: Data Analysis Expressions
The DAX library gives you a litany of options for functions and operators to combine to build formulas and expressions. Within Power BI, you can leverage DAX (short for Data Analysis Expressions) formulas to create three different types of outputs.
- Tables
- Columns
- Measures
For the purposes of this project, you'll focus on creating DAX measures in Power BI Desktop specifically involving date calculations. DAX can look deceptively easy at first because the syntax looks simple, but the logic behind how it works can become a bit tricky. Modeling in DAX, however, become quite fun once you understand how DAX works.
Defining DAX Measures
DAX measures serve as portable formulas in Power BI models. Power BI uses a Vertipaq engine to compress and store the data, which means that DAX measures work more efficiently than DAX columns because they minimize model size by eliminating the need to add new calculated columns. Here are some helpful rules to keep in mind when working with DAX measure calculations.
- Calculations works against data source and not against the visual (such as a table) you're adding them to.
- Measures work independently of one another. This means removing a measure from a table won't impact the calculations of the other measures in the table.
- Filters apply first, then calculations. Unlike Excel, DAX doesn't work on individual cells within tables, but instead works on tables and columns. This means that you'll need to leverage a neat trick with harvesting parameters to reference the value of a cell equivalent in Power BI to create these calculations.
You can only create DAX measures in the Desktop version of Power BI. I typically create a separate table just for the DAX measures, which I think makes it easier to organize the measures in the model. You can do this by creating a new blank table and then adding DAX measures to this new table. You'll remove Column1 after you start adding new measures. Both the measures themselves and the entire Calculations table display calculator icons next to their names.
DAX versus Power Query
I'm not going to discuss Power Query much in this project, but you'll need to leverage it to get the data for these DAX calculations. The Power Query Editor easily lets you set up queries for many different types of data sources like the Federal Reserve of St. Louis Economic Data you'll leverage for this project: https://fred.stlouisfed.org/. If you want to learn more about Power Query, check out another article I wrote for CODE Magazine that focuses specifically on this ETL framework: https://www.codemag.com/Article/2008051/Power-Query-Excel's-Hidden-Weapon.
You can easily configure this Web API data connection by creating a Blank Query in the Power Query Editor, then pasting the M code below into the Advanced Editor window. M is the language (similar to F#) that creates the ETL framework under the hood of Power Query. You're going to first need to request your own FRED API key (https://fred.stlouisfed.org/docs/api/fred/) to update the Source step below for the API query parameter api_key.
let
    Source = Xml.Tables(Web.Contents(
        "https://api.stlouisfed.org/fred/series/observations?
        series_id=MORTGAGE30US&api_key=api_key")),
    observation = Source{0}[observation],
    #"Changed Type" = Table.TransformColumnTypes(observation,
        {{"Attribute:realtime_start", type date},
            {"Attribute:realtime_end", type date},
            {"Attribute:date", type date},
            {"Attribute:value", type number}}),
    #"Inserted Division" = Table.AddColumn(#"Changed Type", "Division",
each [#"Attribute:value"] / 100, type number),
    #"Removed Columns" = Table.RemoveColumns(
        #"Inserted Division", {"Attribute:realtime_start",
            "Attribute:realtime_end", "Attribute:value"}),
    #"Renamed Columns" = Table.RenameColumns(
            #"Removed Columns",{{"Attribute:date", "Date"},
        {"Division", "Rate"}})
in
    #"Renamed Columns"
Once you get the query set up with this ETL framework, you'll then load the data into Power BI Desktop.
Creating Measures Using CALCULATE
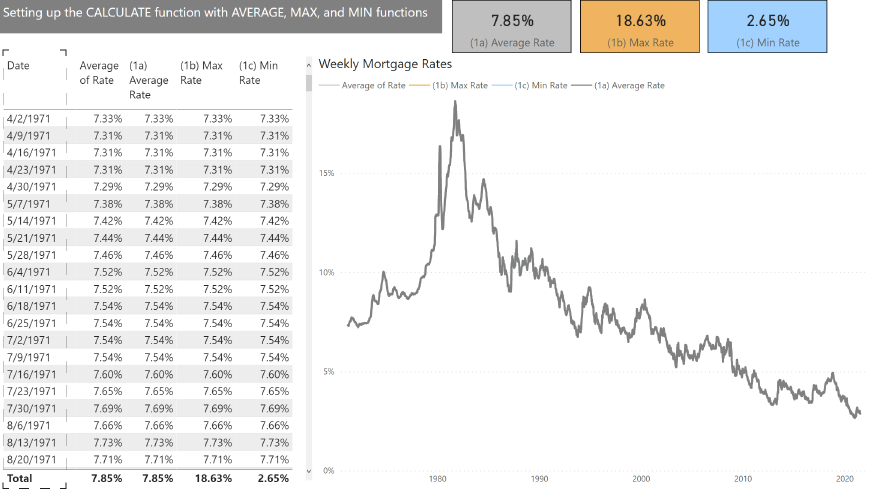
The CALCULATE function is a key DAX function to know when you're creating measures. The CALCULATE function consists of two key components: the calculation part and the filter part. You'll want to think first about filtering the data table you're calculating the measure over, then perform the actual calculation over these filtered rows. However, within the CALCULATE function, the computation part goes before the filters part (separated by commas). The CALCULATE function doesn't require you populate the second filter's component of the formula to return a result, but you do need to populate the first component specifying the calculated aggregation to properly return results. In the measure formulas below, you're nesting the Rate field within the AVERAGE, MAX, or MIN DAX functions and nesting these aggregations within the CALCULATE function.
(1a) Average Rate = CALCULATE(AVERAGE('Mortgage Rates'[Rate]))

(1b) Max Rate = CALCULATE(MAX('Mortgage Rates'[Rate]))

(1c) Min Rate = CALCULATE(MIN('Mortgage Rates'[Rate]))
When creating DAX measures, you'll want to test that they work accurately. Because the DAX measures don't exist as actual columns within your model, you won't see them in the Data view of your model. You can, however, validate that these calculations work by adding them to a standard Power BI table visual, as you see on the left side of Figure 1.
Evaluation Context
You can define the evaluation context of the measures within a Power BI DAX model as the dimensions and filters of the visuals you're adding the measures to. In Figure 1, the dates in the table visual represent the pivot coordinates that you're evaluating at for each of the results the measure calculations return. Notice that the aggregated average Rate field in this same table returns the same result as the Average Rate measure, as well as the Max Rate and Min Rate measures. This occurs because of the context in which the DAX measure evaluates the expression. It's first filtering the data table by the dates in the first column of the summarized table visual. It doesn't matter whether you're calculating the average, maximum, or minimum in this table evaluation context because the data only contains one mortgage rate for each date, and thus the measures will result in the same result for each date regardless of the aggregation type.
To change the evaluation context, you can add or remove dimension fields to the rows in the table in Figure 1. You can remove the Date field from the table visual or you can create new card visuals for each measure to return the same results. You can see that the card visuals in the top right display the average, maximum, and minimum rate over the entire date in the data source instead of for each date. When the evaluation context for calculating the measure changes, so do the results of these calculations. These measures calculate the results without applying any filters because this visual doesn't have any pivot coordinates.
How Filters Work
- By the
pivotcoordinate in which you're evaluating a DAX measure - Adding filters directly to the
Filterspane - Configuring filtering between visuals like slicers that enable interactive user filtering
- You can apply filters in a DAX measure expression by adding filters as a parameter within a DAX expression
DAX Functions with Dates
Now let's focus attention on changing the filters applying to the measure calculations by changing the filter context directly by adding the filters to the second part of the CALCULATE function. Date filters work in two different ways:
- They can move each pivot coordinate date for evaluating the measure to a different date.
- They can expand filter context to include a wider date range for evaluating the measure over.
Filters can also either narrow down or expand the evaluation context for the measure results, depending on the fields that already feed into the calculated formula and the dimensions of the visual you're adding the measure to.
ALL
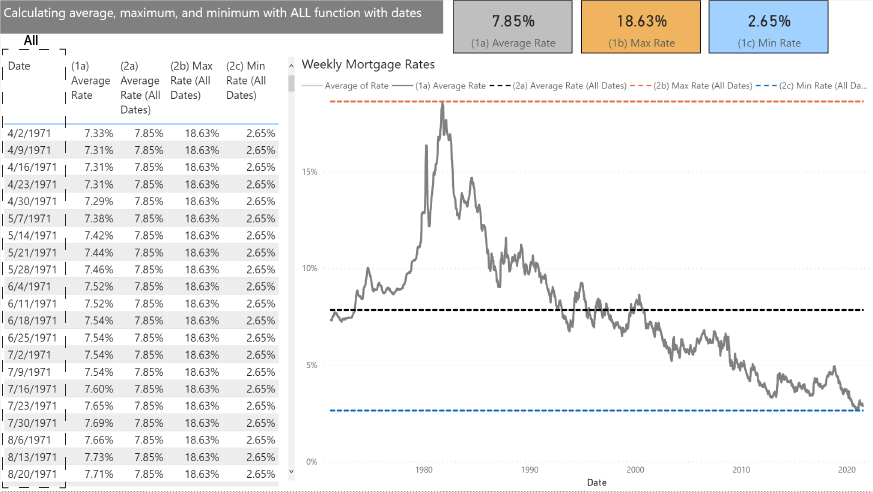
To calculate average, maximum, or minimum rate over all the mortgage rate dates that FRED measures, you can leverage the ALL function to override the pivot coordinates for all the dates in the table. This enables the measures to return the same calculated result for each date in the table in Figure 2. In the second parameter of the CALCULATE function you'll place the ALL function around the Date fields and calculate the average, maximum, and minimum rate in the first part of the formula over the entire date range in Mortgage Rate data source.
(2a) Average Rate (All Dates) =
CALCULATE(AVERAGE('Mortgage Rates'[Rate]),
ALL('Mortgage Rates'[Date]))

(2b) Max Rate (All Dates) =
CALCULATE(MAX('Mortgage Rates'[Rate]),
ALL('Mortgage Rates'[Date]))

(2c) Min Rate (All Dates) =
CALCULATE(MIN('Mortgage Rates'[Rate]),
ALL('Mortgage Rates'[Date]))
ALLSELECTED
What if you want to focus the calculations on a narrower date range than every week over the fifty-year period? If you add a slicer visual with the dates field, you'll give the end user the capability to select the date range over which to calculate the average, minimum, and maximum rates. Like the measures leveraging the ALL function, the ALLSELECTED function removes the date pivot coordinates, defining the evaluation context for the result the measures return. It doesn't, however, ignore all the filters because narrowing down the date range of the slicer visual does change the evaluation context for the measure, as you see in Figure 3. As you can see from the formulas below, you can swap out the ALL function with the ALLSELECTED function in the second parameter of the CALCULATE function.
(3a) Average Rate (All Selected Dates) =
CALCULATE(AVERAGE('Mortgage Rates'[Rate]),
ALLSELECTED('Mortgage Rates'[Date]))

(3b) Max Rate (All Selected Dates) =
CALCULATE(MAX('Mortgage Rates'[Rate]),
ALLSELECTED('Mortgage Rates'[Date]))

(3c) Min Rate (All Selected Dates) =
CALCULATE(MIN('Mortgage Rates'[Rate]),
ALLSELECTED('Mortgage Rates'[Date]))
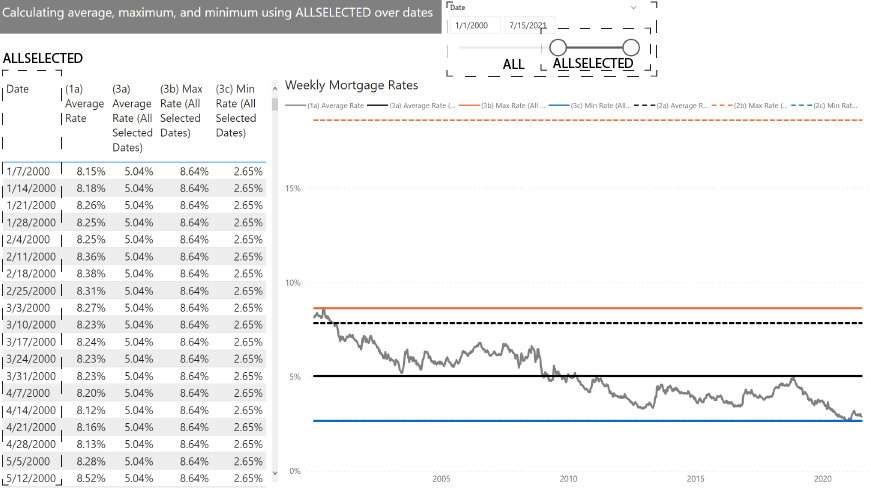
When you narrow down the slicer's date range in Figure 3, the measures return the result over the selected date range instead of all the dates. You can see how the measures for the maximum and average rate over all the dates returns a much higher rate than the selected date range in the past twenty years because the interest rates in the early 1980s were higher than the rates today. You can see this by comparing the lines within the line charts in Figure 3, where the dashed lines indicate the measures calculated over the entire date range and the solid lines indicate the measures calculated over the selected date range.
FIRSTDATE and LASTDATE
Let's say you wanted to determine the mortgage rate on the first date or last date of data. You can use the FIRSTDATE and LASTDATE DAX functions in either the filtering or calculation component of the CALCULATE function. In the measure formulas below, you see how to calculate the first date over all the dates or just the elected date range and the results the measures return in Figure 4.
(4a) First Date (All Dates) =
CALCULATE(FIRSTDATE(
ALL('Mortgage Rates'[Date])))

(4b) First Date (All Selected Dates) =
CALCULATE(FIRSTDATE(
ALLSELECTED('Mortgage Rates'[Date])))
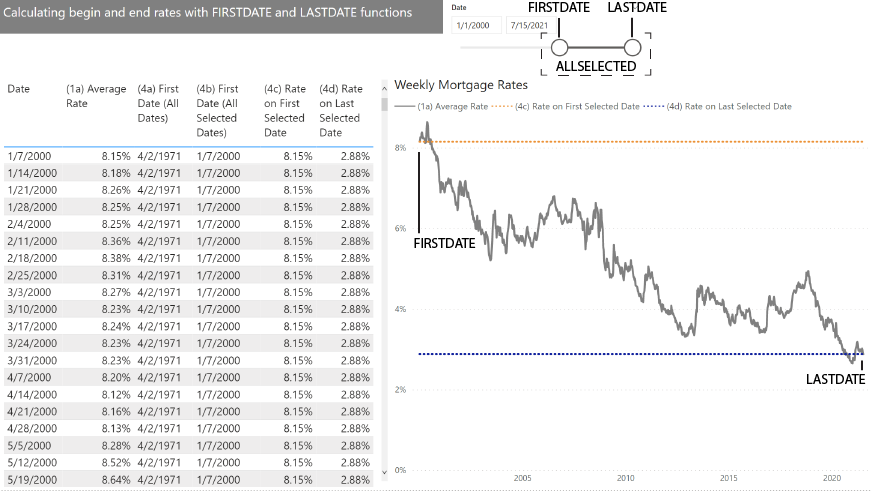
You can also use these calculated aggregations as filters within the CALCULATE expression by placing them into the second part of the CALCULATE function instead of the first part. In the formula below, you're filtering the data table by the selected date range, determining the first date within this narrower date range, and returning the maximum rate for this single date that the filters narrowed down the date range to, as you see in the table and line chart in Figure 4. You can leverage the MIN, AVERAGE, or even the SUM function as the aggregation for this measure. It returns the same result because the data only contains one rate for this filtered date.
(4c) Rate on First Selected Date =
CALCULATE(MAX('Mortgage Rates'[Rate]),
FIRSTDATE(ALLSELECTED('Mortgage Rates'[Date])))
You can also use the LASTDATE function in the filtering parameters to return the rate on the last selected date instead.
(4d) Rate on Last Selected Date =
CALCULATE(MAX('Mortgage Rates'[Rate]),
LASTDATE(ALLSELECTED('Mortgage Rates'[Date])))
For date, you can interchange the MIN and MAX functions specifically applied to dates with the FIRSTDATE and LASTDATE DAX functions respectively to return the same results.
ENDOFMONTH and STARTOFMONTH
(5a) Rate Month End = CALCULATE([(1a) Average
Rate],ENDOFMONTH('Mortgage Rates'[Date]))

(5b) Rate Month Start = CALCULATE([(1a) Average
Rate],STARTOFMONTH('Mortgage Rates'[Date]))
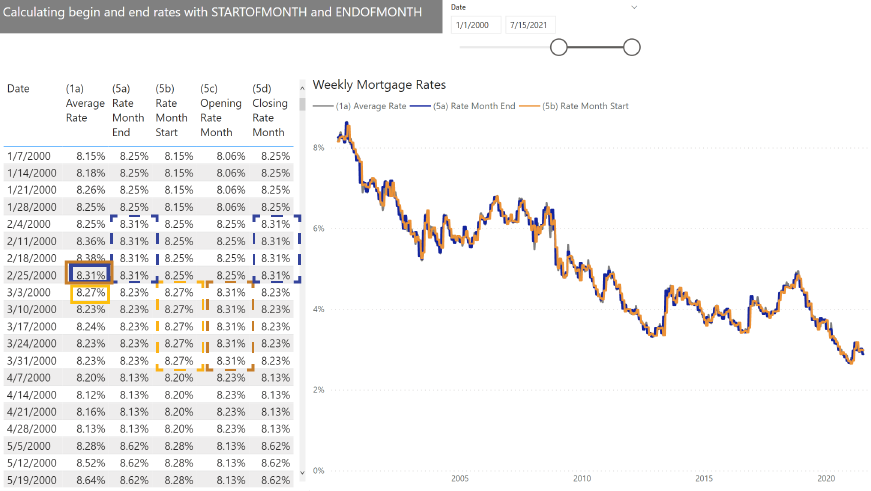
Notice that these date filter functions reference the first or last date of data in each month, not necessarily the actual beginning or ending date of the month, unless those happen to coincide within the Mortgage Rate data source.
OPENINGBALANCEMONTH and CLOSINGBALANCEMONTH
(5c) Opening Rate Month = OPENINGBALANCEMONTH(
[(1a) Average Rate],'Mortgage Rates'[Date])

(5d) Closing Rate Month = CLOSINGBALANCEMONTH(
[(1a) Average Rate],'Mortgage Rates'[Date])
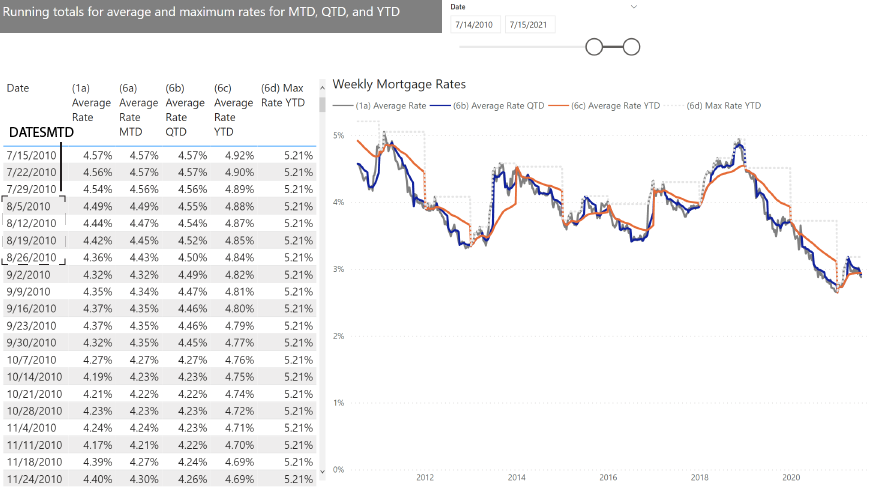
DATESMTD, DATESQTD, and DATESYTD
(6a) Average Rate MTD =
CALCULATE([(1a) Average Rate],
DATESMTD('Mortgage Rates'[Date]))

(6b) Average Rate QTD =
CALCULATE([(1a) Average Rate],
DATESQTD('Mortgage Rates'[Date]))

(6c) Average Rate YTD =
CALCULATE(AVERAGE('Mortgage Rates'[Rate]),
DATESYTD('Mortgage Rates'[Date]))

(6d) Max Rate YTD =
CALCULATE(MAX('Mortgage Rates'[Rate]),
DATESYTD('Mortgage Rates'[Date]))
You can see in Figure 6 how the running totals for the average and maximum numbers differ between the DATESMTD, DATESQTD, and DATESYTD DAX filter functions. The MAX Rate YTD measure returns the maximum year-to-date rate until the next date when the rate reaches a new maximum within this year so far, where it changes to this new maximum rate.
PARALLELPERIOD
You can also expand the date range filter through the PARALLELPERIOD DAX function. Unlike the running total DAX filter functions like DATESMTD, DATESQTD, and DATESYTD, which expand the date range back from the current date to the beginning of the specified period, the PARALLELPERIOD function expands the date range over the entire specified period. This means the measure returns the same result for each date within the period, as you see in Figure 7.
(7a) Monthly Average Rate =
CALCULATE([(1a) Average Rate],
PARALLELPERIOD('Mortgage Rates'[Date],0,MONTH))

(7b) Yearly Average Rate =
CALCULATE([(1a) Average Rate],
PARALLELPERIOD('Mortgage Rates'[Date],0,YEAR))

(7c) Yearly Max Rate =
CALCULATE(MAX('Mortgage Rates'[Rate]),
PARALLELPERIOD('Mortgage Rates'[Date],0,YEAR))

(7d) Yearly Min Rate =
CALCULATE(MIN('Mortgage Rates'[Rate]),
PARALLELPERIOD('Mortgage Rates'[Date],0,YEAR))
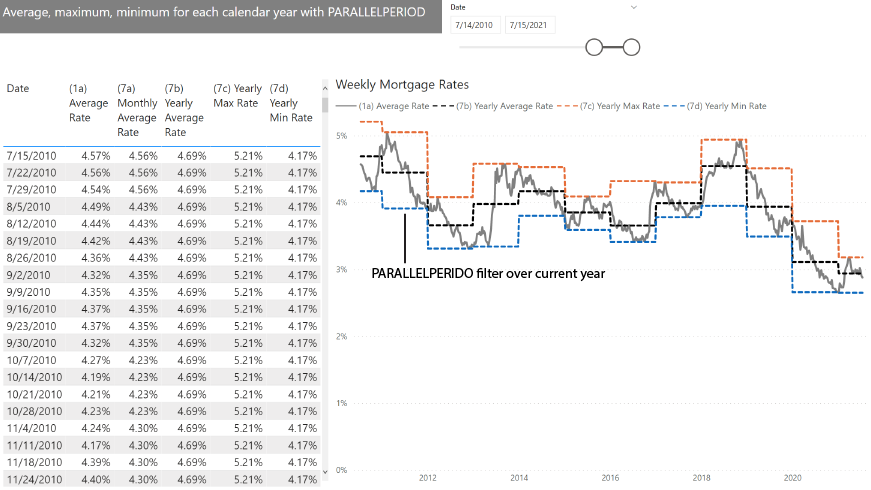
You can move the PARALLELPERIOD filter to a different specified time period by using another number instead of 0.
FILTER
The FILTER function lets you set up a filter over a table or field according to the condition criteria you specify. The FILTER function has two parts: the first part references the table or field you're filtering, and the second part configures the condition you're filtering this table for. Why can't you just set up the filter condition directly in the second part of the CALCULATE function here without using the FILTER function though? There are several other reasons why you'll need to employ the FILTER function for a measure to properly work and setting a condition equal to a measure is one of these scenarios.
Earlier, you calculated the minimum and maximum mortgage interest rate over the entire selected date range. But how can you determine on what date those maximum or minimum rates occur? You can create a measure calculation that determines the maximum or minimum rate over the entire date range, and then you'll match this rate to the date on which it occurs. In the formula below, you're leveraging the FILTER function to expand the filter to all the selected rows in the Mortgage Rate data table, then setting up a condition for the Rate field to equal the minimum mortgage rate over the filtered data table. Finally, you leverage the LASTDATE function to return the date at which this condition occurs.
(8a) Date of Min Rate (Incorrect) =
CALCULATE(LASTDATE('Mortgage Rates'[Date]),
FILTER(ALLSELECTED('Mortgage Rates'),
'Mortgage Rates'[Rate]
=[(3c) Min Rate (All Selected Dates)]))
However, you can see in Figure 8 that this measure returns the last date of the entire data table instead of the date where the minimum rate occurs, so you'll need to explore other approaches for this calculation to properly work.
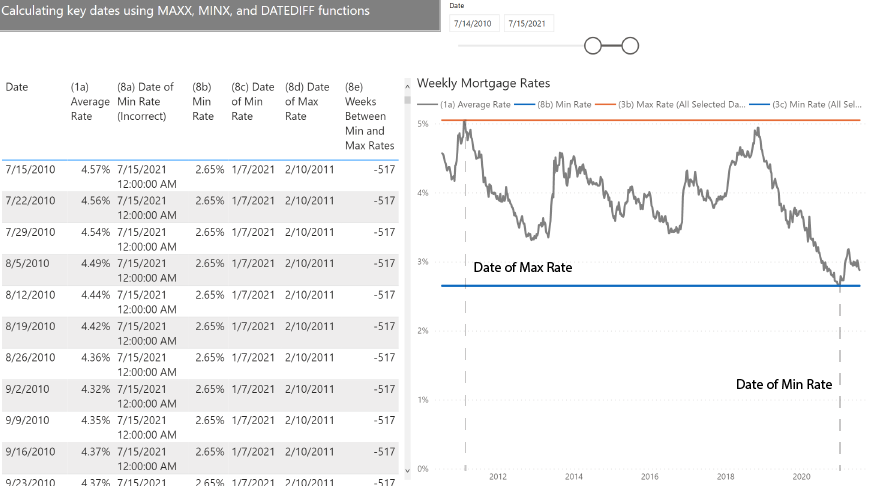
MAXX and MINX
Another way you can calculate a minimum rate over an entire selected date range is by leveraging the MINX function. Because this X function iterates over all the selected dates to return the minimum rate, it calculates the Average Rate measure for each of the pivot coordinates within this selected date range and returns the minimum rate across the entire date range. As you saw in Figure 1, adding the date pivot coordinates to the table means the average, maximum, and minimum measures return the same results, so you can use any of them within the MINX calculation.
(8b) Min Rate =
MINX(ALLSELECTED('Mortgage Rates'),
[(1a) Average Rate])
Now you can set this Min Rate measure equal to the mortgage rate field to determine when this minimum rate occurs. You can see that the formula takes the Min Rate calculation using the MINX function and places it into the filter conditions, but you can also reference the Min Rate measure itself. The FILTER function filters the selected data and then matches the rate to equal the results of the MINX measure calculation to ultimately return the date at which this condition occurs.
(8c) Date of Min Rate =
CALCULATE(LASTDATE('Mortgage Rates'[Date]),
FILTER(ALLSELECTED('Mortgage Rates'),
'Mortgage Rates'[Rate]
=MINX(ALLSELECTED('Mortgage Rates'),
[(1a) Average Rate])))
In Figure 8, you can see that this measure calculation returns the date you expect it to. You can do the same to calculate the maximum value over the same selected date range by utilizing the MAXX function instead of the MINX function.
(8d) Date of Max Rate =
CALCULATE(LASTDATE('Mortgage Rates'[Date]),
FILTER(ALLSELECTED('Mortgage Rates'),
'Mortgage Rates'[Rate]
=MAXX(ALLSELECTED('Mortgage Rates'),
[(1a) Average Rate])))
DATEDIFF
Now that you know when the maximum and minimum rates occur, how can you calculate the duration between these dates? You can set up a DAX measure to calculate this differently by leveraging DATEDIFF, which operates as a date calculation function instead of a filtering function. You can directly use the dates in the formula below because you already calculated the date when the minimum rate occurred and the date when the maximum rate occurred as measures of their own. You already determined the evaluation context for both these measures (Figure 8), and you can use them both directly to calculate this duration. Notice that the formula uses the period unit of WEEK to evaluate the duration but you can use other time periods like DAY as well.
(8e) Weeks Between Min and Max Rates =
DATEDIFF([(8c) Date of Min Rate],
[(8d) Date of Max Rate],WEEK)
Harvesting Parameters
DAX measures work on columns and tables instead of individual cells in a table (unlike Excel), so if you want to reference the date of each pivot coordinates in your measure calculations directly, you'll need to set up a parameter harvesting measure that uses an aggregation function like LASTDATE or MAX to calculate each of the dates as its own measure value in this scenario.
(9a) Current Date = CALCULATE(LASTDATE('Mortgage Rates'[Date]))
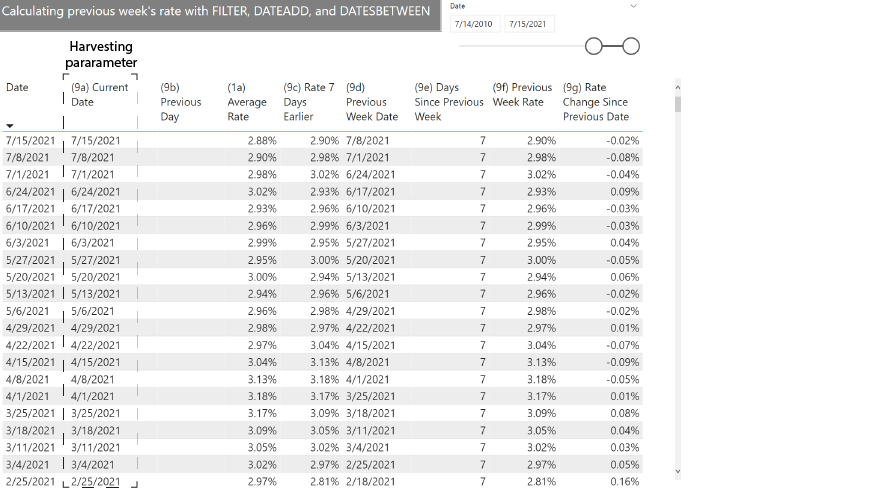
You can see in Figure 9 that the results of the Current Date harvesting parameter exactly equal the date at each of the pivot coordinates. This calculated date isn't particularly helpful by itself, but it's quite helpful in other calculations.
PREVIOUSDAY
The PREVIOUSDAY function moves the date back a single day. If you have a contiguous field of dates in your Power BI model, you can set up a measure with the PREVIOUSDAY function to create a measure that works like a harvesting parameter, but for the previous day instead of the current day. However, as you can see from Figure 9, this measure returns blanks for this date range because the dates are weekly instead of daily, which means there's no yesterday's date for any pivot coordinate in the existing Date field.
(9b) Previous Day = CALCULATE(PREVIOUSDAY('Mortgage Rates'[Date]))
DATEADD
If you want to move the date pivot coordinates backward or forward by a specified number of days (or month, quarter, or years), you can leverage the DATEADD function to move each date pivot coordinate to another date by the specified number of periods in the filter formula. You can see below how to set up a measure calculating the previous week's Rate using the DATEADD filter function.
(9c) Rate 7 Days Earlier =
CALCULATE(AVERAGE('Mortgage Rates'[Rate]),
DATEADD('Mortgage Rates'[Date],-7,DAY))
However, if you take a closer look at the Figure 9 sheet of the attached *.PBIX file that includes all the visuals and DAX measures, you'll notice that holidays for example often skew the weekly numbers so the previous week's date occurs six or eight days before the current date for example. This means that the measure returns no results for this week because this DATEADD filter fixes the interval between weeks to exactly seven days.
DATESBETWEEN
One workaround for these infrequently inconsistent weekly intervals is by leveraging the DATESBETWEEN function. This filtering function lets you expand the date range between a start date and end date. In the formula below, you're expanding the dates for each of the pivot coordinates to a date range between 14 days and one day before the current date (which therefore excludes the current date from the date range). The LASTDATE calculation then returns the most recent of this expanded date range, which represents the previous week's date as you see in the table of Figure 9.
(9d) Previous Week Date =
CALCULATE(LASTDATE('Mortgage Rates'[Date]),
DATESBETWEEN('Mortgage Rates'[Date],
[(9a) Current Date]-14,[(9a) Current Date]-1))
Once you determine the date for the previous week, you can then use it in other measure calculations, like determining the days between each week and the previous week using the DATEDIFF function.
(9e) Days Since Previous Week =
DATEDIFF([(9d) Previous Week Date],
[(9a) Current Date],DAY)
Now you can use this measure directly in another new measure referencing the Days Since Previous Week measure instead of a fixed seven days within the DATEADD filter function.
(9f) Previous Week Rate =
CALCULATE([(1a) Average Rate],
DATEADD('Mortgage Rates'[Date],
-[(9e) Days Since Previous Week],DAY))
You can now directly subtract (or add, multiply, or divide) one measure from another to determine the mortgage rate change rate from the previous week.
(9g) Rate Change Since Previous Date =
[(1a) Average Rate]-[(9f) Previous Week Rate]
Keep Practicing
These measures represent just a few examples of how to leverage DAX modeling for dates within Power BI. As you can see, the DAX language enables you to create some powerful measures in a model like this. DAX measures take some time to become comfortable using, but testing them out on existing data offers one path forward. I encourage you to download the project file for this article and expand your own knowledge by trying out and testing DAX calculations on your own!