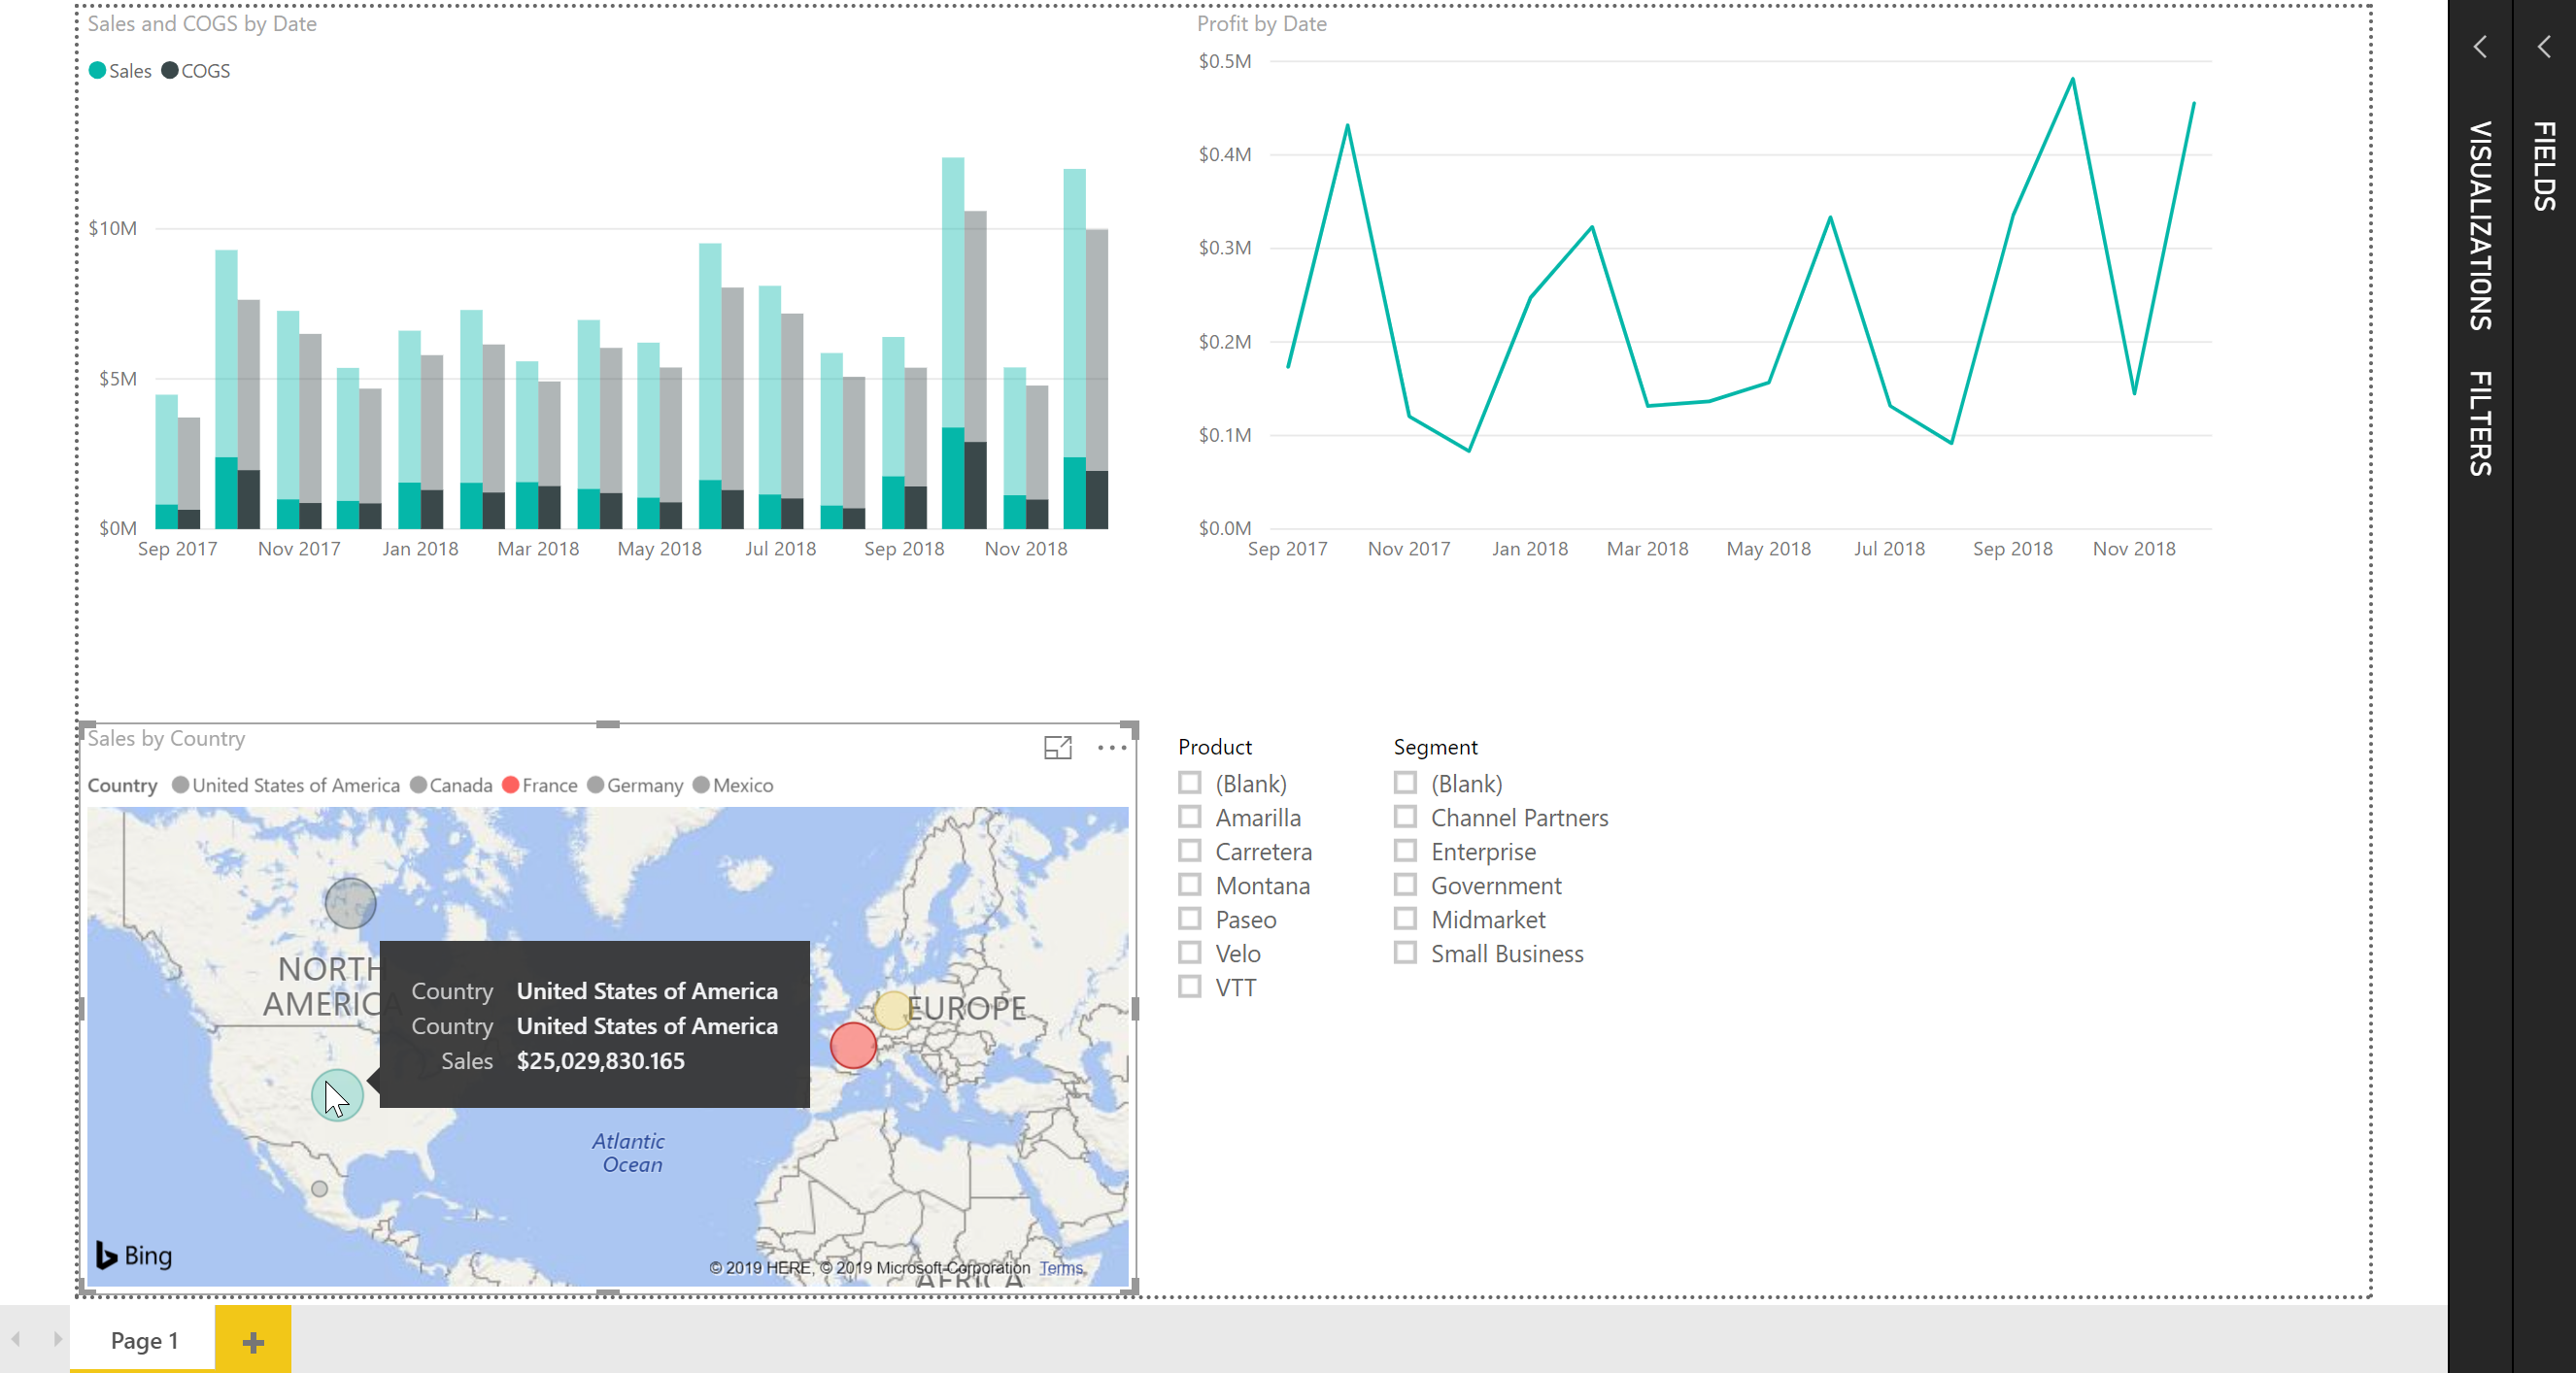
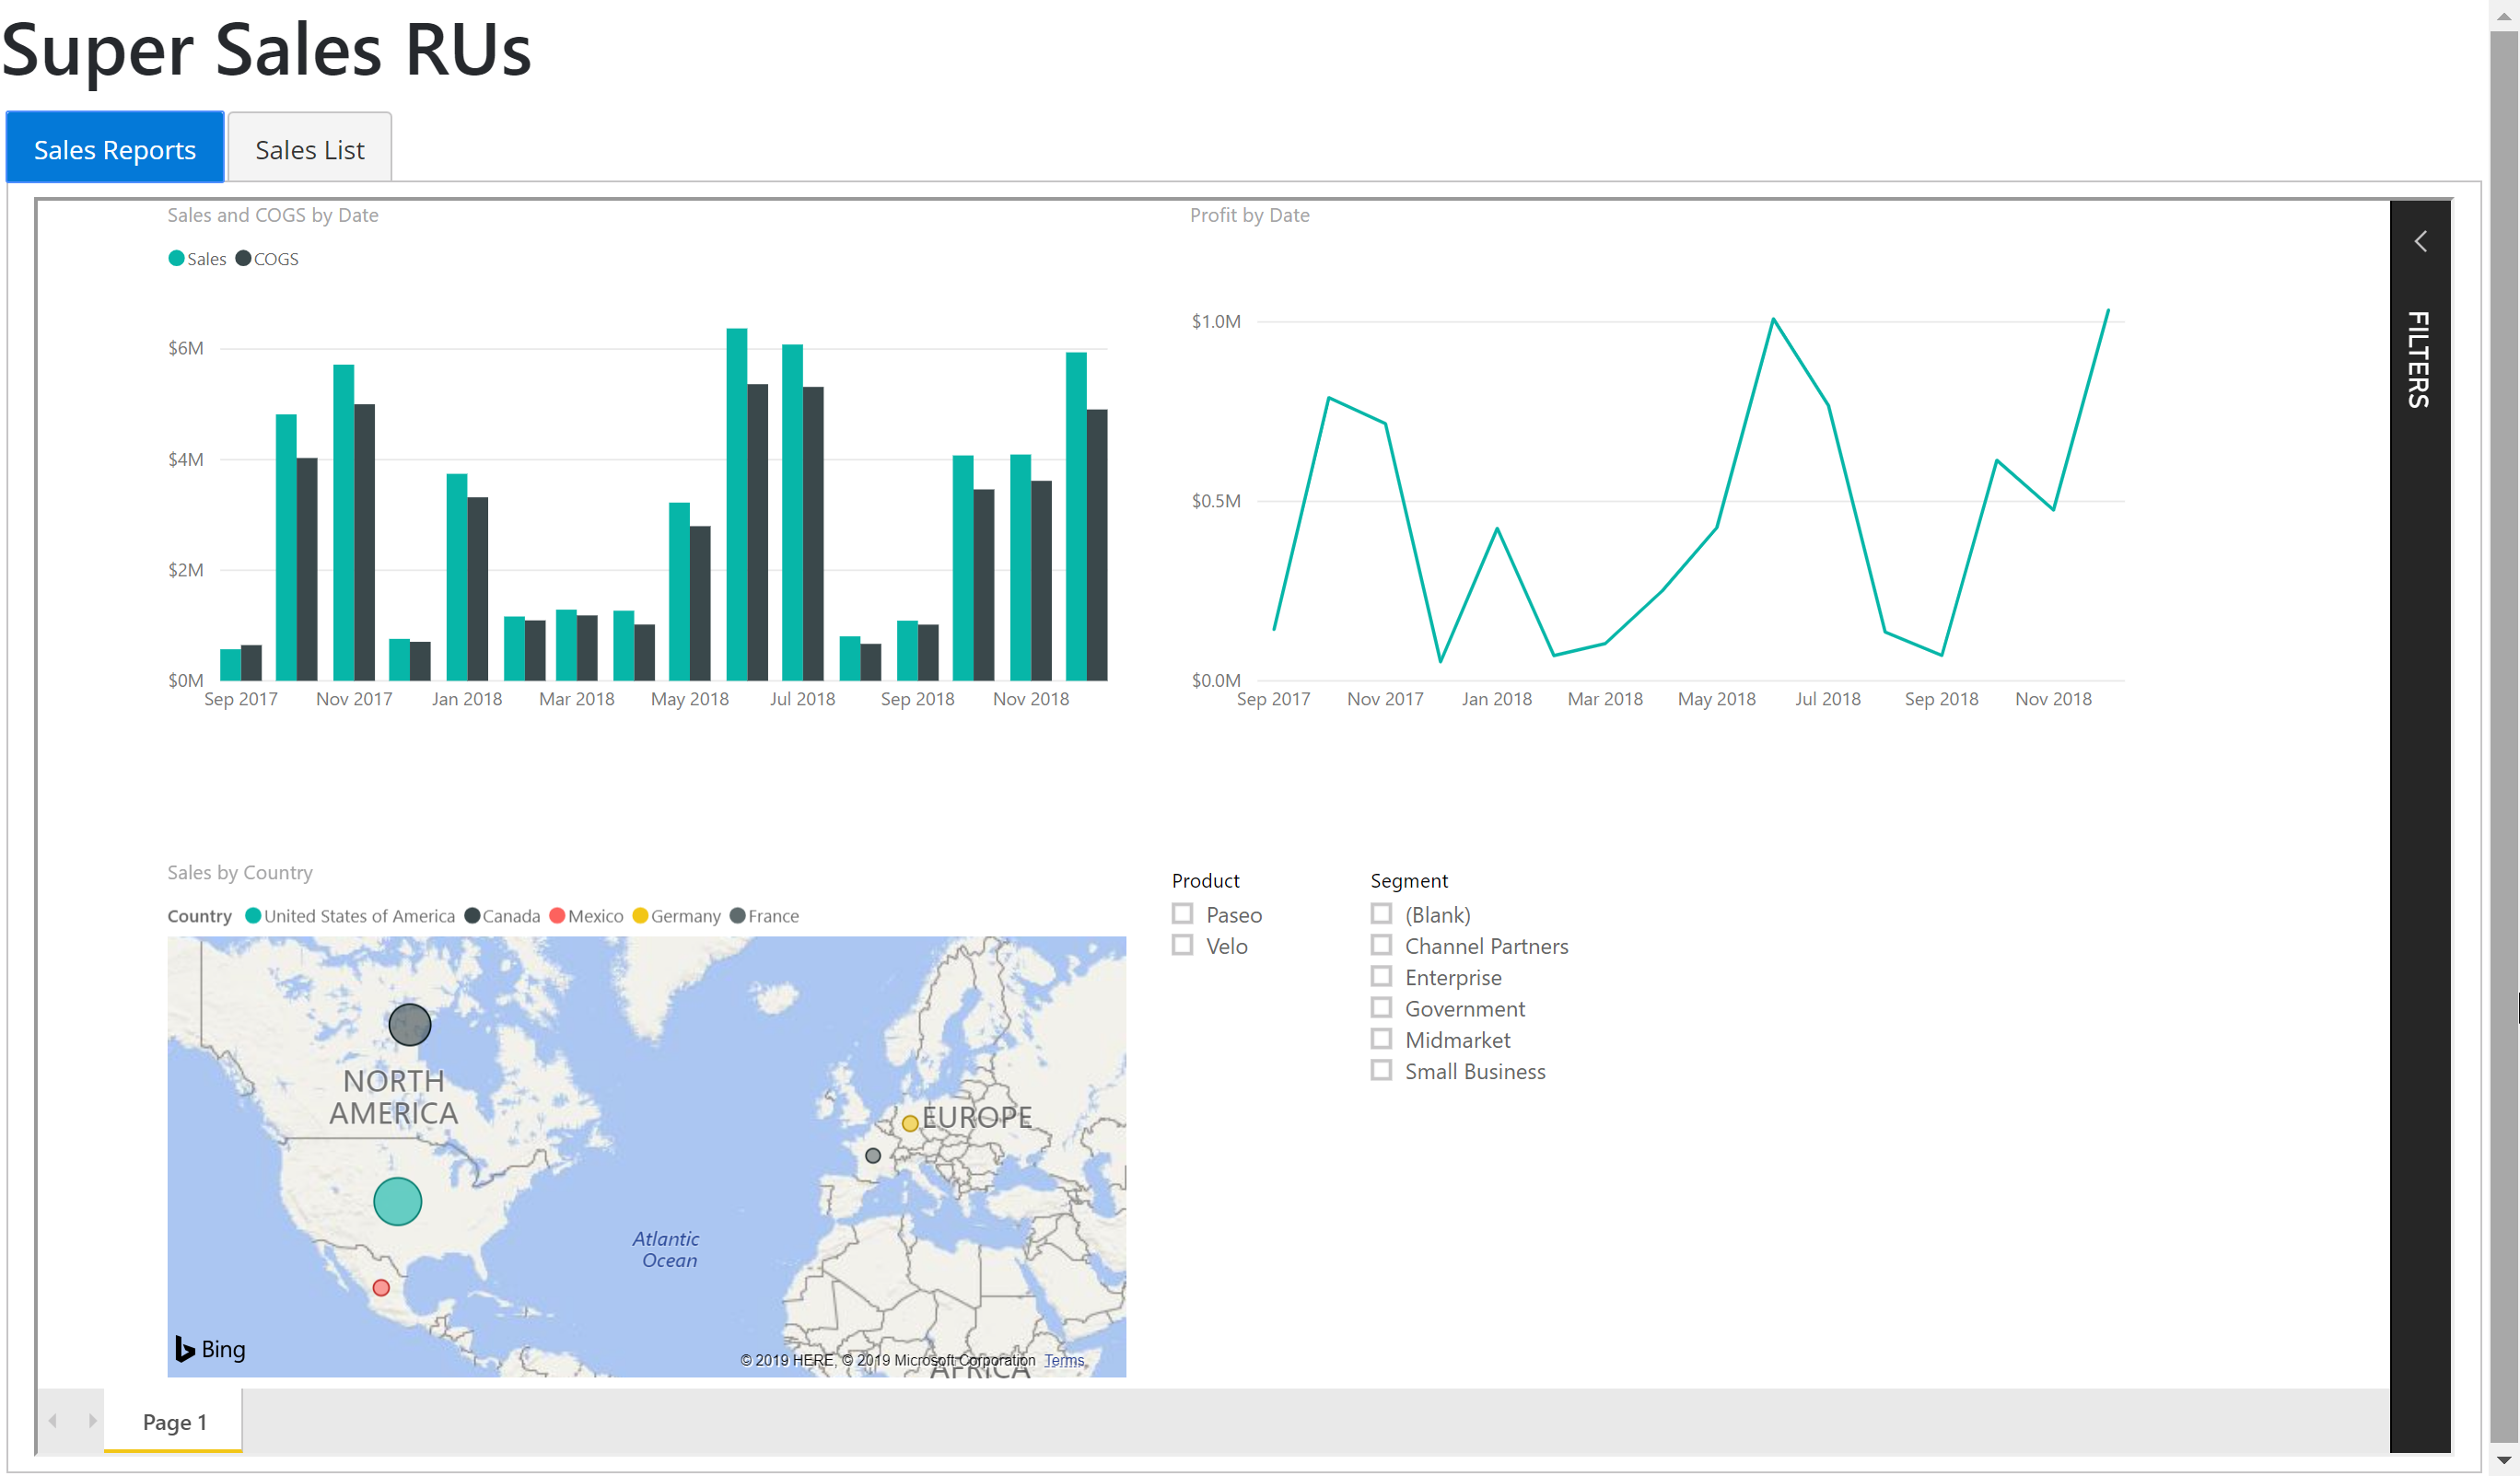
If you're building modern business apps or Software as a Service (SaaS) Web applications, you'll often need to provide rich data visualizations for your users. There are a lot of ways to go about this, including using chart and gauge controls from popular Web component libraries, to using the d3.js library to implement graphics from lower-level primitives, to embracing a Business Intelligence (BI) or Analytics platform. One great option available to you these days is Microsoft Power BI Embedded. Using Power BI, it's quick and easy to create great-looking visuals like those shown in Figure 1.
Another great feature of Power BI that you can't see in a figure - visuals that you put in Power BI reports are interactive - when you click on chart elements, Power BI can filter the data in that chart and other charts in the report based on what was selected, and when you have a hierarchy of data, you can drill down through interactions in the visuals. For example, in Figure 1, I clicked on the bubble in the United States on the map visual, and it dimmed out the portions of the bar chart in the upper left that aren't from United States, and it re-rendered the line chart in the upper right to only show the profit from United States sources. If I clicked in any of the Product or Segment checkboxes (called slicers in Power BI), it filters the data and only shows the data from the selected product(s) or segment(s).
Power BI includes a good set of built-in visuals, and you can easily go way beyond those by tapping into the large and vibrant Power BI Marketplace, which contains both free and paid visuals that you can use in your reports as well.
Power BI Client Landscape
Power BI is a platform for business intelligence data visualization. It has a big ecosystem associated with it, so let me clarify some terminology and what parts of it I'll be focusing on in this article. Power BI has several ways users work with it.
First, there's Power BI Desktop, which is a Windows Desktop client application that you can download from the Windows Store. The app itself is free, but to work with Power BI Desktop you'll need a Power BI Pro or Premium license. The Pro license is roughly $10 US per month. Power BI Premium depends on how many users you will have and how much guaranteed capacity you need. With Power BI Desktop, you can not only view Power BI Reports and Dashboards, that's also the primary way of authoring them.
Once you have designed a report or dashboard with Power BI Desktop, you can then publish it to the Power BI Service. Power BI Service lets you view, manage, and configure reports and dashboards that you want to share with other Power BI users through a Web portal interface that is a SaaS application itself. Power BI Mobile is a mobile app that you can use to view reports and dashboards that your Power BI account has access to on your mobile devices. Both options also require Power BI Pro or Premium user licenses to use them. The accounts associated with these Power BI Pro or Premium licenses need to be an Office 365, Microsoft Work/School, or Azure Active Directory (Azure AD) account; in other words, not just any Microsoft (Personal) Account will do.
The accounts associated with Power BI Pro or Premium licenses need to be Office 365, Microsoft Work/School, or Azure Active Directory (Azure AD).
Embedding Power BI Visuals in Your Application
Requiring an Office 365, Azure AD, or Microsoft Work/School account for every user who's going to see your reports is a bit limiting and having them only see them in the Power BI client apps means they don't become part of your app's user experience. The good news is that there's another form of Power BI client that you can leverage: Power BI Embedded. With Power BI Embedded, you can take the reports you design, integrate them into your Web, desktop, or mobile apps, and allow any of your application users to see them without requiring Power BI accounts for each user. You can still authenticate your users the way you already do, and can pass the context of the user, as well as app parameters, down into the reports and dashboards that get rendered into your application.
The way they do this is simple conceptually: The reports can be rendered into a Web page through an embedded iframe. To do this easily, you use the Power BI client libraries that work for any browser application (which also includes embedding a Web view into a desktop or native mobile app), and Power BI renders your reports and dashboards into the content of a div that you identify within your pages.
Let's dive right into building a sample. For the first sample, I'm going to use Angular for my front-end and ASP.NET Core for my back-end, but you can do what I'm going to show in any Web front end, regardless of which front- or back-end frameworks you're using. All you need is some HTML and the Power BI JavaScript library to do the embedding. I'll also cover doing the same thing with an ASP.NET Core MVC application, so you can see the differences in a server-rendered page from a client Single Page Application (SPA)-rendered report.
First Comes Data
You can't have data visualizations without data, so let's start there. Power BI has a lot of different ways to connect to data. The starting point for a lot of Power BI use is simply to import data from Excel or CSV, or from databases of many flavors, or from well-known data APIs like SharePoint, Dynamics, SalesForce, and so on. If you need your data to be a little more real time, you can also create DirectQuery connections to databases, which results in the report being rendered directly from the data in the database at the time the report is rendered. When you import data, that data is cached in a data set in Power BI, and you have to use the Power BI API to get it to refresh the data.
For my sample application scenario, I'm going to use some simple financial data representing sales of some products. The data includes various numeric fields for sales amount, profit, cost of gross sales (COGS), and a few other sales-related fields that you might want to report on if you were in a sales organization. To show how this can work with near-real-time data, I'm going to host that data in an Azure SQL Database and use DirectQuery to connect to it. DirectQuery enables your reports to be rendered in real time from your database, as well as enabling row-level security filtering so that users only see the data they're authorized for in your reports. Your data doesn't have to be in the cloud for Power BI to connect to it, because Power BI supports data gateways that let you get to on-premise databases or APIs as well. But if the data is already accessible in the cloud, it makes things a lot easier.
DirectQuery enables your reports to be rendered in real-time from your database, as well as enabling row-level security filtering so that users only see the data they're authorized for in your reports.
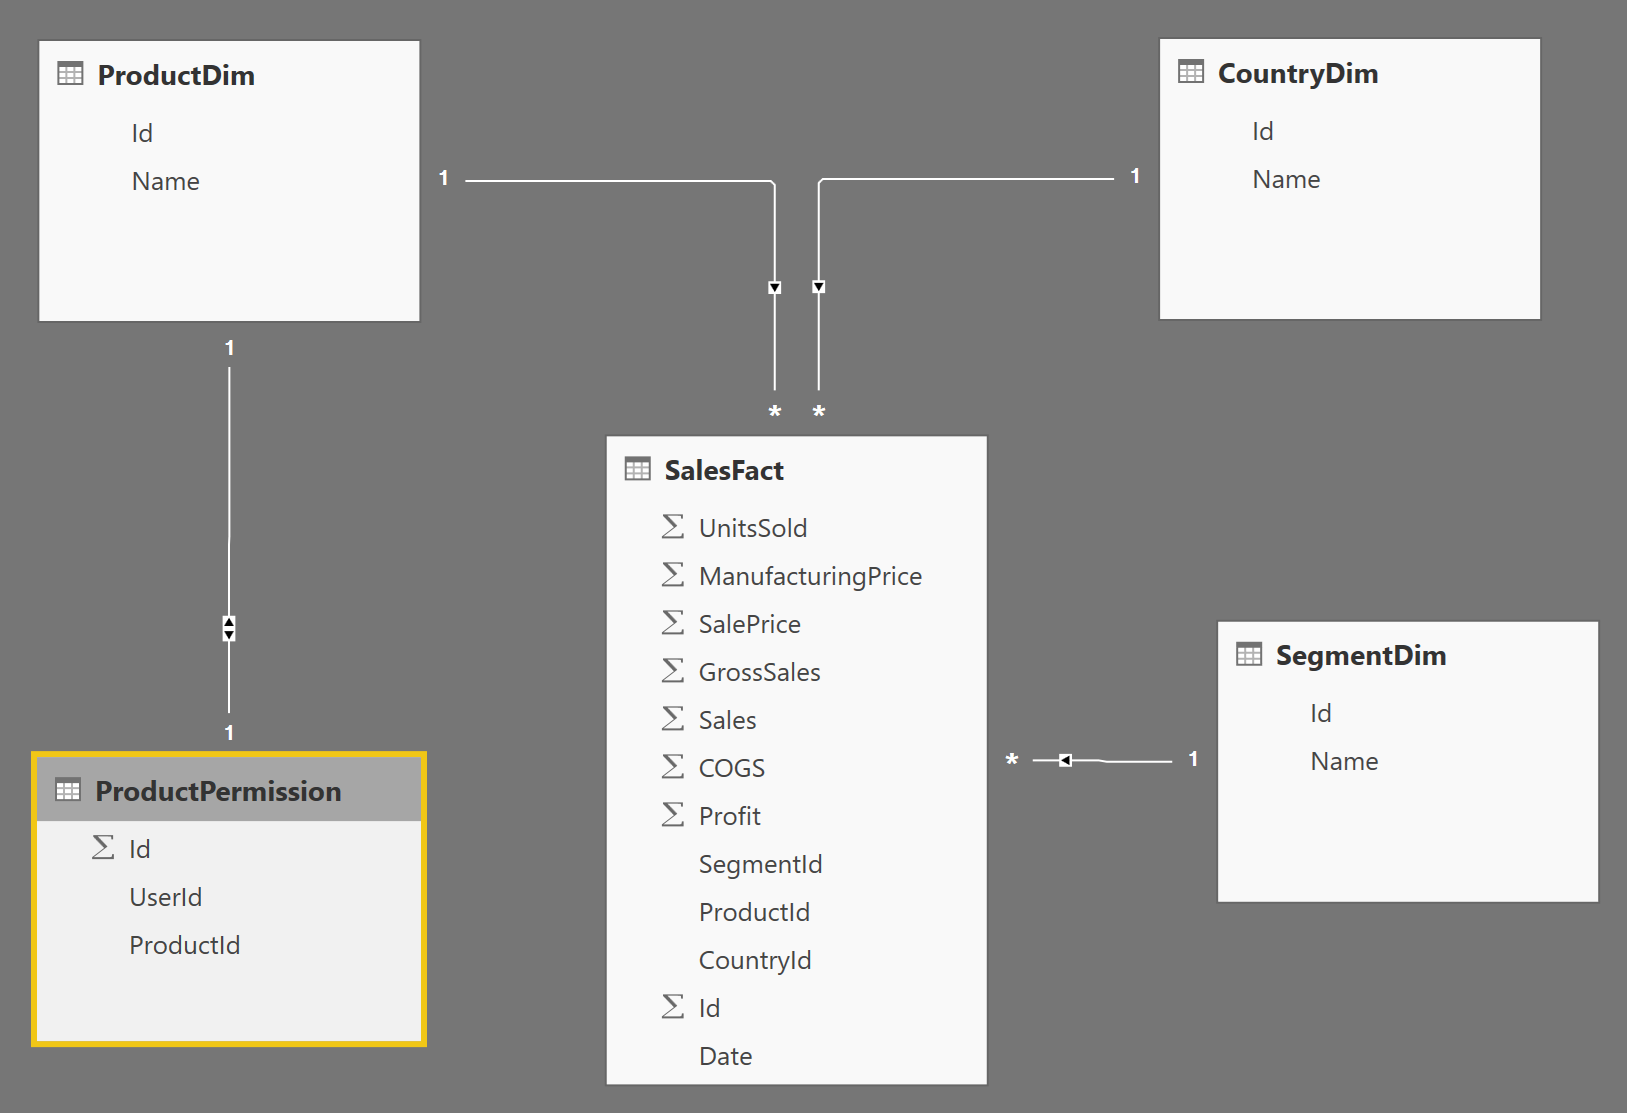
The sample application code includes a SQL script and instructions to set up an Azure SQL Database, as well as a Power BI desktop file that has the data all imported so you don't have to set up any back-end database if you just want to experiment with rendering a static report in your app. Figure 2 shows the relational data model of the data I'll be working with, displayed in the Power BI Desktop relationships view.
Setting Up a Power BI Account
As mentioned earlier, to start working with Power BI, you need an account. To set up an account, you need a Microsoft Work/School account. These are different from a personal Microsoft Account set up with an email account that you own. Microsoft Work/School accounts are created through Office 365, Azure Active Directory, Dynamics, or several other paths, and they're an account associated with an organization instead of an individual. You can create one of these on your own, even if you don't have an account with an organization. The steps are a little involved, but I've included a step-by-step guide on doing so in the download sample code so you can get up and running on your own.
Once you have an organizational account, you must create a Power BI Pro subscription for that account. To do that, you can just go to https://powerbi.microsoft.com/ and sign up for a free trial. That gives you 60 days to work with it and experiment without needing to pay anything.
Starting a Power BI Report in Power BI Desktop
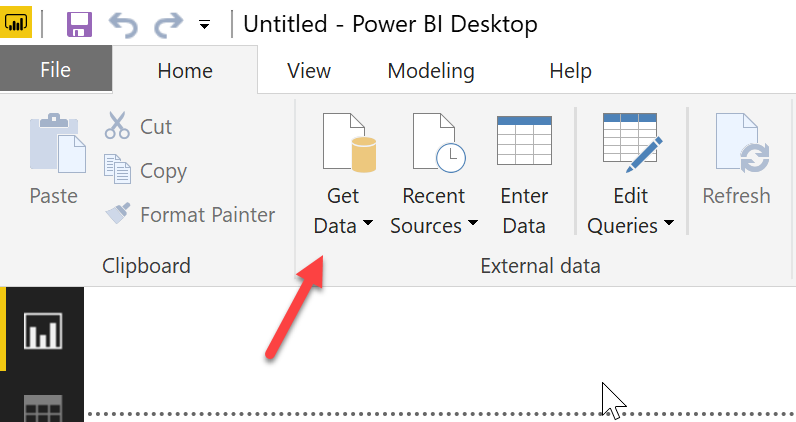
Once you have a data source set up that you're going to pull data from and a Power BI account, you can download and fire up Power BI Desktop and start defining a report. Once you launch the app and sign in with your Power BI account, you can connect to a data source with the Get Data button in the ribbon at the top, as shown in Figure 3.
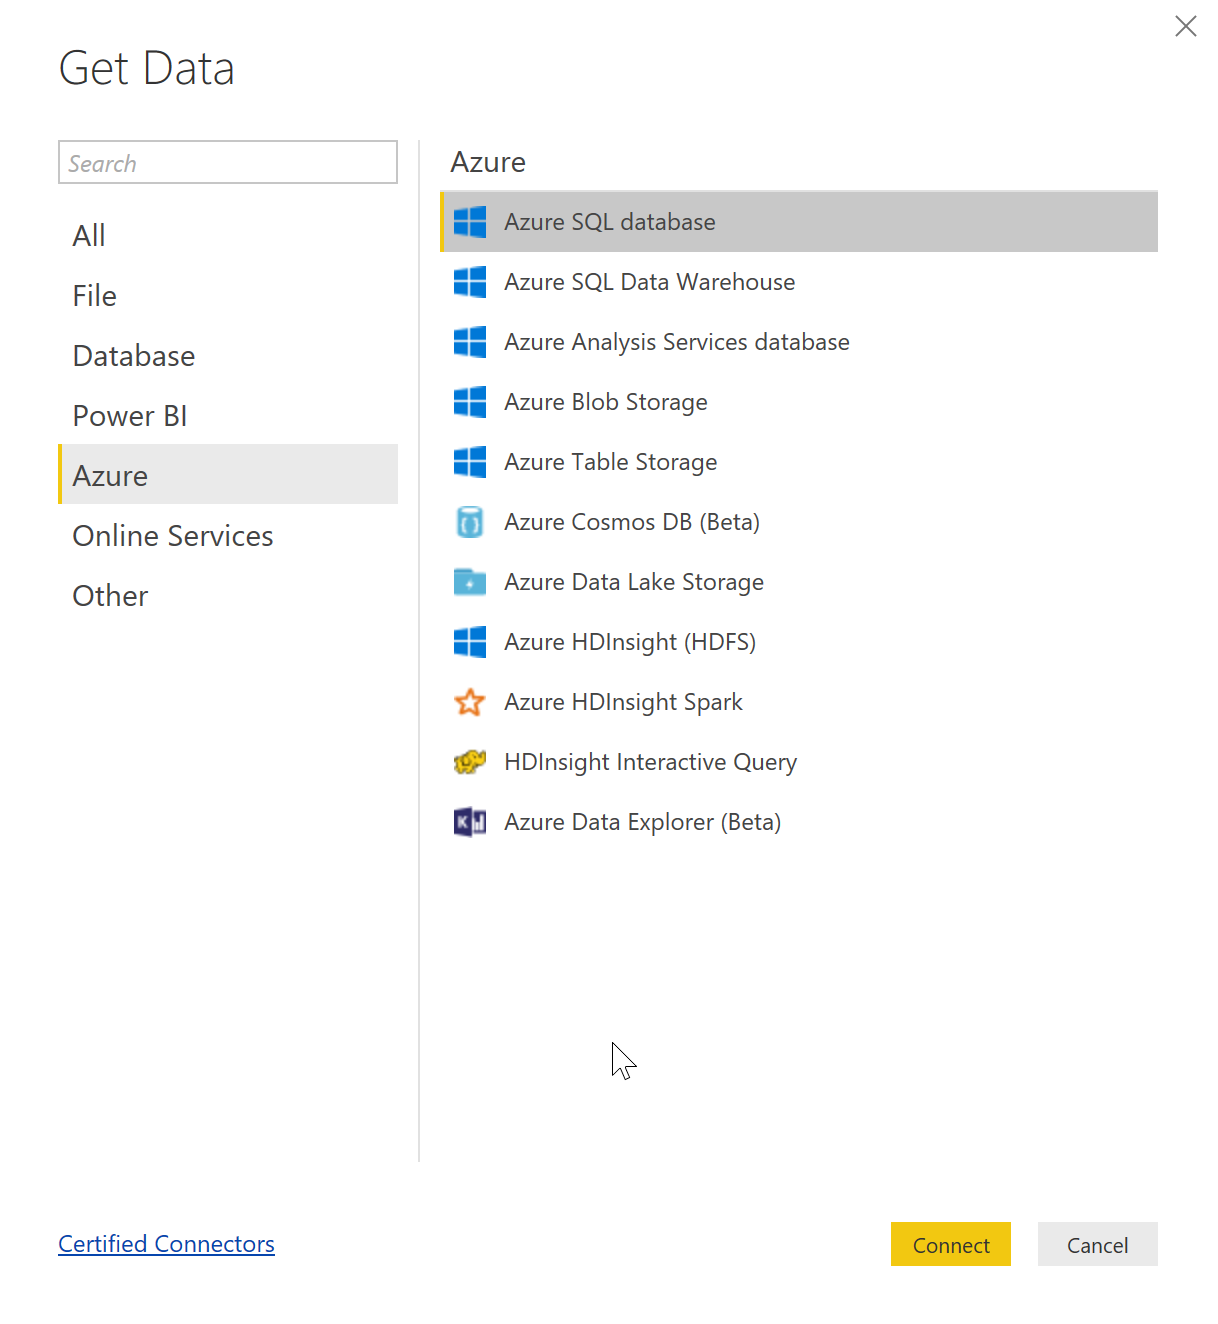
In the Get Data dialog that comes up, you can select from the wide variety of data sources supported. For my demo app, I connect to an Azure SQL Database that I've already set up and populated with the Sales data, as shown in Figure 4.
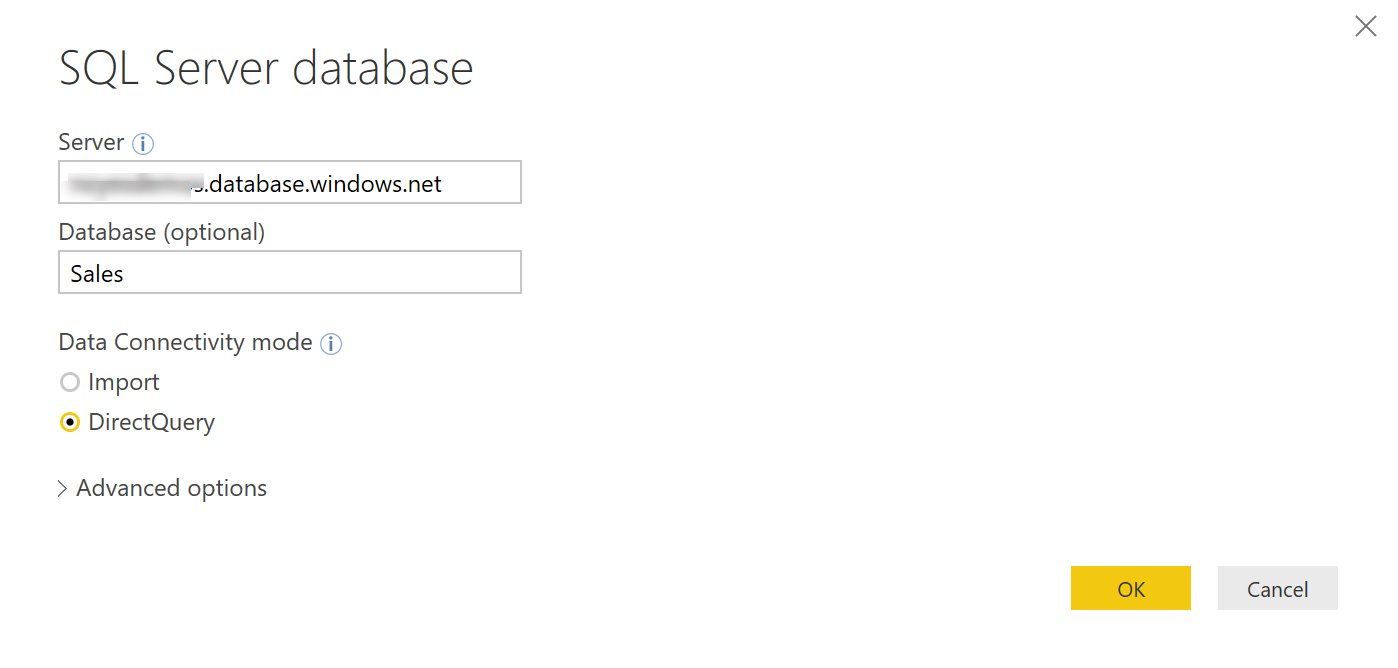
I then enter the name of the database server I'm connecting to, as well as the name of the database, and select DirectQuery because I want the report to get the data from the database each time it's rendered, as shown in Figure 5.
The next step has you select which tables from that data source you want to work with and gives you a preview of the data in the Navigator view, as shown in Figure 6.
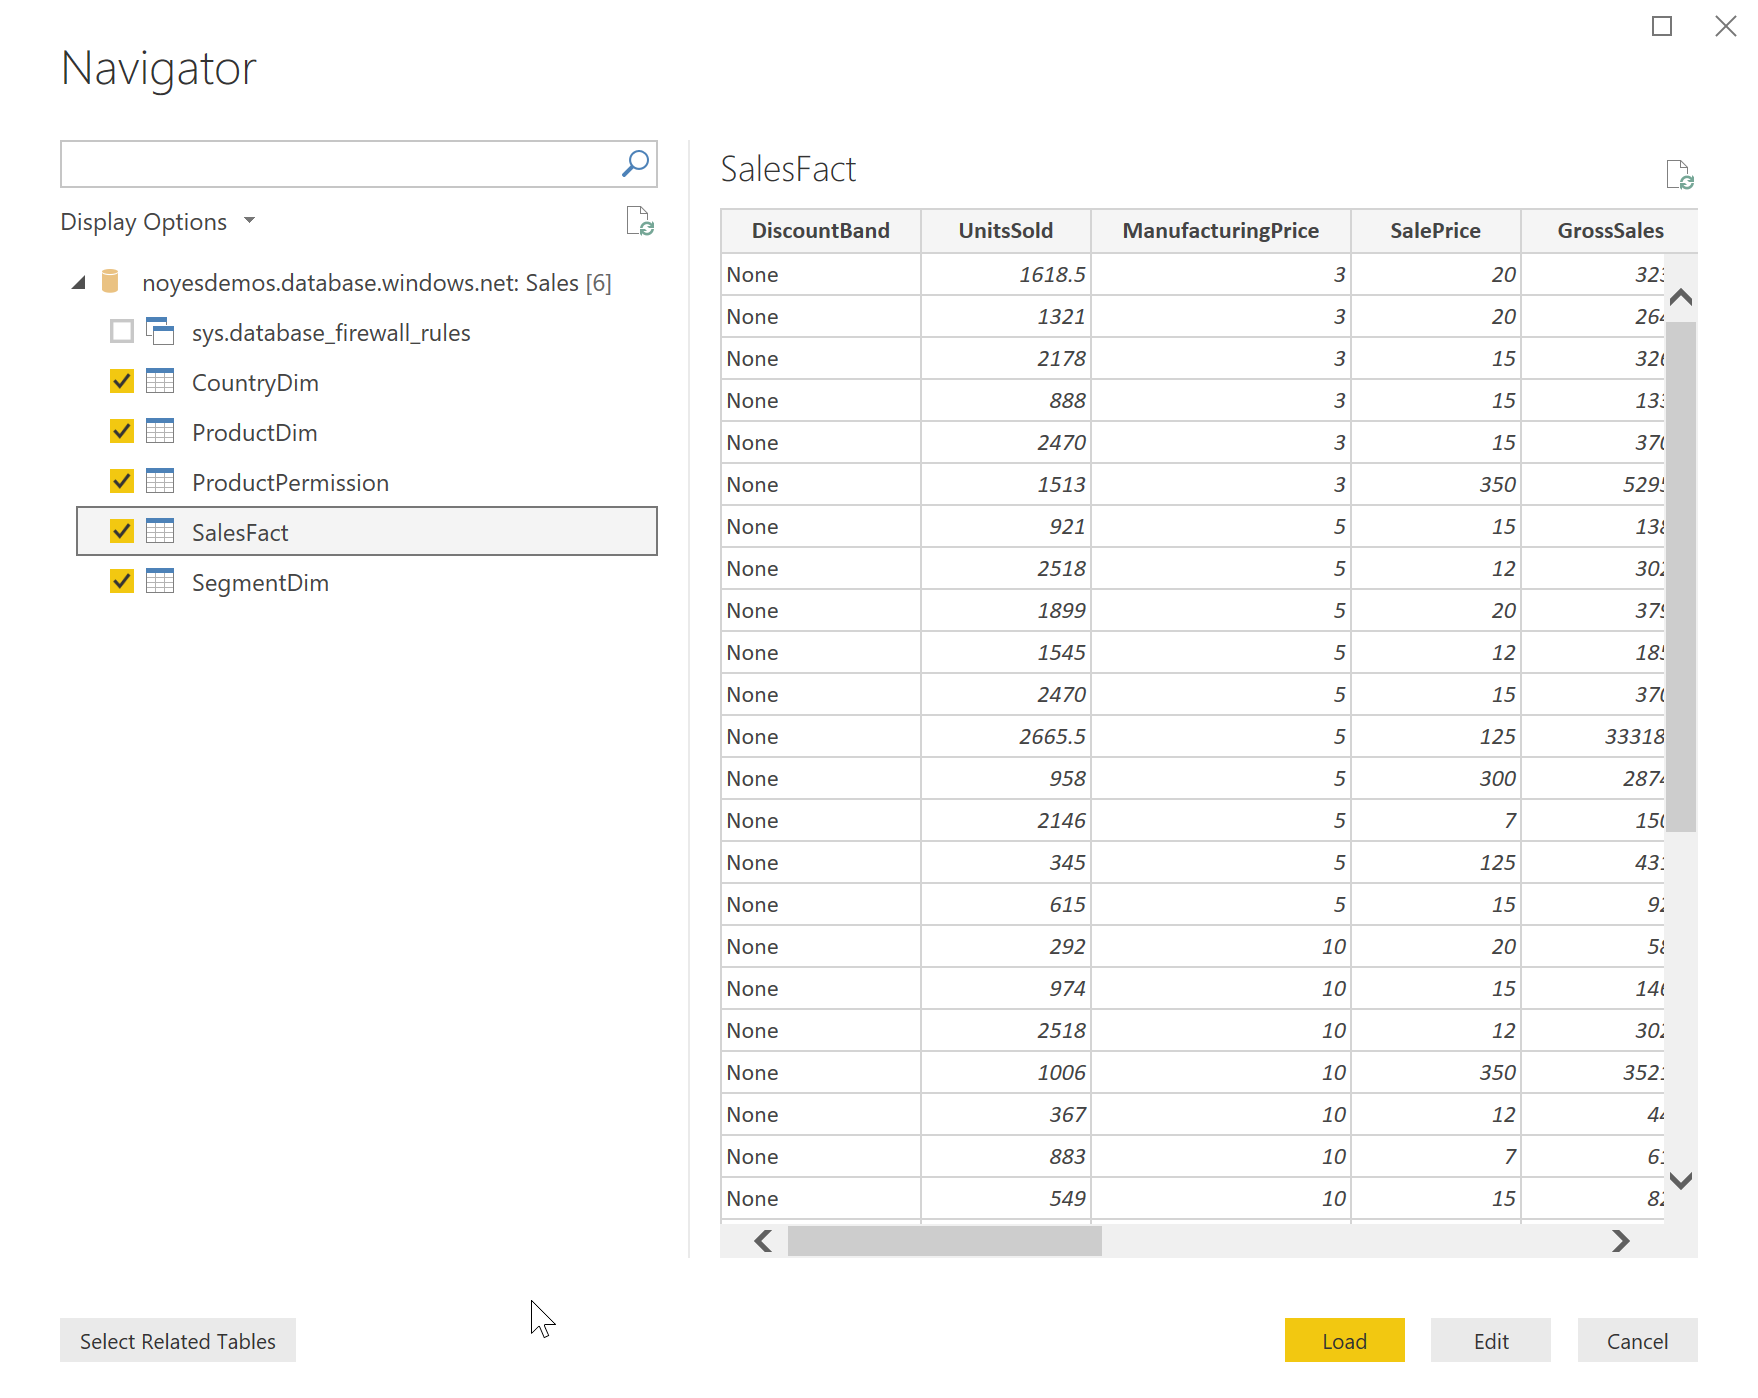
If you click Edit from that Navigator View, it takes you into a query editor where you can do a lot of powerful transformations of the data coming from the database, including creating computed tables and columns, filtering the data, and using the “M” Power Query language to do other complex massaging of the data for the report. That's not the focus of this article though, and I'm using a simple data source that's already in the shape I need to start hooking up to reports. So, from the Navigator view, I just click the Load button and I'm brought back into the main Power BI Desktop window with the tables from my data source listed in the Fields panel on the far right of the Power BI Desktop designer.
Defining Data Source Relationships
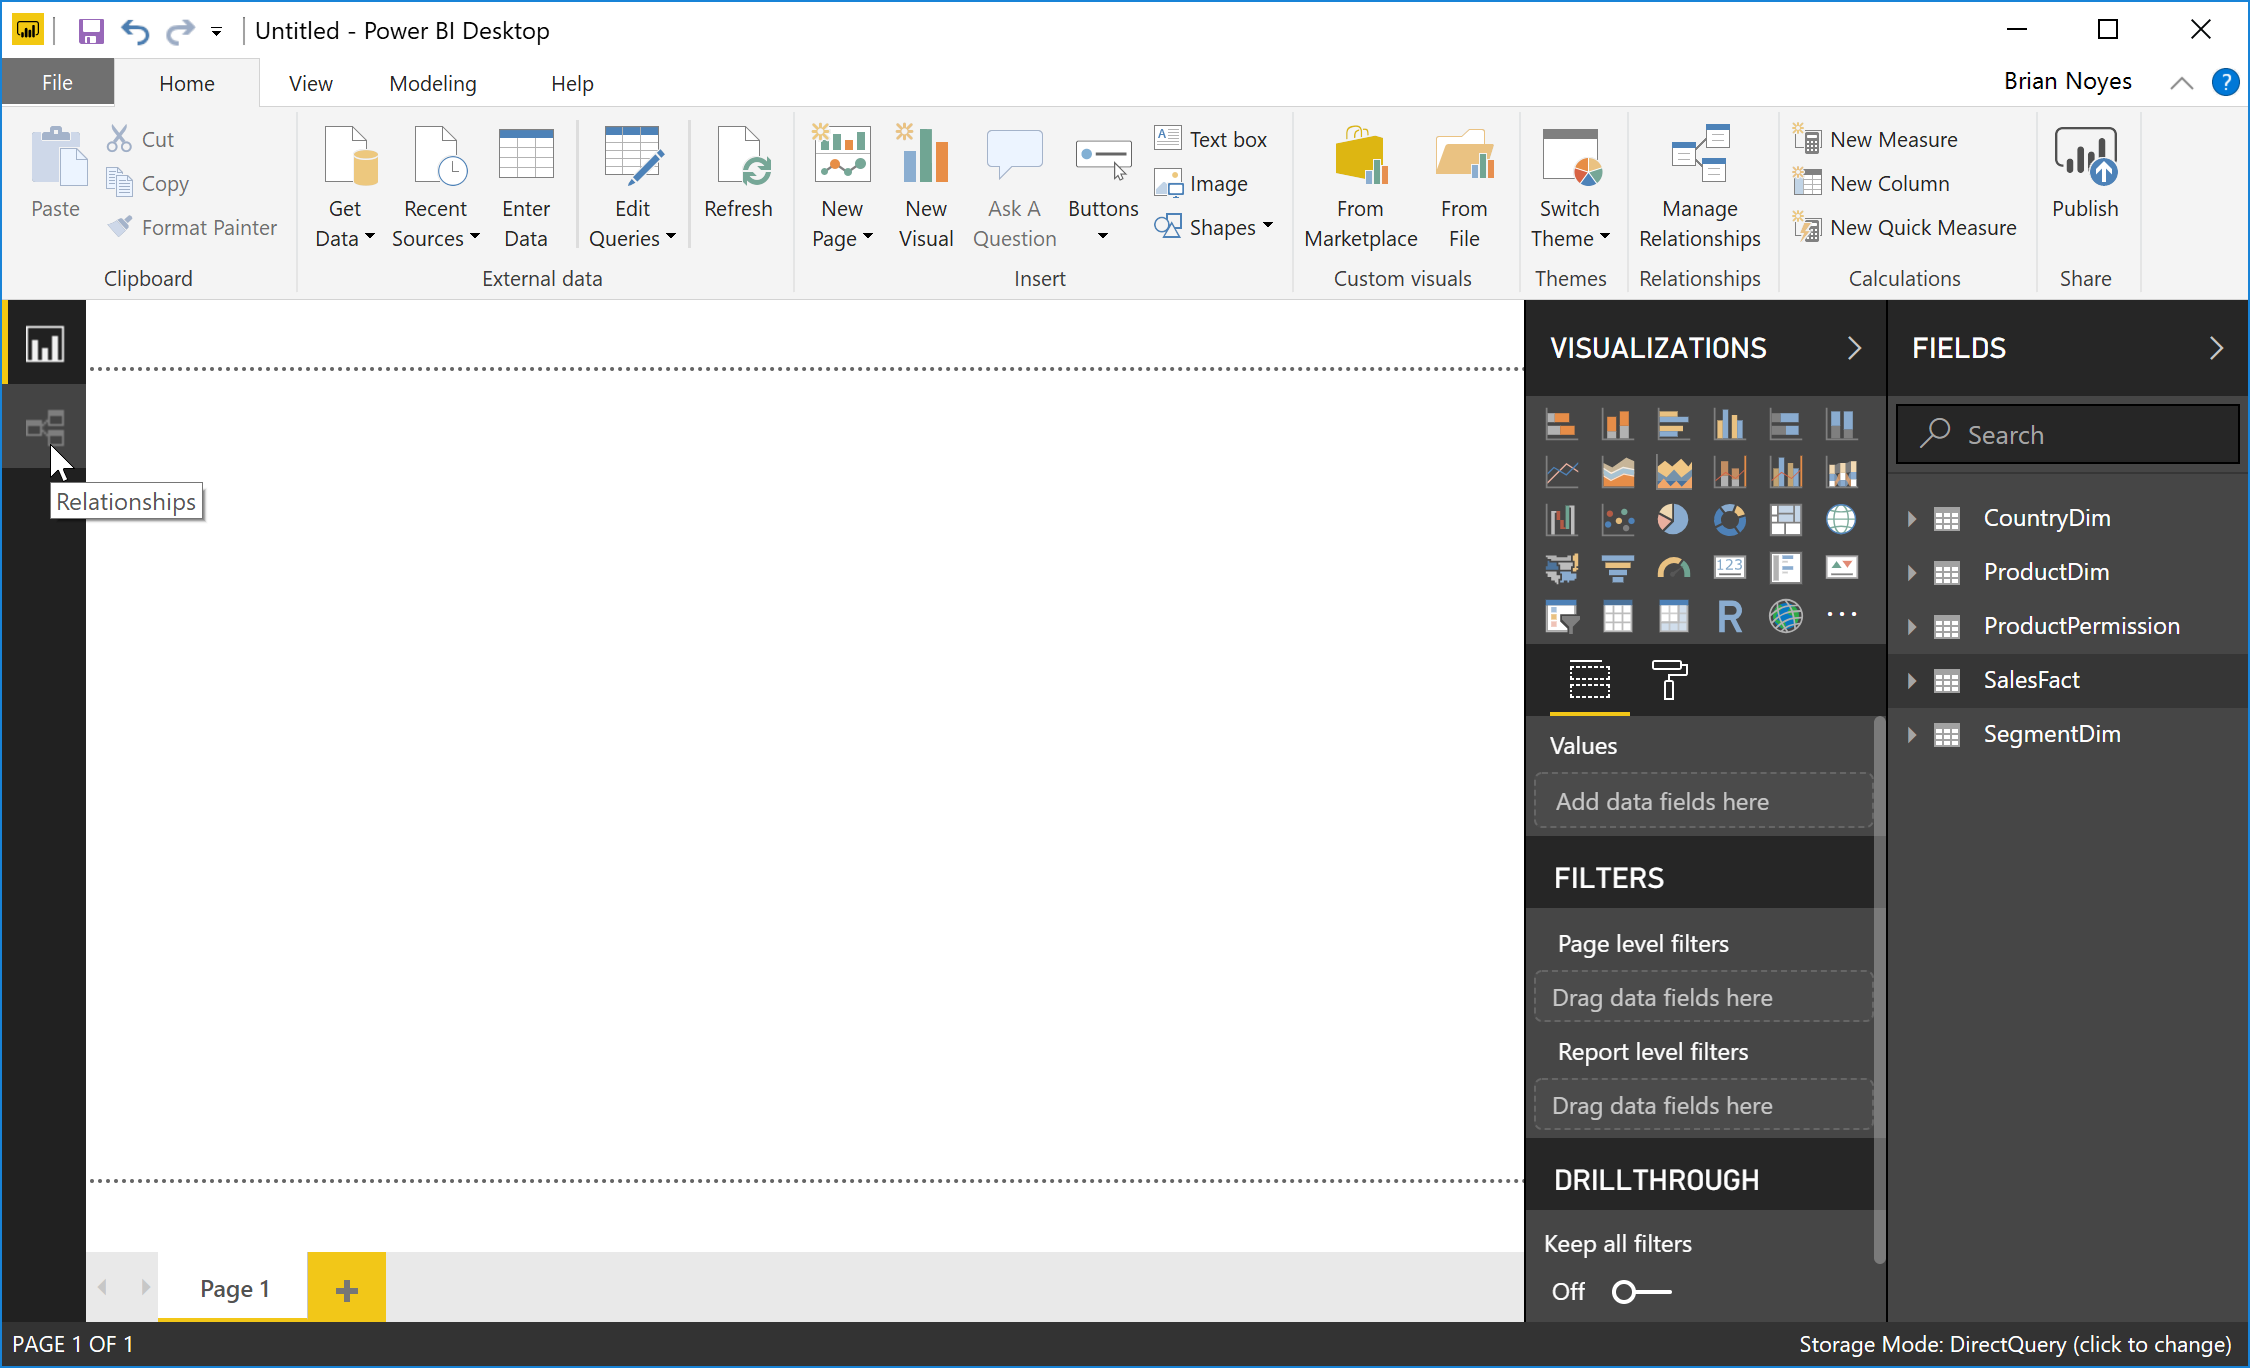
If your database has foreign keys defined between the tables, the designer can pick those up and set them as relationships in the data model. If it doesn't, you can just switch to the Relationships view, as shown in Figure 7, and define those quickly yourself.
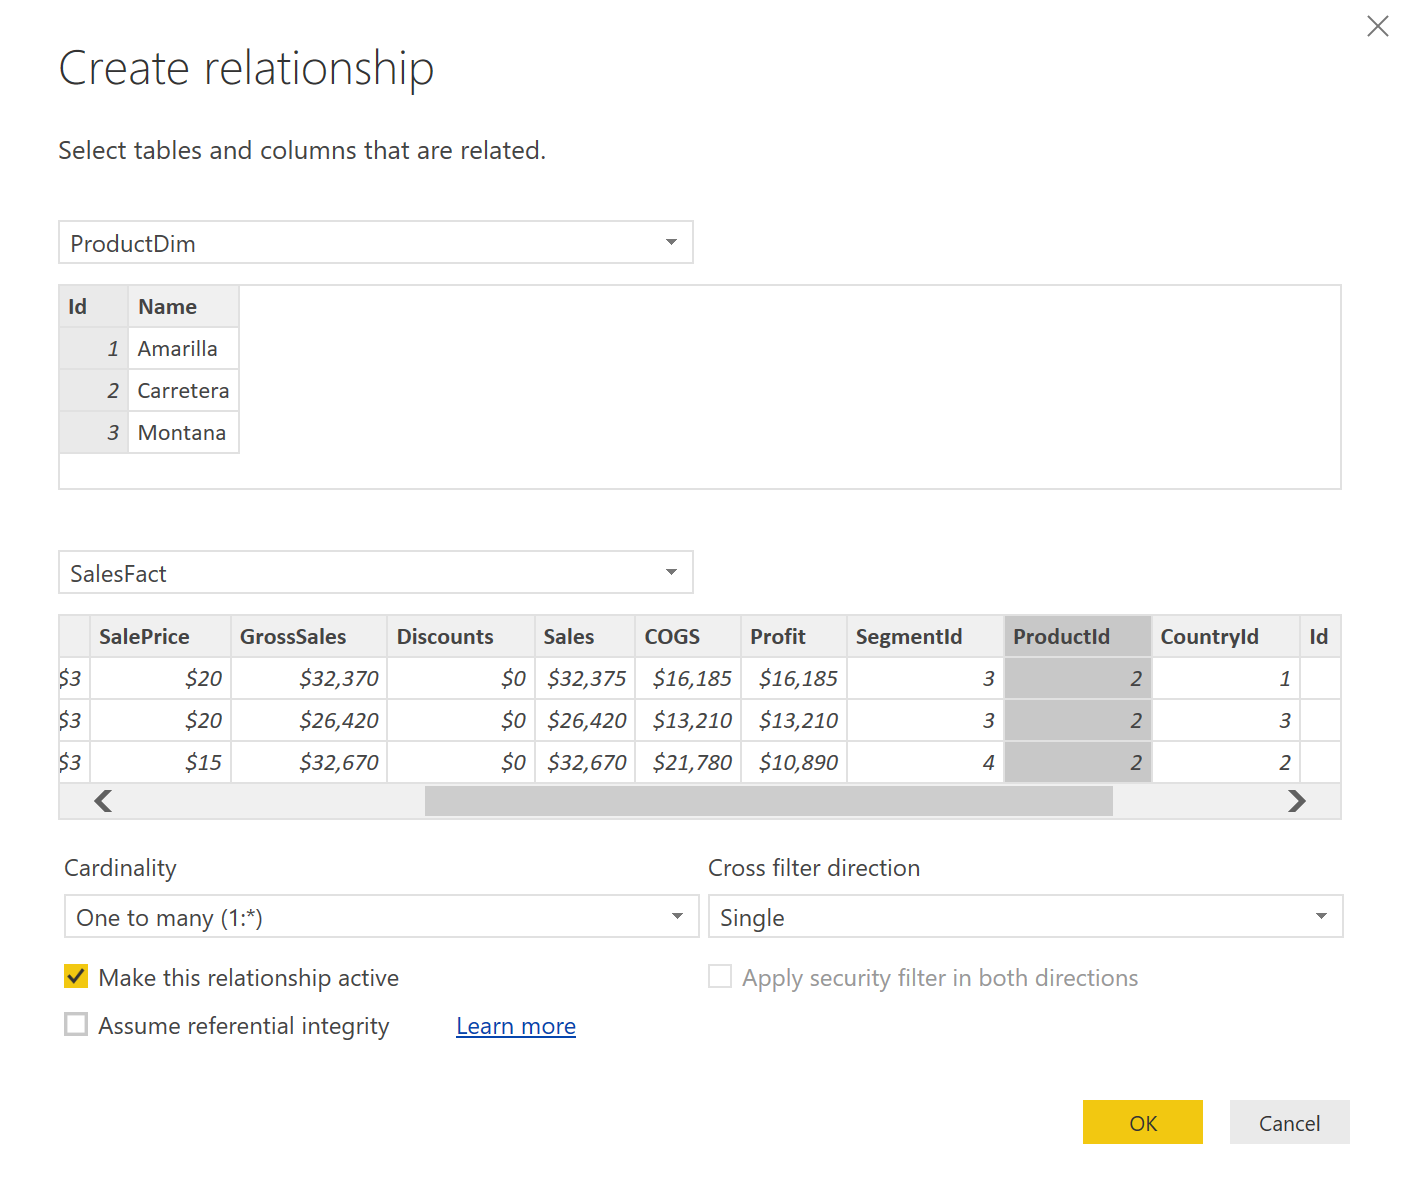
Once in the relationships view, you can drag the tables around and use drag-and-drop gestures to define relationships between the tables. To do so, you simply click and drag on a field in one of the tables and drop it onto the other table. The dialog shown in Figure 8 pops up and lets you select the columns that you're matching up and the direction of the relationship.
Once your relationships are defined, you can switch back to the Report view using the top tab on the left side of the designer.
Creating and Connecting Visuals
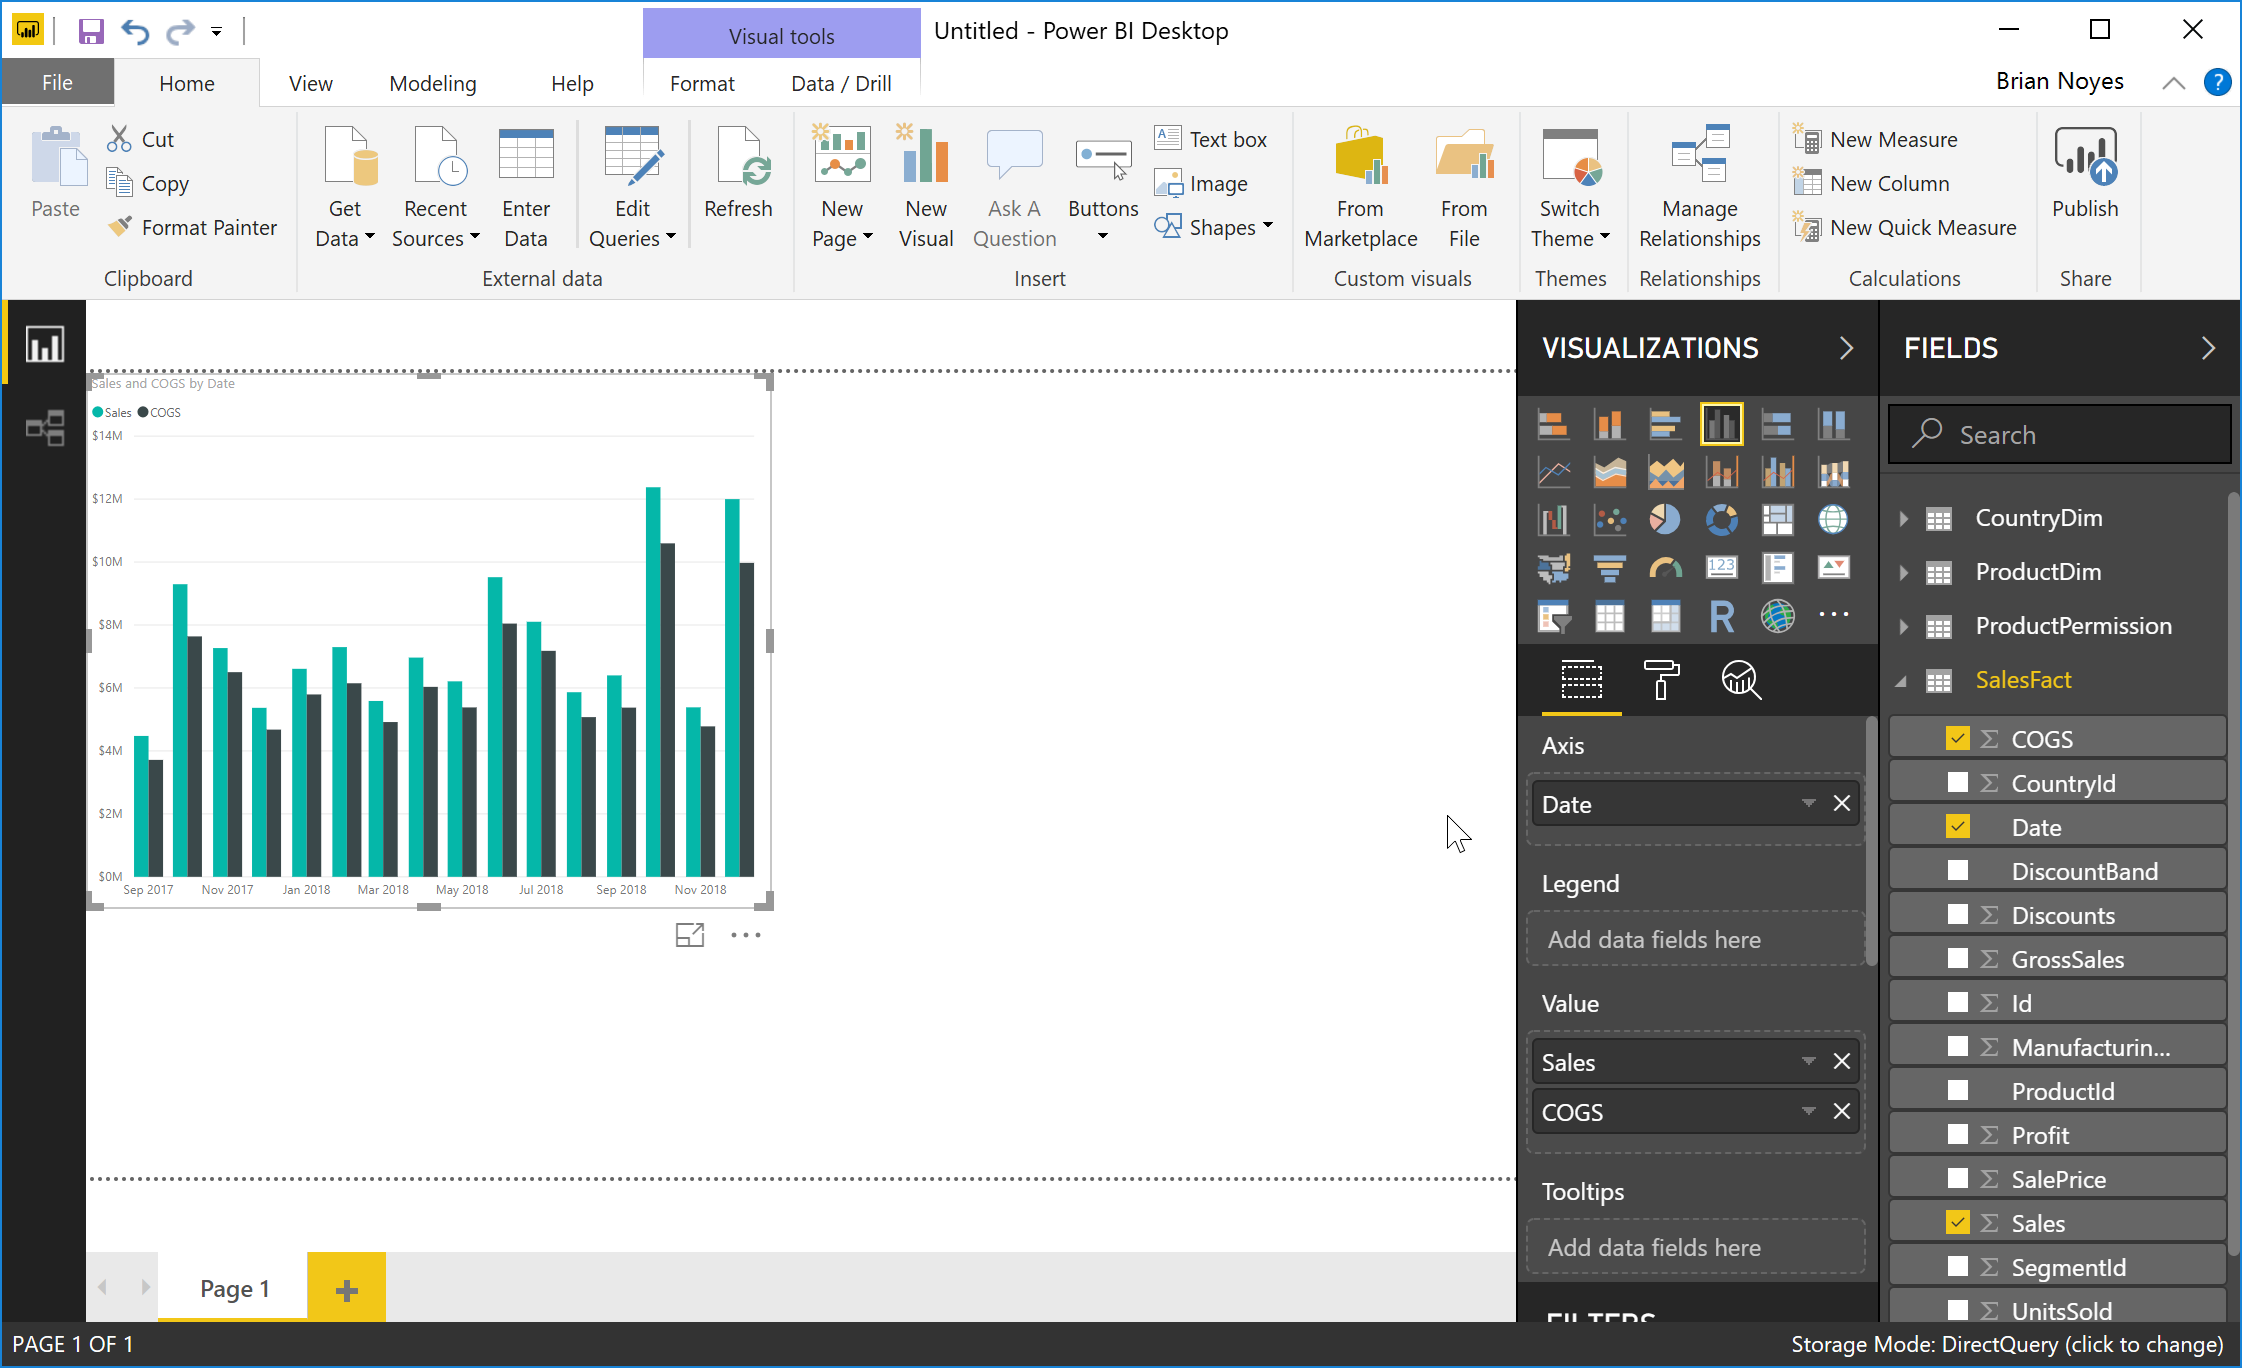
From there, I can pretty much drag-and-drop my way to a nicely defined report. For the sample report for this article, I created the first visual by doing the following:
- Expand the
SalesFacttable in theFieldspanel on the right. - Drag the
Salesfield from that table in theFieldspanel out onto the designer canvas. That creates a vertical bar chart visual by default with a single bar depicting the total of sales in that table. That drag-and-drop set theValuefield for the visual to theSalesfield of the table, which sets that field as the basis for the Y-axis of that bar chart. You can switch to other visual types by selecting them from theVisualizationspanel. - Drag the
Datefield from theSalesFacttable out on top of the visual just created. That sets the Axis field for that visual (the X-axis) to theDatefield. That also changes the rendering of the bars so that you get a bar for each month in the date field. - Drag the
COGSfield on top of the chart. That switches the visual type to a clustered bar chart with bars forSalesandCOGSat each month on the X-axis.
At this point, the report should look like Figure 9.
In a similar fashion, you can add other visuals and hook up the appropriate fields from the tables to expand to a multi-visual report. For the sample report for this article, I also created two “slicers.” These are created by dragging a field from a table out into the design canvas, and then selecting the Slicer visual type from the Visualizations panel. These are basically filter inputs, typically connected to some of the lookup tables in the data model (Product, Segment, and Country in the sample data), that allow the user to make selections in the report that will filter the data presented based on the selections.
The final report definition included and used for the rest of the article is the one shown back in Figure 1. Once the report is ready to go, you have to publish it to the Power BI service using the Publish button at the far right of the ribbon bar. To do that, you have to first create a Workspace in the Power BI service that you'll publish the report to. To do that, I go sign in to the Power BI Service (https://app.powerbi.com) and add a Workspace, as shown in Figure 10.
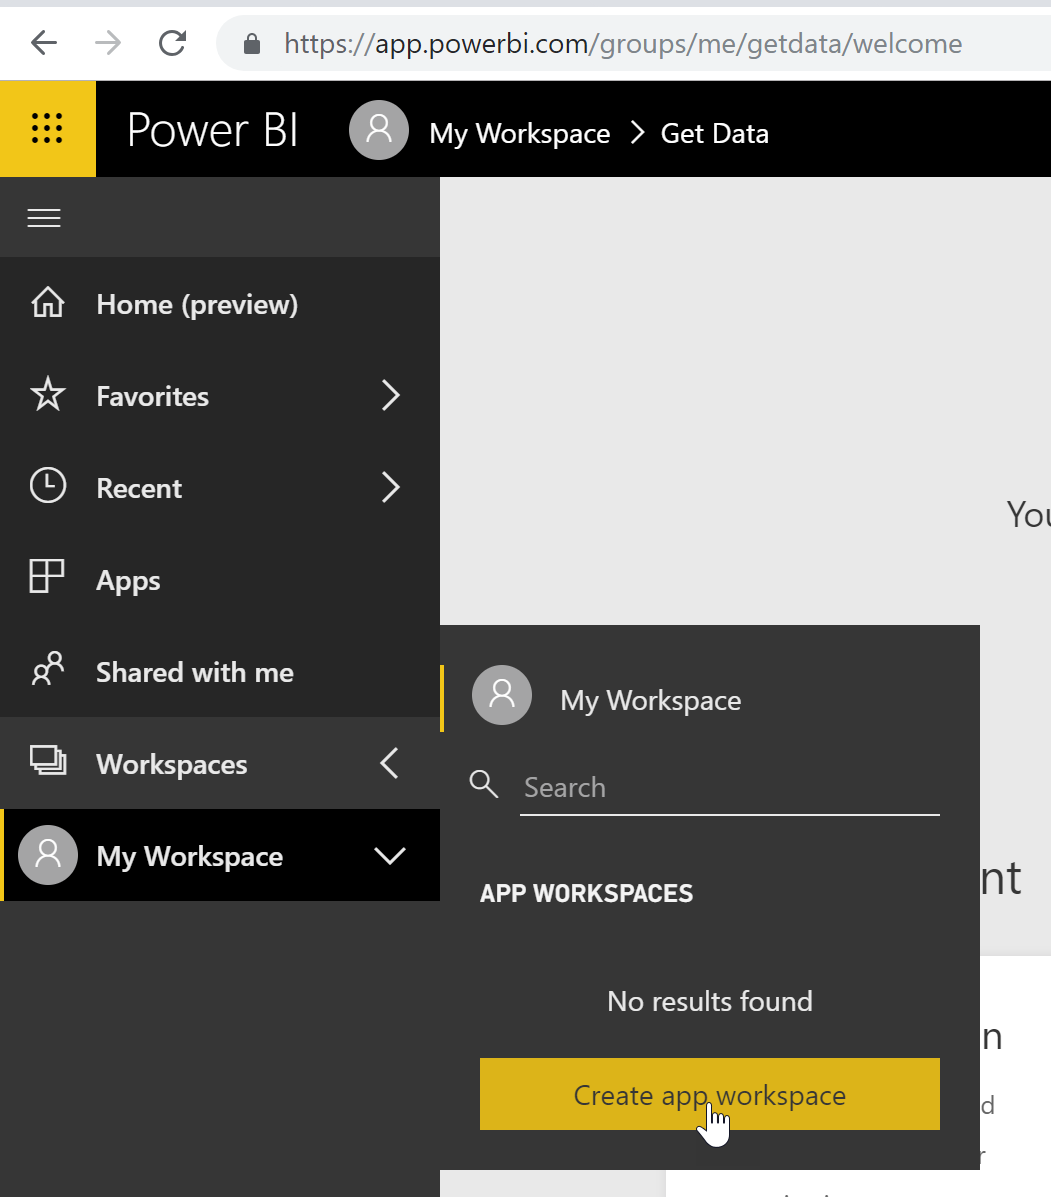
Creating a workspace basically just requires you to give it a name. Once you've done that, you can publish from Power BI Desktop and it'll give you a list of your workspaces to choose from to contain the report. Once you select one, it publishes to that workspace. At the completion of publishing, Power BI Desktop shows a warning about not being able to connect to the data source. This is because it doesn't want to blindly publish your report along with the database credentials embedded for security reasons. In the dialog with that warning, it has a link to go open the .pbix file in the Power BI Service. When you click on that, it opens the report in the Power BI Service portal and has a link for you to provide the database credentials to get it hooked back up to your data source from there.
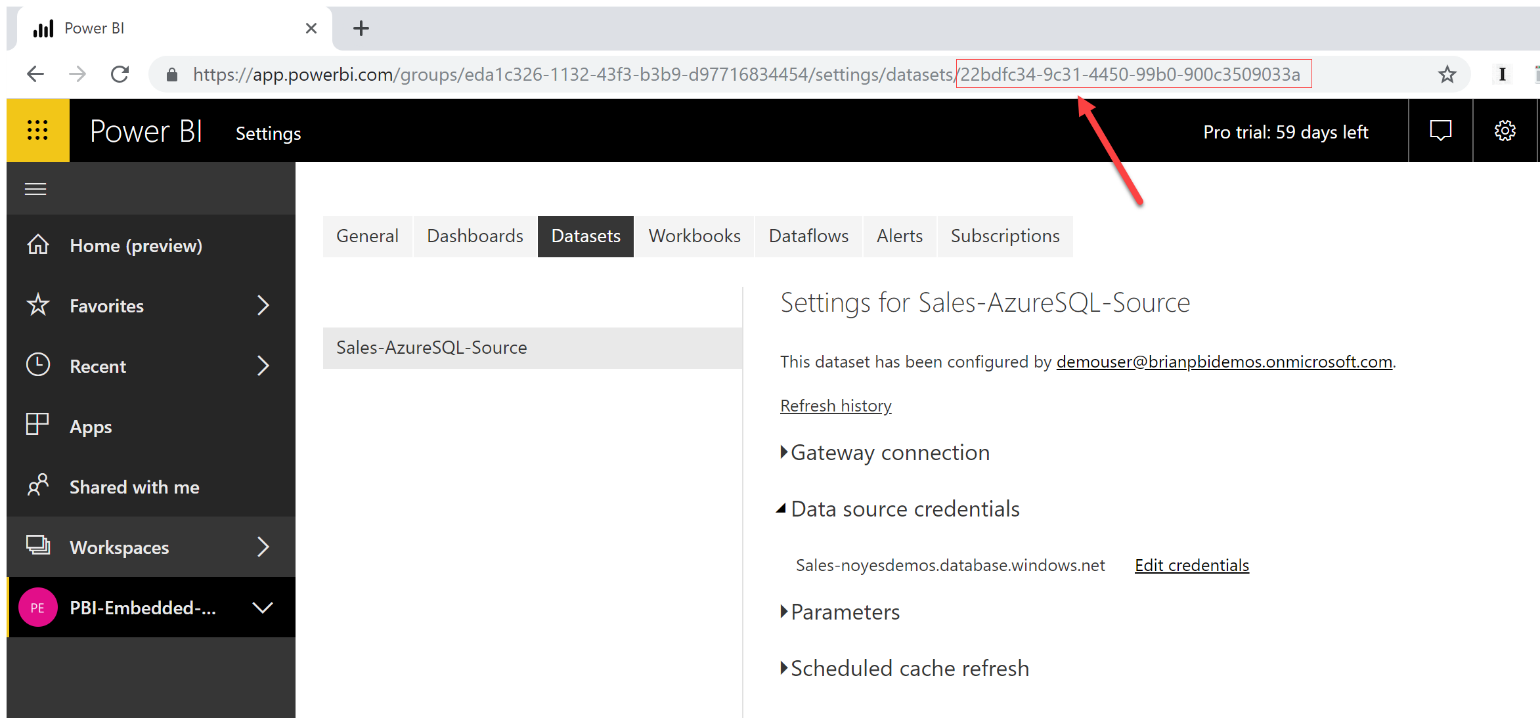
To do so, you select your workspace from the left navigation bar, and then it shows the view in Figure 11. Select Datasets in the menu along the top, click the ellipses (...), and select Settings.
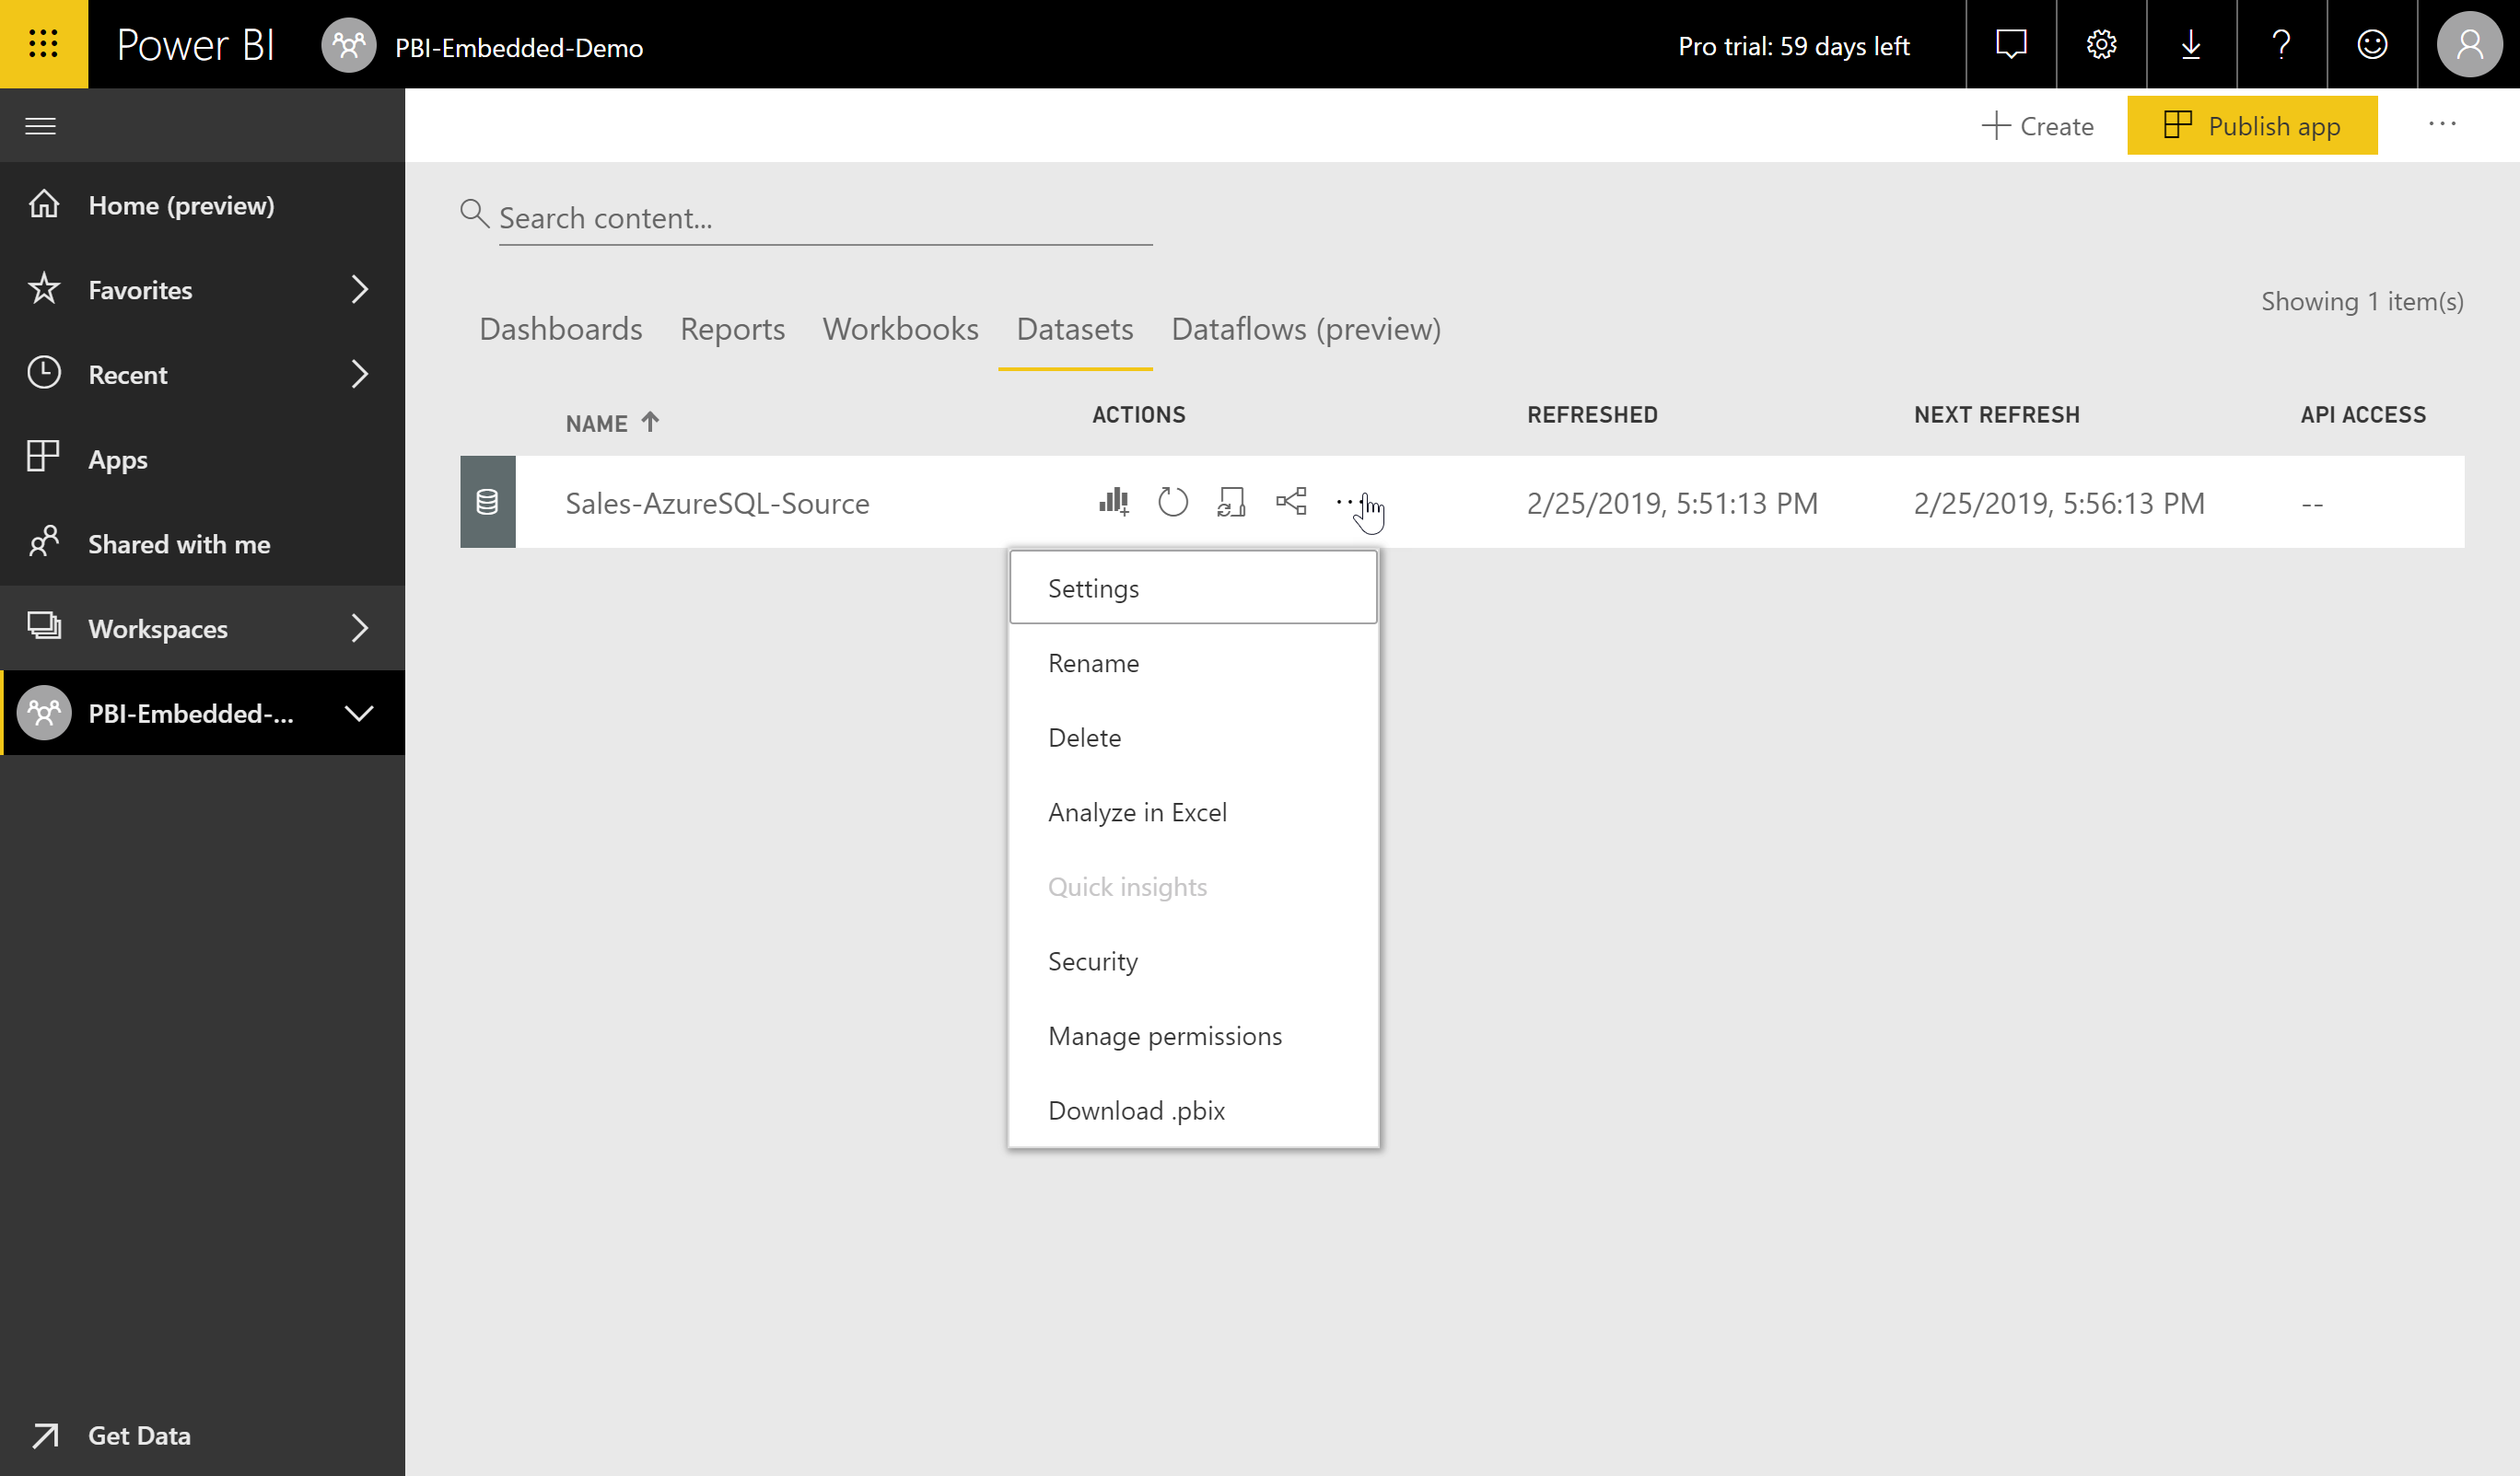
The dialog shows a link to edit credentials, and when you go into that, select “Basic” as the type of credential in the dialog in Figure 12.
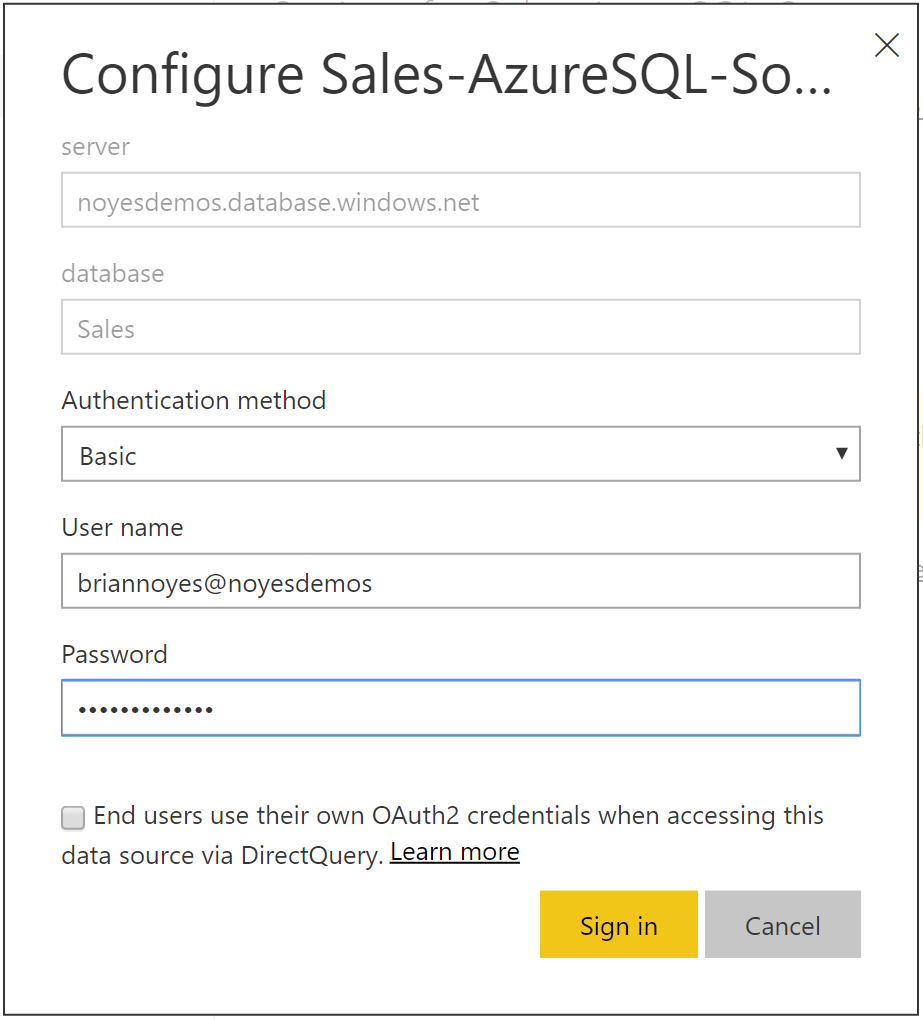
Enter your database username and password and click the Sign In button. While you are in the Dataset settings, take note of the Dataset ID in the address bar of the browser, as shown in Figure 13; you'll need this later to apply security filtering to the data set. Now your report should be ready to go for embedding.
Creating a Power BI Application
There's one more infrastructure step that you need to take to be ready to embed your report in an app. That's to register an application with Power BI. To do that, you can follow the steps in this help topic: https://docs.microsoft.com/en-us/power-bi/developer/register-app. In that process, select the option for a server-side Web app so that you get both an Application ID and an Application Secret generated for the app. Make sure to copy those down. Once you leave that page, you can't recover the application secret.
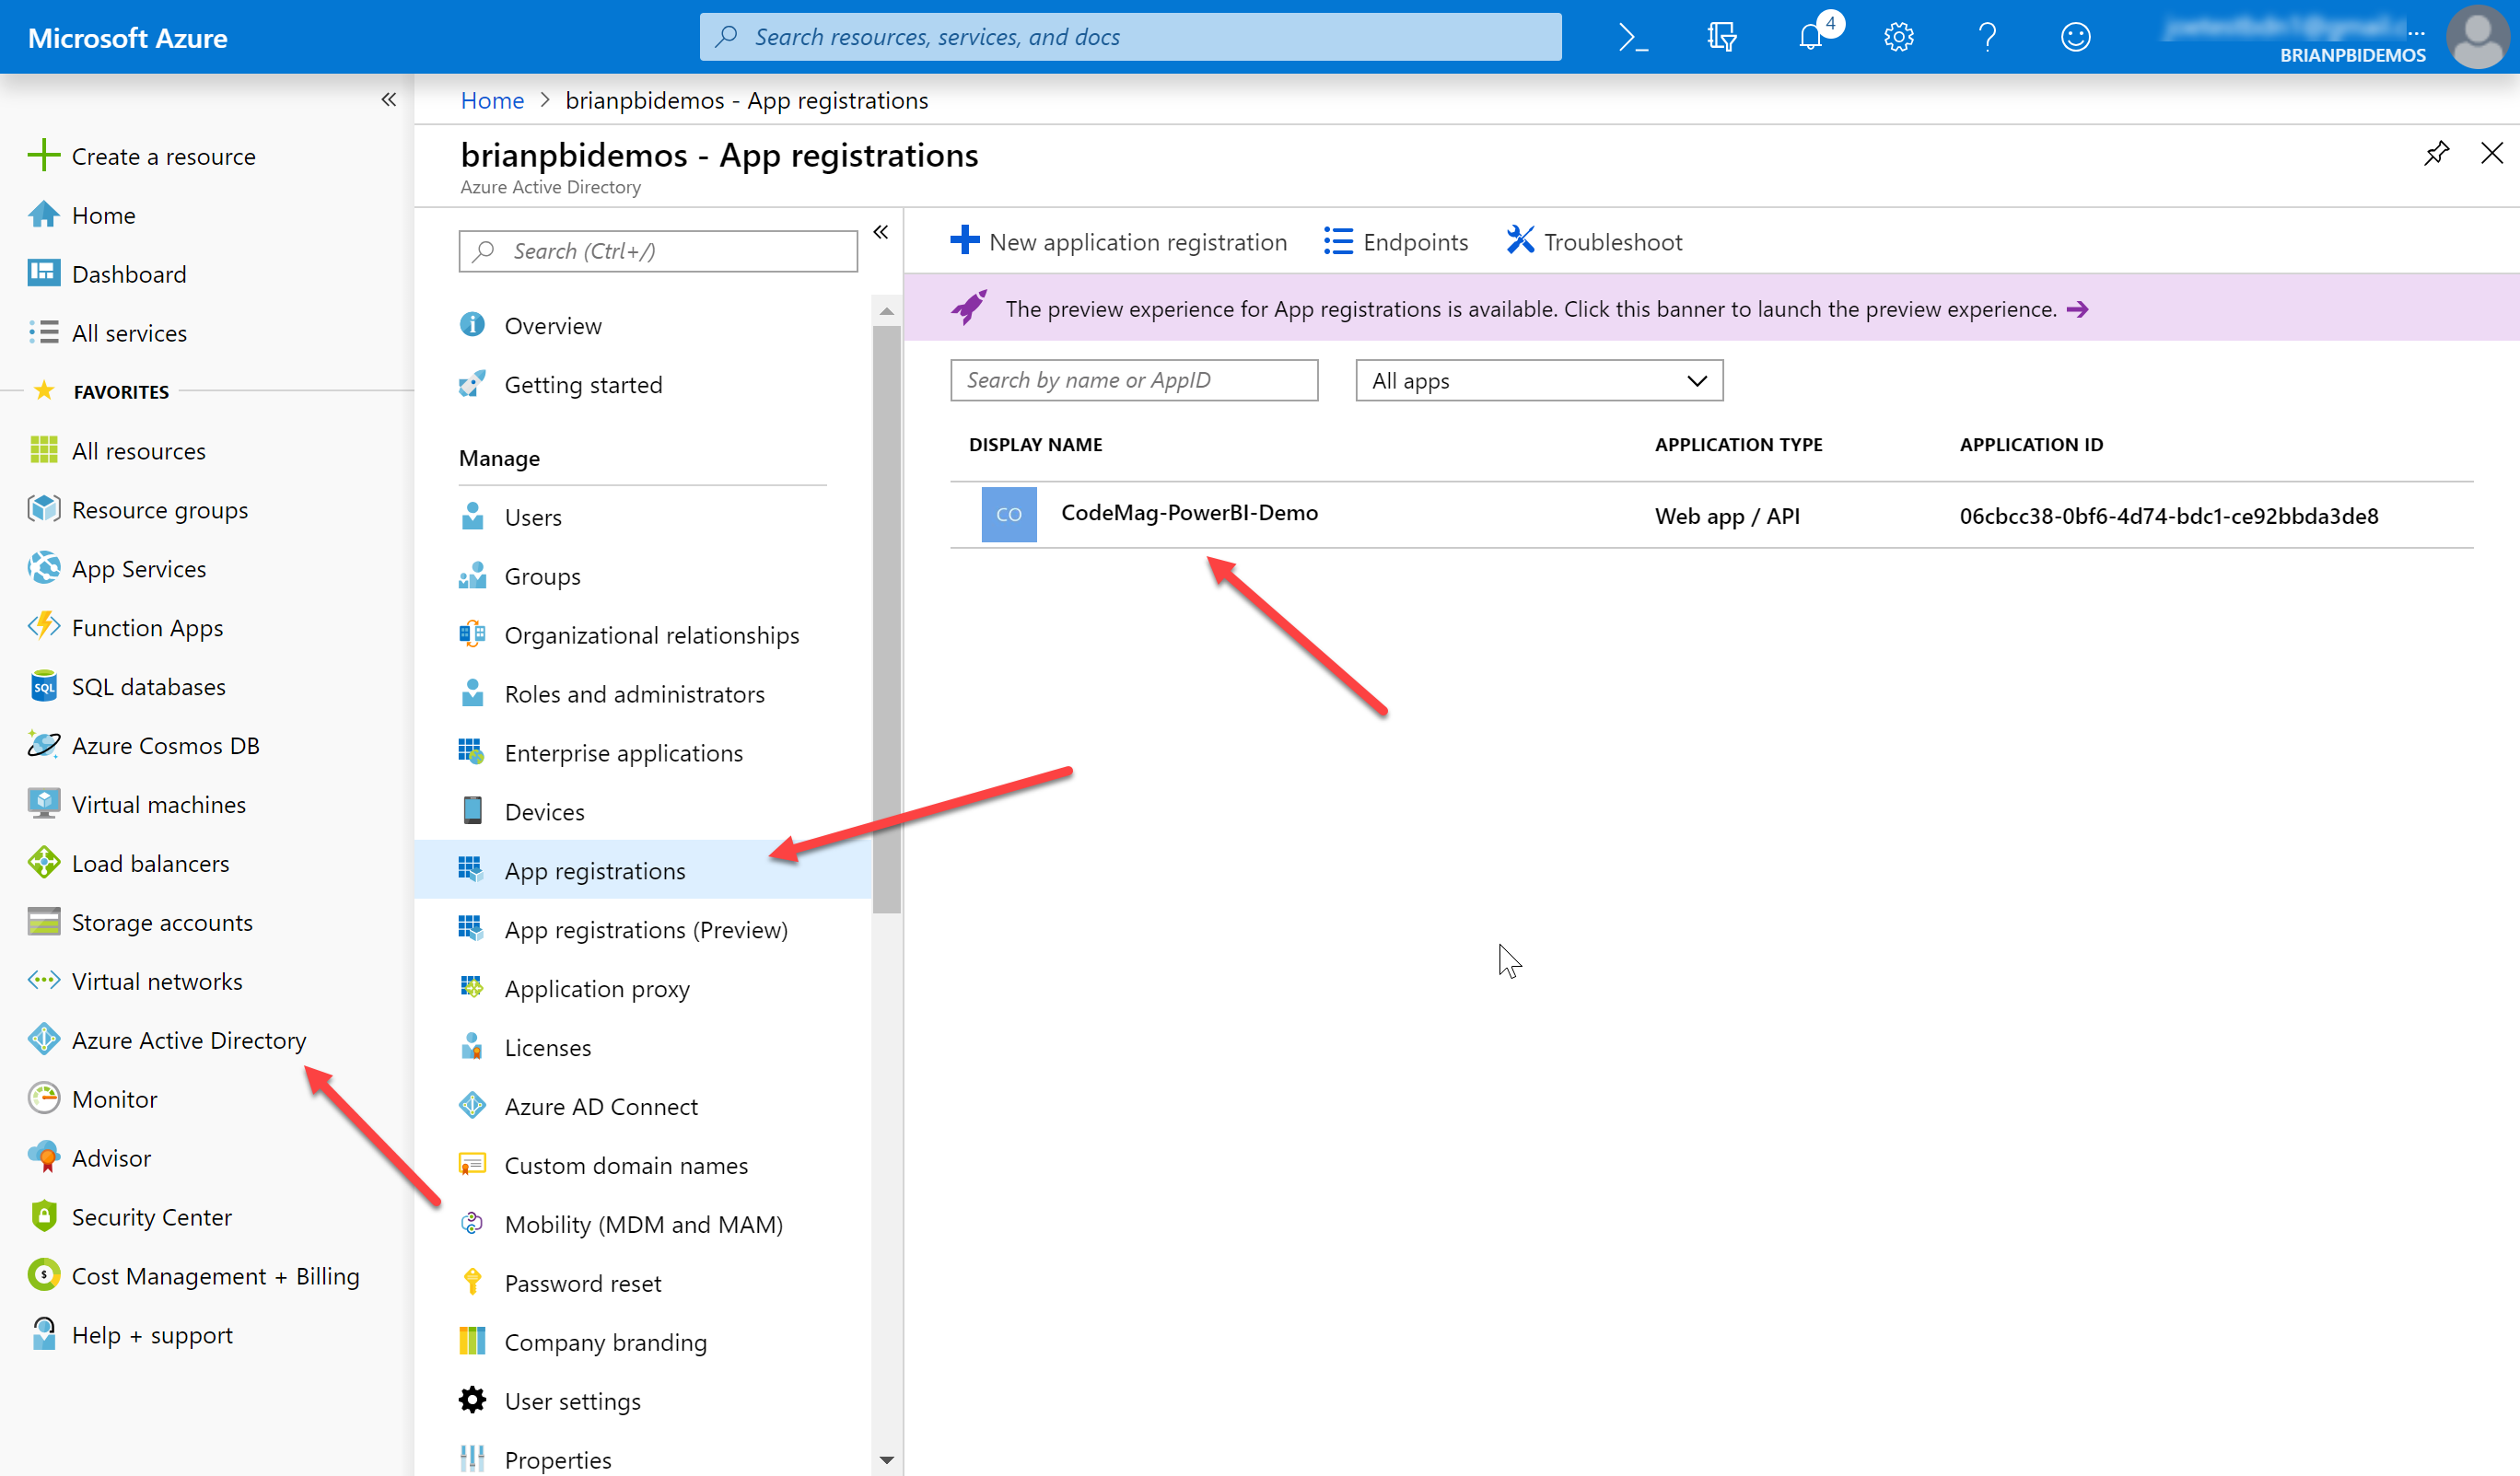
After the app has been registered, there's one more step to enable a non-interactive log-in by your back-end API to get an Embed token for Power BI - granting permissions. To do that, sign in to the Azure portal (https://portal.azure.com) and select Azure Active Directory from the list of services in the left navigation tab. Then select App registrations to find your app, as shown in Figure 14, and click on the app name to go into the blade for it.
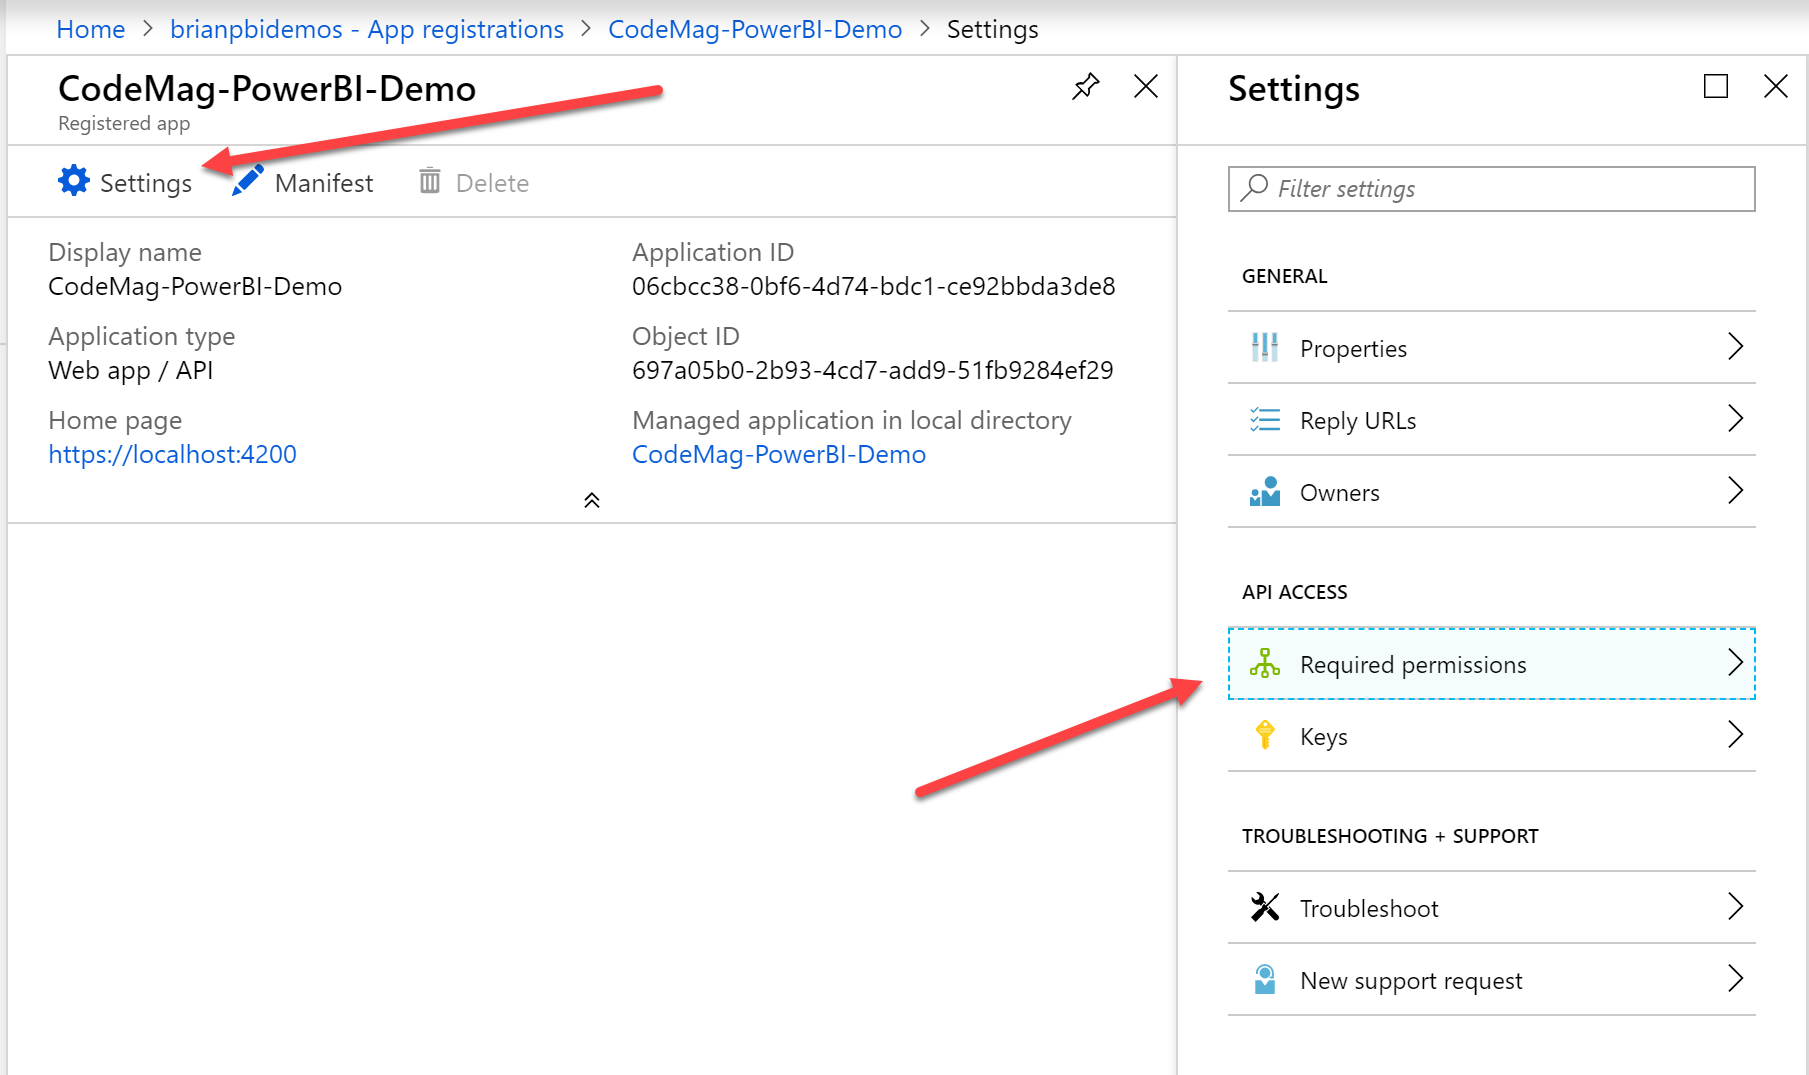
In the App registration blade, select Settings and then Required Permissions, as shown in Figure 15.
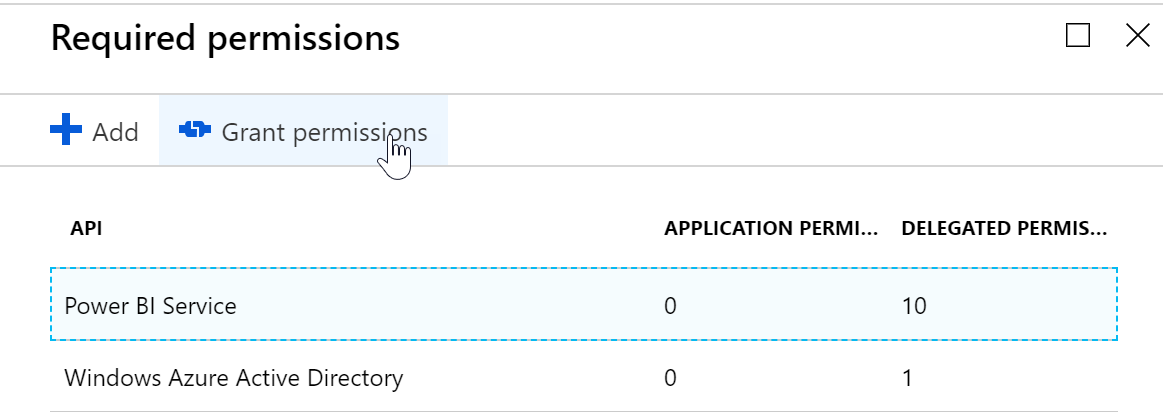
Once in the Required Permissions blade, click on the Grant Permissions button at the top, as shown in Figure 16. It pops up a message asking if you want to grant all permissions; click the Yes button to complete the permissions grant. Once you're done with that, you can close out the Azure portal.
Integrating a Power BI Report into Your App
Now that the registration dance is complete, your app definition, workspace, and report are ready to be embedded in an application. To complete the process, you'll need to do some back-end coding to authenticate your app with Azure Active Directory, and then call the Power BI service API to get an Embed token for your report. This is a token that allows an individual user to access the report within your application. Then you use that token in the client code where the embedding happens.
Getting an Embed Token for Your Report
Whether the page you're going to embed your report in is a server-rendered page, such as an ASP.NET MVC page, or a client-rendered view, such as an Angular View Component, you first need to obtain an Embed token from the Power BI service. To obtain an Embed token, your app needs to authenticate with Azure Active Directory. That needs to happen on the back-end because it requires using the Application Secret you obtained while registering your application, and there's no way to use that secret securely from the front-end code. Listing 1 shows the code for an API controller that authenticates and obtains an Embed token for your report and returns that to the client JavaScript that calls this API method. This code resides in an ASP.NET Core application. You'll need to add a couple of NuGet packages to your ASP.NET Core project to bring in the needed libraries for communications with the Power BI API:
- Microsoft.PowerBI.Api
- Microsoft.IdentityModel.Clients.ActiveDirectory
The ASP.NET Core API project for the sample code also exposes a data API so that the client application can also edit Sales records or add new ones; you can see that you can edit the data, refresh the report view, and see the changed data immediately in the report.
To obtain an Embed token, your app needs to authenticate with Azure Active Directory on the back-end because it requires using the Application Secret you obtained while registering your application.
Listing 1: Getting an Embed token for your report
[HttpGet("EmbedConfig")]
public EmbedConfig EmbedReport()
{
    EmbedConfig report = null;
    var proUserToken = AuthenticateAsync().GetAwaiter().GetResult();
    report = GenerateReport(proUserToken.AccessToken);
    return report;
}


private async Task<OAuthResult> AuthenticateAsync()
{
    var oauthEndpoint = new Uri(AuthorityUrl);

    using (var client = new HttpClient())
    {
        var result = await client.PostAsync(oauthEndpoint, new FormUrlEncodedContent(new[] {
            new KeyValuePair<string,string>("resource", ResourceUrl),
            new KeyValuePair<string,string>("client_id", ApplicationId),
            new KeyValuePair<string,string>("client_secret", ApplicationSecret),
            new KeyValuePair<string,string>("grant_type", "password"),
            new KeyValuePair<string,string>("username", MasterUsername),
            new KeyValuePair<string,string>("password", MasterPassword),
            new KeyValuePair<string,string>("scope", "openid")
        }));

        var content = await result.Content.ReadAsStringAsync();
        return JsonConvert.DeserializeObject<OAuthResult>(content);
    }
}

private EmbedConfig GenerateReport(string token, List<EffectiveIdentity> filters = null)
{
    EmbedConfig config = null;
    var tokenCredentials = new TokenCredentials(token, "Bearer");

    using (var client = new PowerBIClient(new Uri("https://api.powerbi.com"), tokenCredentials))
    {
        Report report = client.Reports.GetReportInGroup(WorkspaceId, ReportId);
        if (report != null)
        {
            var requestParameters = new GenerateTokenRequest();
            requestParameters.AccessLevel = "View";
            if (filters != null)
            {
                requestParameters.Identities = filters;
            }

            EmbedToken embedtoken = client.Reports.GenerateTokenInGroupAsync(WorkspaceId, ReportId, requestParameters).GetAwaiter().GetResult();

            config = new EmbedConfig();
            config.EmbedURL = report.EmbedUrl;
            config.GroupID = WorkspaceId;
            config.ReportData = report;
            config.ReportID = ReportId;
            config.Token = embedtoken?.Token;
            config.TokenID = embedtoken?.TokenId;
            config.Expiration = embedtoken?.Expiration;
        }
    }
    return config;
}
Embedding Reports into Your Client Apps
Now that you can get an Embed token to your client code, you can add the code to the client to embed the report wherever you want it to show up in your page or view. That code requires you to have the Power BI client library for JavaScript available to your client code. If you're just going to do this in a server-rendered Web page (i.e., ASP.NET MVC), you can just add a script tag to the page pointing to a downloaded or CDN-hosted version of the library. But you can also use the Node Package Manager (npm) to download the Power CI client library as well.
My first sample client for this article is a simple Angular 7 client application, created with the Angular CLI. It contains two views in tabs: a table of the values in the SalesFact table with the ability to add or edit items through a pop-up modal, and a tab where I'll integrate my Power BI report. I'm not going to go into details of creating the Angular app through the CLI or hooking up the data views because that's not the focus of this article. Instead I'll just focus on the code required to integrate the report into my view.
Because my sample application is an Angular 7 client, I pulled the powerbi-client library down using npm. So, within the client project folder I ran:
npm install --save powerbi-client
Once it's downloaded and referenced from my package.json file in the Angular app, I also need to get the library referenced in a way that makes the powerbi-client functionality accessible from wherever in my app I want to integrate it. With an Angular CLI client, the best way to do that is to add a reference to the library from the angular.json file scripts configuration in the root of your Angular app. For the powerbi-client library, add the path to the minimized libraries to the scripts array that is empty by default in the angular.json file.
"scripts": [
    "node_modules/powerbi-client/dist/powerbi.min.js", "node_modules/powerbi-models/dist/models.min.js"
],
Now I need to get the report rendered into a placeholder element within my app somewhere. For that, I've added a blank view component in my app named sales-report.component.ts (and sales-report.component.html for the markup), and placed that element into a tab in the root view.
The next step is to define an element that the report will be rendered into (as a child iframe by the powerbi-client library). I add a div element to my report component and give it a name with a hashtag to make it accessible from the code in the component:
<div #embeddedReport class="report-placeholder"></div>
Now I go into the sales-report.component.ts, define the component class, and use the ViewChild() property decorator to get a reference to that div into the component:
export class SalesReportComponent implements OnInit {
    @ViewChild('embeddedReport')
    embeddedReport: ElementRef;
    constructor() { }
    ngOnInit() { }
}
Now I just need a little code to instruct the powerbi-client library to embed the report into the div in that view after obtaining the Embed token from the back-end. That code is shown in Listing 2. After calling the API to get the Embed token, it creates a configuration object and passes that and a reference to the placeholder element to the embed method of the Power BI client.
Listing 2: Angular view component that renders the report
import { Component, OnInit, ViewChild, ElementRef } from '@angular/core';
import { HttpClient } from '@angular/common/http';
import { Constants } from '../constants';
declare var powerbi: any;

@Component({
    selector: 'app-sales-report',
    templateUrl: 'sales-report.component.html',
    styleUrls: ['./sales-report.component.scss']
})

export class SalesReportComponent
implements OnInit {
    @ViewChild('embeddedReport')
    embeddedReport: ElementRef;
    config: any;

    constructor(private httpClient: HttpClient) { }

    ngOnInit() {
        this.httpClient.get<any>(`${Constants.apiRoot}PowerBI/EmbedConfig`).subscribe(config => {
            this.config = config;
            const model = window['powerbi-client'].models;
            const embedConfig = {
                type: 'report',
                tokenType: model.TokenType.Embed,
                accessToken: config.token,
                embedUrl: config.embedURL,
                permissions: model.Permissions.All,
                settings: {
                    filterPaneEnabled: true,
                    navContentPaneEnabled: true
                }
            };
            powerbi.embed(this.embeddedReport.nativeElement, embedConfig);
        });
    }
}
Filtering Report Data Based on the User
At this point, anyone who can load the client app can see all the sales data. One last thing you'll often need to do with embedded Power BI reports is filter the data presented in the report based on who the authenticated user is and what data they should be able to see. Power BI includes a capability called Role-Based Security that lets you do this easily.
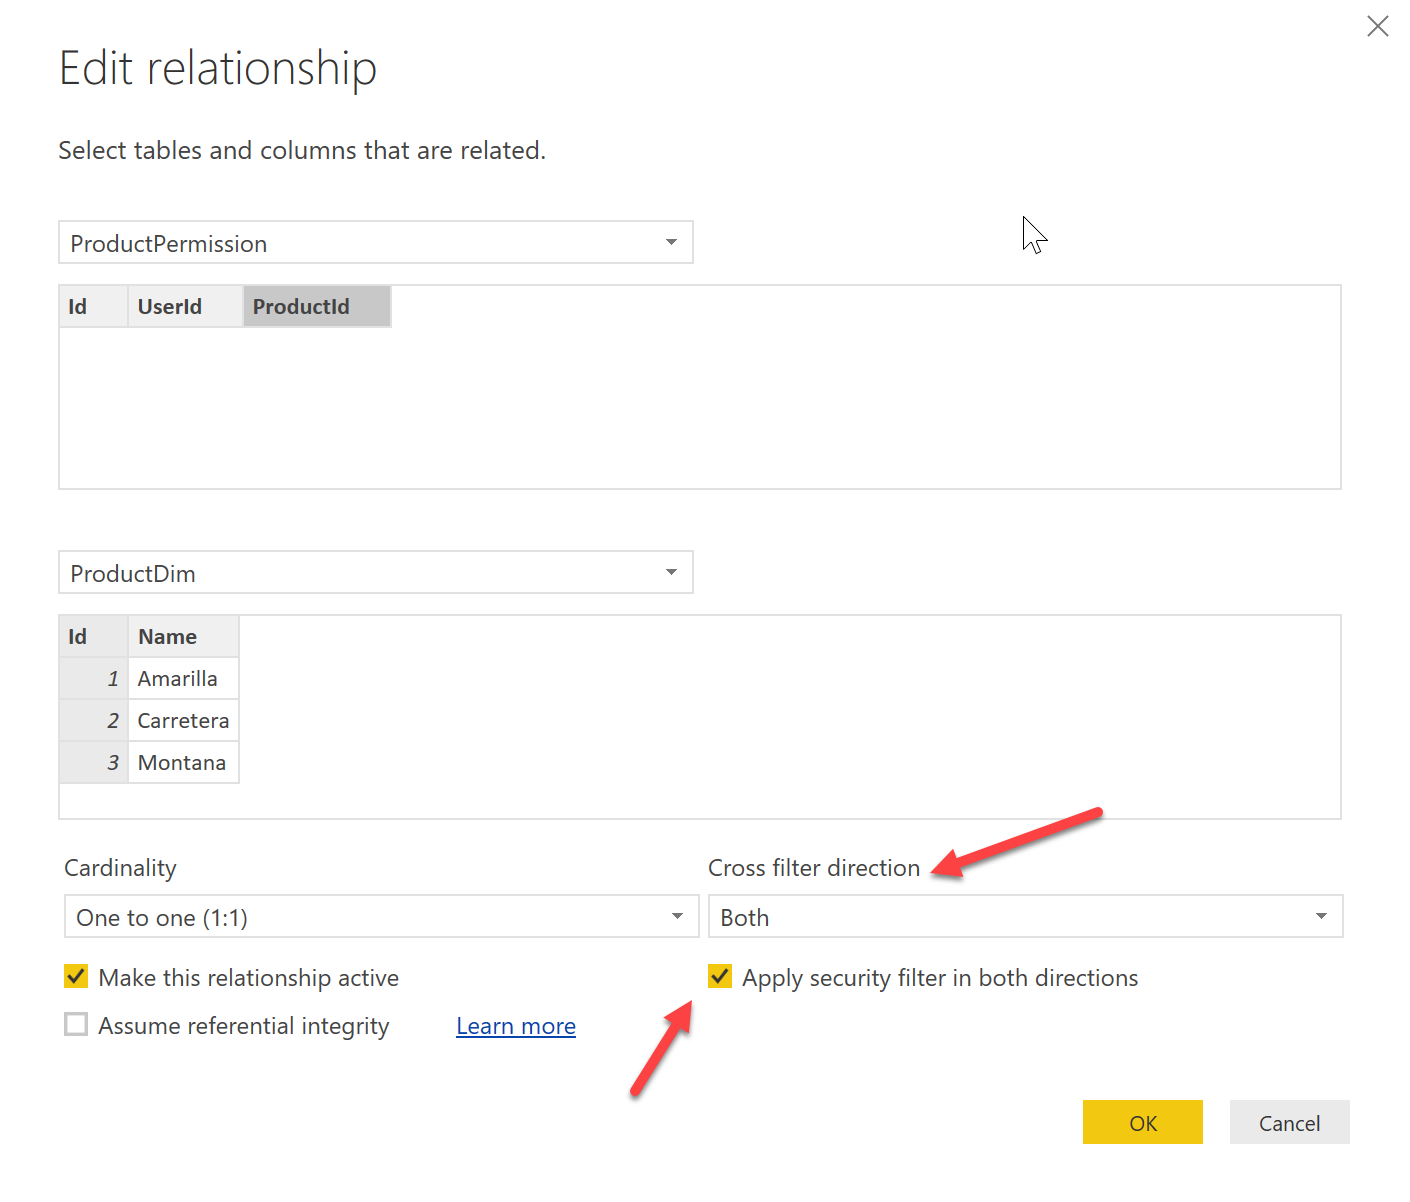
The first thing you'll need is a table in your data model that you can use to filter the primary reporting data (the SalesFact table in my sample) based on who the logged-in user is. I have that already in my model with the ProductPermission table. That table has a column for a user ID and one for a product ID. When you create the relationship between that table and the ProductDim table, you set the direction to Both and select the option to apply the security filter in both directions, as shown in Figure 17. This makes it so that when a filter is applied to the permissions table based on who the user is, it filters the rows in that permission table. That results in the ProductDim table being filtered to just the rows that match to permissions rows. And then that flows down into the SalesFact table to filter it down to only the rows for the products that the user has permissions to see.
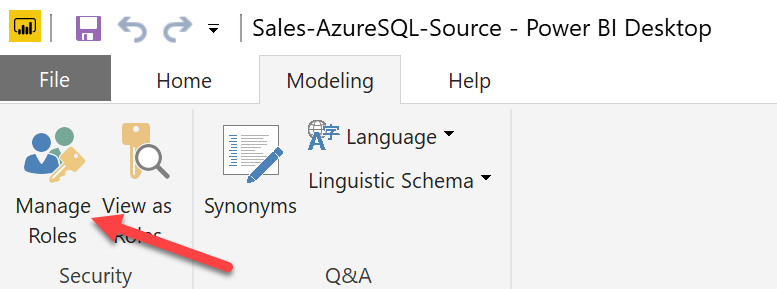
Next, you need to define a role associated with the logged in user so that Power BI can use that to apply the filtering. To do so, select the Modeling tab of the ribbon in Power BI Desktop and click the Manage Roles button shown in Figure 18.
That brings up the dialog shown in Figure 19.
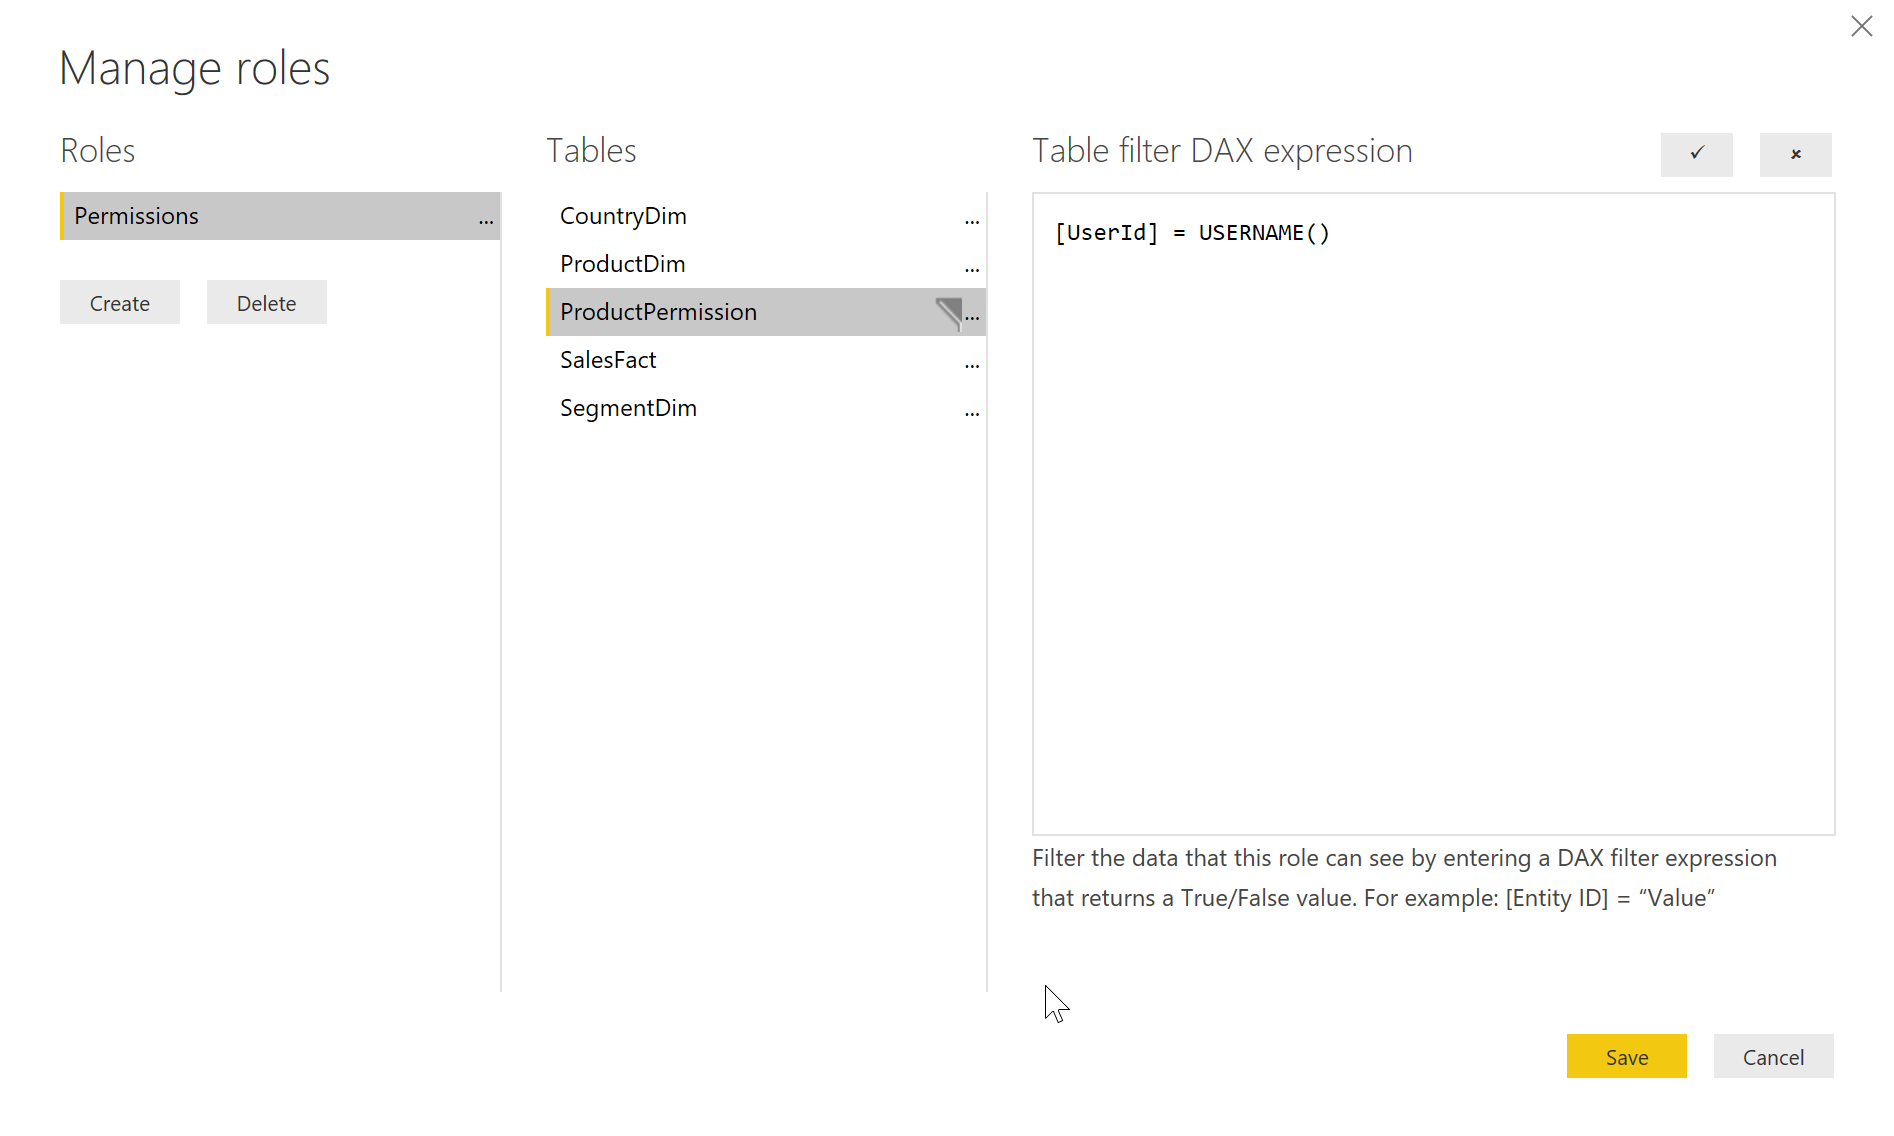
Click the Create button to create a new role and name it Permissions. Select the ProductPermission table and for the filter expression, set it to:
[UserId] = USERNAME()
The USERNAME function is a built-in function in Power BI that allows you to pass a token, which could be any string, down into the Power BI queries that are run. Once you make those changes to the data set in Power BI Desktop, save your changes, and then re-publish the report.
To populate the value that the USERNAME() function produces, you need to add a couple more parameters when obtaining your Embed token on the back-end. To keep things simple for the demo, I'm not going to set up real authentication for the user. Instead, I'll fake it by allowing the client app to pass in a user ID as a query string parameter and use that as if it were obtained by the back-end through authentication. In a real app, you'd need to set up authentication for your API and obtain the user ID on the back-end based on the authenticated user. If you want to learn more about how to do that in an Angular application, check out my Pluralsight course “Securing Angular Apps with OpenID Connect and OAuth 2” (https://app.pluralsight.com/library/courses/openid-and-oauth2-securing-angular-apps).
In the API code that gets the Embed token, I just need to add a little more code to create a collection of EffectiveIdentity objects to pass in to the Power BI API.
List<EffectiveIdentity> filters = new List<EffectiveIdentity>();
filters.Add(new EffectiveIdentity
{
    Username = Request.Query["userId"],
    Roles = new List<string> { "Permissions" },
    Datasets = new List<string> { DatasetId }
});
report = GenerateReport(proUserToken.AccessToken, filters);
Once I've added that code, I can go to my ProductPermission table and add a couple of rows with a user ID of briannoyes and product IDs for the Paseo and Velo products. Then I go to the client code that calls the API to get the Embed token, and pass in a user ID in the query string:
this.httpClient.get<any>(${Constants.apiRoot}PowerBI/EmbedConfig?userId=briannoyes`).subscribe(config => { ... });
Finally, the report is rendered in my app again but now with the data filtered to only show the sales for the Paseo and Velo products, as shown in Figure 20.
Integrating a Power BI Report into an ASP.NET Core MVC App
If you want to do the same things I've shown so far but you want to integrate the reports into an ASP.NET Core MVC application, the good news is that there's very little difference from what I have already covered. All of the code in Listing 1 except the EmbedReport API method is exactly the same if you're going to embed into an MVC page. You just need a slightly different Controller method to get the Embed Token and pass it to your MVC view so it can render the report. For this example, I'll just hard-code a username, but again, all you'd do differently in a real secured app is to get the user name or ID from your authentication mechanism, such as from the ClaimsPrincipal in an ASP.NET app.
To get the Embed token and pass it to the MVC view, I first go to the Controller and action method for the view, and then have code almost identical to the EmbedReport API method in Listing 1, just passing the resulting Embed token and configuration to the view instead of returning it from the API method.
public IActionResult Index() {
    var proUserToken = AuthenticateAsync().GetAwaiter().GetResult();
    List<EffectiveIdentity> filters = new List<EffectiveIdentity>();
    filters.Add(new EffectiveIdentity
    {
        Username = "briannoyes",
        Roles = new List<string> { "Permissions" },
        Datasets = new List<string> { DatasetId }
    });
    var report = GenerateReport(proUserToken.AccessToken, filters);
    return View(report);
}
Then you can see the minimal MVC view code required to host the report in Listing 3. With that code in place, you get the embedded Power BI report rendered out in your MVC page.
Listing 3: MVC View code for embedding report
@model EmbedConfig
@{
    ViewData["Title"] = "Power BI Report";
}
<div class="report-container">
    <div class="report-body">
        <div id="reportContainer" class="report-placeholder"></div>
    </div>
</div>

<script src="/js/node_modules/powerbi-client/dist/powerbi.min.js"></script>
<script>
    const pbiModels = window['powerbi-client'].models;
    const embedConfig = {
        type: 'report',
        tokenType: pbiModels.TokenType.Embed,
        accessToken: '@Model.Token',
        embedUrl: '@Model.EmbedURL',
        permissions: pbiModels.Permissions.All,
        settings: {
            filterPaneEnabled: true,
            navContentPaneEnabled: true
        }
    };
    powerbi.embed(document.getElementById('reportContainer'), embedConfig);
</script>
Wrapping Up
I've covered a lot of ground here. You've learned about some of the provisioning that has to happen to get started working with Power BI. You've learned about the different ways that users can experience Power BI, including through Power BI Desktop, Power BI Service, Power BI Mobile, and embedded in your own applications. You've seen the basics on how you pull data into Power BI from a database, how you can massage that data model to get it into the shape you need for connecting to report visuals, and how to add visuals to a report and connect them to your data. Then you saw how you can integrate those reports into your client applications with some fairly boilerplate code on the back-end to obtain an Embed token from the Power BI service, and then use the powerbi-client library to place the embedded report into your UI on the client side, whether that's a SPA client with a framework like Angular or a server rendered page like ASP.NET Code MVC. Finally, you saw how to leverage the Row Level Security feature of Power BI, combined with passing a user identity into the report so it can filter the data based on who the user is and what they should be allowed to see.
Power BI is a great platform for data visualization and being able to present Power BI reports and dashboards in your own apps means you can deliver polished reports to your users with a fairly small time investment.