By Clive Tong and Chris Hurley, Red Gate Software, Oct 15, 2013
Writing in C# every day, we forget that we are in a privileged world. Underneath the abstraction of the virtual machine lies a batch of C++ code that is handling memory in the old fashioned way. Blocks of memory are allocated by asking a heap manager for a chunk of memory - you get a pointer to it and you can do exactly what you want with that memory. There's no associated type controlling your access to the memory and you're free to do what you like with it. Unfortunately that also means that you can write outside its bounds, or over any header that the heap manager has associated with the block. You can free the block and continue to use it too. All of these problems can lead to spectacular crashes.
Over time, patterns have been developed to handle some of these issues. C++ programs for example often encapsulate memory allocation using the RAII pattern, where blocks of memory are allocated for a particular lexical scope within the program. When the scope is exited, the destructor on a stack allocated object can ensure that the memory is released, and the object's API can ensure that the programmer does not get unrestrained access to the raw memory itself.
But that's a different story.
How unmanaged memory works, and when you use it
There are two ways to allocate unmanaged memory from .NET - by using the VirtualAlloc and VirtualFree functions, or by using AllocateHeap.
VirtualAlloc/VirtualFree lets you reserve a region of (4K) pages. You can choose between reserving chunks of the virtual address space, and allocating actual physical memory. The AllocateHeap API provides a heap manager that deals with small blocks of memory. This takes care of grabbing chunks from the operating system and handles memory management to avoid problems like fragmentation.
The C Runtime Library then has malloc and free functions that operate at a higher level, allowing it to do additional bookkeeping and debugging while keeping things portable.
Together, these tools let you manipulate unmanaged memory from within your managed application. There are essentially four different uses for that:
Heaps for the garbage collector, on which the managed objects live.
Data structures that the managed runtime uses to run the managed code. This includes space taken up by JITted code as well as other metadata.
Resources associated with managed objects, particularly those required for interoperability with the operating system, such as bitmaps.
Memory used by unmanaged components which are used by your managed code, e.g. third-party COM components.
Processes operate entirely within their virtual memory space, and do not usually control where the regions of memory they are using reside. The operating system manages which regions of virtual memory are held in physical memory (comprising the process' working set) and which exist only on the hard drive. Additionally, pages in virtual memory may either be private, meaning they are accessible only to a particular process, or be shareable between multiple processes. Assemblies, DLLs, and mapped files can be shared, but the .NET heaps, JITted code, and most other run-time data is private.
How much is being used by what?
By default, Windows Task Manager shows the size of the private working set of a process, which consists of those memory pages which are both private and reside in physical memory. Pages may be moved in and out of the working set dynamically by the operating system, depending on how they are accessed and the amount of physical memory available.
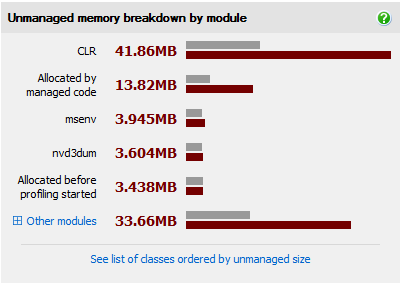
ANTS Memory Profiler (www.red-gate.com/products/dotnet-development/ants-memory-profiler) shows a breakdown of the total number of private bytes in virtual memory in a pie chart on the summary screen, regardless of whether they are in physical memory or not. The "unmanaged" section of the pie chart therefore includes JITted code, CLR metadata, and other unmanaged resources and memory allocations which are not shareable.
The CLR itself must allocate unmanaged memory to run your application. Some of this is for the garbage collector heaps that the objects are created on, which are displayed on the pie chart in ANTS Memory Profiler. The objects that you see in the class and instance lists all reside within these heaps. The CLR also requires unmanaged memory to store JITted code and perform internal bookkeeping. As a result, in applications which do not make significant use of unmanaged components, the CLR is usually responsible for the majority of the unmanaged memory allocation. You can see this in the unmanaged memory breakdown on the summary screen when unmanaged profiling is enabled.
How much is too much?
It is normal for the CLR to allocate memory as you start your application, but continual growth of the CLR's allocations when an operation is repeated may indicate a memory leak. An example of this being the repeated creation of new dynamic assemblies, each of which contains code which must be JITted and for which the CLR must allocate more memory.
Use of framework classes, which are associated with unmanaged resources, may also allocate unmanaged memory. For example, creating a new Drawing.Bitmap from a file causes a P/Invoke call to be made to the unmanaged GDI+ function GdipCreateBitmapFromStream:
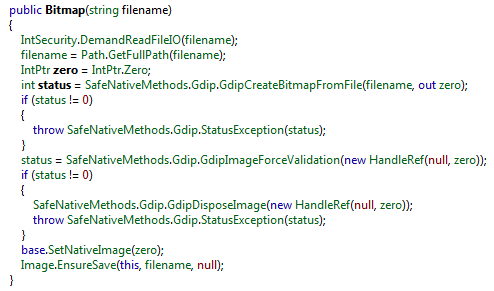
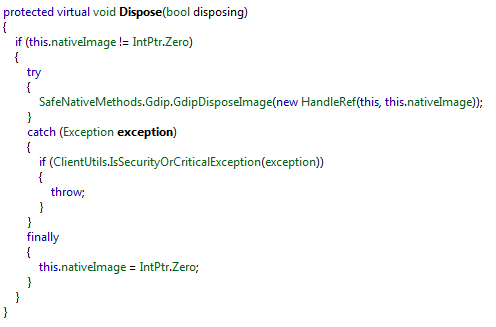
This function causes unmanaged memory to be allocated, so there's somewhere to store the resulting bitmap - as well as some associated metadata. It also returns a pointer to the location where this can be found in the virtual memory. This pointer (marshalled to IntPtr in .NET) is used to refer to the image when communicating with GDI+, and must ultimately be used to free the associated unmanaged memory when the bitmap is no longer needed. This occurs in the Dispose method of Drawing.Bitmap's base class, Drawing.Image, which calls GdipDisposeImage:
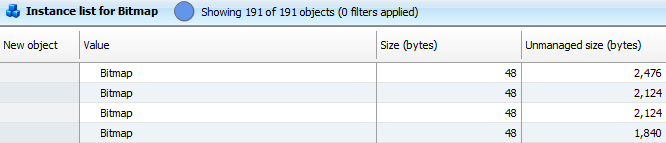
The .NET object representing a Bitmap is only 48 bytes, but the associated unmanaged size may be significantly larger.
Tracking down unmanaged memory issues
ANTS Memory Profiler 8 uses the address of the IntPtr, which was allocated when the object was created, to find the unmanaged memory associated with it:
ANTS calculates the size associated with the IntPtr by doing more than simply following the IntPtr to its destination block. If we did this, then we might only find the top level structure associated with a Bitmap and not the data buffer to which this points.
For this, we've have implemented an algorithm that groups allocations depending on the stack at the time of the allocation. Any IntPtr going into a group of allocations will be sized by the assessing the size of all unmanaged blocks in the group.
Since unmanaged resources are linked to managed objects by pointers, and these can be duplicated, it is possible for multiple managed objects to have references to the same region of unmanaged memory. In these cases, the total amount of unmanaged memory referenced by these objects is generally smaller than it may initially appear to be, though it is unlikely that freeing one instance of the managed class will be sufficient to allow the associated unmanaged memory to be released.
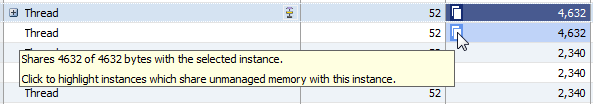
ANTS Memory Profiler 8 identifies those objects which share unmanaged memory with other instances of the same class by showing an icon in the instance list. You can click it to highlight other instances which share same unmanaged memory. This shared memory is only counted once per class in the class list.
In many cases, the unmanaged memory associated with these objects should be freed when the objects are no longer required, usually by calling their Dispose method. If there are instances of the class persisting longer than expected, this may be because there are references from other managed objects which are keeping them in memory, or because they are on the finalizer queue, as they were not appropriately disposed of. You can investigate this using the instance retention graph.
Using unmanaged components
Applications may also use unmanaged memory indirectly through their use of unmanaged components. Once unmanaged memory is allocated by unmanaged code (that your managed code may be calling via COM or P/Invoke) the size of the allocation can be recorded. But it's impossible to understand what the memory is in use for, or why it may remain in memory, without a deep understanding of the unmanaged component in question. There is no type associated with the block - this can be only be inferred on a compiler-specific basis if PDBs are available. ANTS Memory Profiler 8 does not perform this analysis, because even with this information it is difficult to determine how a particular block may be freed due to the lack of garbage collection, analogous to that in .NET.
Excluding the memory leaks due to bugs in the unmanaged code your managed code calls into, if the memory associated with particular modules is continually increasing, this is probably due to the way the interface to them is being used. ANTS Memory Profiler 8 records the amount of memory allocated by each unmanaged module and displays them on the summary screen.
If the unmanaged memory allocated by a particular module continually increases between snapshots, this may indicate that the API to the component is not being used correctly, e.g. a call to allocate a particular buffer is not matched with a corresponding to call to free it. This could be because objects are not being deterministically cleaned up by using the IDisposable pattern, or COM objects not being released when they ought to be.
Improving the way unmanaged memory is used
So how does the additional functionality in ANTS Memory Profiler help you to improve the memory usage of your managed .NET application?
First, it helps you to understand the large chunk of address space which was previously shown in the summary chart as unmanaged. It used to be unclear whether this was memory being used by the CLR or the unmanaged code. Perhaps you had loaded lots of assemblies into your process, or maybe the unmanaged code remained inside the process because your code wasn't driving the API in the correct manner. The breakdown of memory by owning module seen in ANTS helps to clarify these situations.
Second, it makes it clear that some objects that look small on the managed heap are in fact responsible for much larger chunks of the address space of the process. The unmanaged size in the instance list helps you to identify these objects.
It would be phenomenally complicated to generate an unmanaged memory graph that fits elegantly and intelligibly into the standard ANTS memory graphs. But it's unclear if this would really be useful - after all you probably don't understand unmanaged components to the same degree that you understand your .NET code. What we hope is that the information will tell you when you need to worry about unmanaged memory and when concentrating on the managed object graph will be the best course of action.