I know what you’re thinking: an article in CODE Magazine about Excel and PowerPivot? Yes, that’s correct; this installment of the “Baker’s Dozen” covers an important new tool to come out of Redmond: Microsoft PowerPivot. In a nutshell, PowerPivot provides some of the business intelligence capabilities that developers are accustomed to seeing in OLAP tools like Microsoft Analysis Services. So why should you and I care? Because these “end-user” tools still require some programming and configuration. So in this article, I’ll cover the installation of PowerPivot, a brief example of how to use it in Excel - and of course, since this IS CODE Magazine, I’ll show some DAX formula expressions to get the most out of PowerPivot.
So What Is PowerPivot, and What Can I Build with It?
Before I even give a definition of PowerPivot, it’s important to recognize that even a year ago, Excel was arguably the most popular tool for end-user business intelligence. Excel 2007 provided the ability for end users to “slice-and-dice” OLAP data from Microsoft Analysis Services. Of course, that meant a company needed to invest time and resources towards building an OLAP environment, and not every organization is willing or able to do so.
As a result, while many companies have wanted to empower business managers and end users to create their own reports and perform their own analysis on corporate data without relying on developers; for many this has been an unfulfilled objective.
That’s where PowerPivot comes in.
In a nutshell, PowerPivot provides certain OLAP-style functions for end users who are working with relational databases (or even flat file sources). So in this sense, PowerPivot is like an “end user” version of “Analysis Services Lite” enabling “self-service” Business Intelligence features for end users. Excel users can create PivotTables and PivotCharts that are powered under the hood by an OLAP-like, in-memory engine called Vertipaq. Vertipaq handles millions of rows very quickly and compresses data impressively when saved to disk. It derives much of its efficiency by being column-oriented, which means values a user would want to aggregate at higher levels (sales by quarter, sales by year, etc.) are stored adjacent to each other.
Additionally, an end user can use a new formula language called DAX (Data Analysis Expressions), which will likely remind people of a cross between the traditional OLAP MDX language and Excel macros. DAX allows users to create calculations that might range from multiplying two numbers (or concatenating two columns) to determining sales for the same time period a year ago.
Finally, an end user can publish an Excel worksheet (powered by PowerPivot) to a SharePoint 2010 site collection so that others can use the worksheet as a web report - even if the other users don’t have Excel. You can even define refresh schedules to update the data in the published PowerPivot worksheet.
So as such, PowerPivot is really two components. The first is an in-memory engine on client desktops, running as an add-in for Excel users to mash up data from one or more sources. The second is a PowerPivot/SSAS engine that runs in SharePoint 2010 for web users who wish to access deployed content.
The end-user experience with PowerPivot is further enhanced by new features in Excel 2010 such as visual slicers, sparklines and named sets for asymmetric PivotTables.
Of course, any product that provides end-user functionality based on a developer product is likely to have limitations. At the end of this article, I’ll cover the areas where you wouldn’t want to use PowerPivot as a full substitute for Analysis Services.
A PowerPivot User Scenario
An end user might take a relational database (or data from existing SSRS reports, or text files, or XML feeds) and create PowerPivot content from within Excel. If the data contains relational constraints, PowerPivot will build relationships between the tables. (Otherwise, the user must build the relationships manually.)
The end user can then create one or more PivotTables/PivotCharts from the PowerPivot data. As I mentioned earlier, the end user can utilize visual data slicers (which I’ll show later) to provide very easy “slice and dice” capabilities. The end user can also employ DAX calculations for any special requirements (such as showing a category share %, sales last year, 12-month average sales, etc.)
Figures 3 through 11 demonstrate various types of output that end users can create with PowerPivot.
Once the user is ready to share the output with others in SharePoint 2010, the worksheet(s) can be published to a pre-defined SharePoint 2010 PowerPivot Gallery site collection. (Like Excel 2007, Excel 2010 has an option to publish Excel spreadsheets to SharePoint.)
From that point, any end user with SharePoint 2010 access can view the worksheet as a regular web report - even if the end user doesn’t have Excel! (This is because of the PowerPivot engine and Excel Services engine that are running on the server.)
Of course, data is never static. The worksheets might contain invoice data that changes daily, weekly, etc. A SharePoint 2010 admin person can define refresh schedules to automatically update the worksheet from the worksheet PowerPivot content.
So Why Should Developers Care?
In a relatively short amount of time, there’s been a substantial amount of opinion and speculation regarding PowerPivot and developers - namely, what impact will a self-service BI tool have on BI developers (i.e., job security). My view is that it will have very little negative impact. Tools like PowerPivot will shift technical focus within a company, but are far less likely to put BI developers into early retirement.
Here are some of the reasons (in no order of significance) why developers (particularly database/application developers) should invest time with PowerPivot:
- Many analytic efforts with PowerPivot will require at least a few DAX formulas. While some power users may be able to “grok” DAK, others won’t have the time or patience to learn DAX. So an application developer with DAX knowledge will still be able to help.
- Creating PowerPivot content from relational databases might still require developers to assist in creating a simplified source or “staging area” or at least might need assistance in establishing the PowerPivot source to begin with.
- PowerPoint with SharePoint integration requires (among other things) knowledge of SQL Server installations and SharePoint farm configurations.
- Developers may even find that PowerPivot will save them time from more “mundane” reporting applications, allowing them to devote time to more intricate applications. Recently I invested a minor amount of time helping an end user get set up with a PowerPivot application. Had I built the application myself with Analysis Services and Reporting Services, it would have taken me a little longer. Like most developers/authors, I’m busy enough that I’ll gladly accept a tool that builds certain applications easier.
- Related to the last point - all of us, even developers, might have some “pet work” or even personal database where you’d like to do some basic analytics. Once again, PowerPivot can help you get results with less effort than going through the process of building an OLAP cube or writing relational SQL queries just to join together basic dimensions.
What’s on the Menu?
In Sergeant Joe Friday style (i.e., “the facts, just the facts”), here are the 13 items on the menu for this article:
- The Baker’s Dozen Spotlight: Installing and configuring Microsoft PowerPivot with SharePoint 2010 integration
- Creating PowerPivot content
- Deploying an Excel worksheet with PowerPivot content to SharePoint 2010
- A simple set of starter DAX formula expressions
- A DAX formula to perform a distinct count
- A DAX formula that refers to another DAX formula
- A set of DAX formulas to perform a 12-month moving average
- A DAX formula to generate a ranking number
- A DAX formula to calculate values as percentages of a larger parent value
- A DAX formula that calculates a value for the same time period one year ago
- A DAX formula that calculates quarter-to-date (QTD) values
- A DAX formula that calculated year-to-date (YTD) values
- A DAX formula that performs YTD summarization, but for a custom year definition (e.g. a fiscal year)
Tip #1: The Baker’s Dozen Spotlight: Installing and configuring Microsoft PowerPivot with SharePoint 2010 integration
Wait a minute - the Baker’s Dozen Spotlight tip is for an installation? Am I serious? You bet I am. As it turns out, many have struggled with installing PowerPivot and implementing SharePoint integration in a development environment using something other than Windows Server.
For a few years, I used Windows Server on my development PC and laptop because I thought I HAD to in order to get SharePoint Server 2007 to work. (As it turns out, you can use a free utility from Bamboo Solutions to “trick” MOSS 2007 into believing it’s been installed on a server OS.) But that leaves SharePoint 2010 and PowerPivot integration and the question - can you install these on something like Windows 7 Professional?
The answer is YES! This should bring smiles to those who didn’t care for running a server-based OS, just to get SharePoint to run. Those who previously saw performance of their machine denigrate because they had to run SharePoint in a Virtual Server environment might actually do a celebration dance!
The installation/configuration steps are rather lengthy, and appear in the downloads area of my website (http://www.KevinSGoff.net">http://www.KevinSGoff.net). In a nutshell, the steps are as follows:
- Installing Office 2010.
- Installing PowerPivot.
- Installing SQL Server 2008R2.
- Installing IIS and turning on specific IIS features.
- Installing all the SharePoint 2010 prerequisites.
- Installing SharePoint 2010.
- Re-running the SQL Server 2008R2 setup to configure PowerPivot Integration for SharePoint.
- Running the SharePoint 2010 configuration wizard (which includes running some SharePoint management shell scripts).
- Configuring a SharePoint 2010 farm for PowerPivot integration.
- Configuring the PowerPivot service application.
- Configuring service accounts for data refreshes.
- Creating at least one site collection for a PowerPivot Gallery.
OK, so it sounds like it might take an hour or so to run all these steps, but is it really that intricate? Yes, it is. Many of these steps require a substantial number of individual settings. I’ve had people offer to buy me a fancy dinner in exchange for the full set of steps to install PowerPivot with SharePoint integration in a Windows 7 development environment.
Tip 2: Creating PowerPivot Content
You can create PowerPivot content with many different data sources (even flat CSV files). In my example, I’ll use a demo database that I use for product examples: a relational database for a fictional retail jewelry store. Here are the steps:
Step 1: Open up Excel and click on the PowerPivot pulldown and then the PowerPivot Window button.
Step 2: After PowerPivot launches an entirely new window, click From Database, and then From SQL Server.
Step 3: PowerPivot will launch a connection dialog where you can specify the server and database to select.
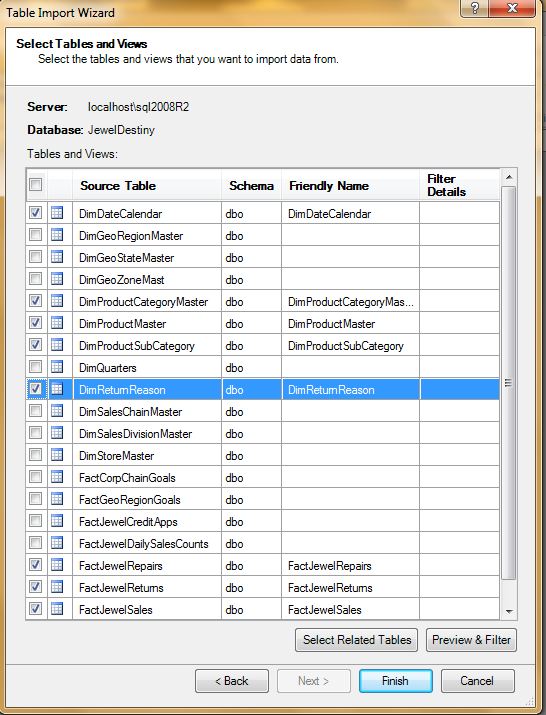
Step 4: PowerPivot will then display the list of tables in the database (Figure 1), and you can select the tables you wish to use for your Excel/PowerPivot content.
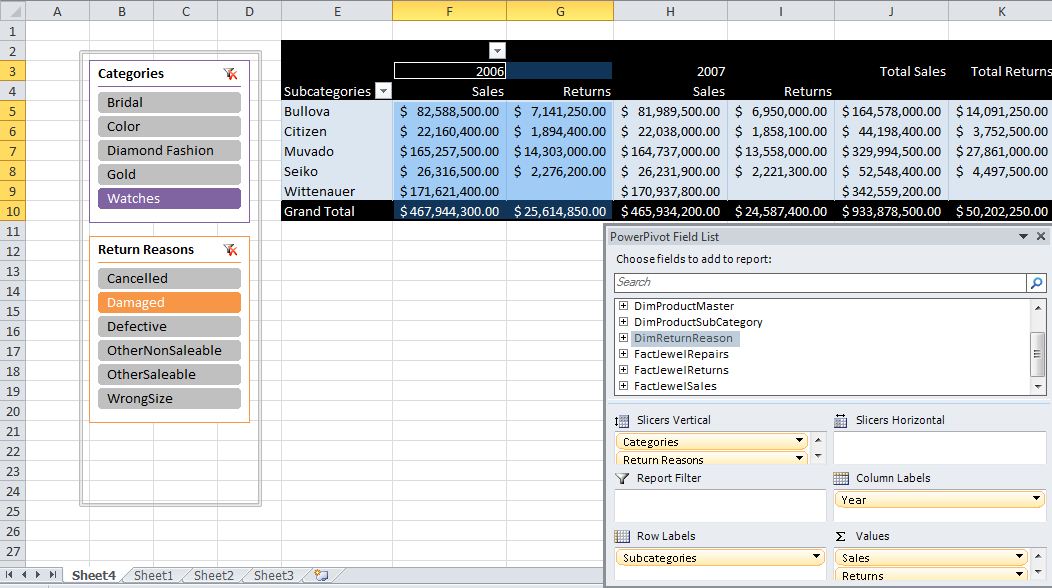
Step 5: Once you select your tables, you can select the PivotTable option and create a new PivotTable or PivotChart from the data. This takes you back into the Excel worksheet area with a PivotTable Field List (Figure 2) that allows you to select data for the row and column axis of a pivot table. You can also use the Pivot table field list to define data slicers, which are basically visual filters.
Tip 3: Deploying an Excel Worksheet with PowerPivot Content to SharePoint 2010
If you have installed PowerPivot Integration with SharePoint, and if you have previously defined a PowerPivot site collection, you can deploy your Excel/PowerPivot worksheet to SharePoint. A PowerPivot site collection contains a PowerPivot Gallery, which is essentially a SharePoint document library dedicated specifically for content powered by PowerPivot.
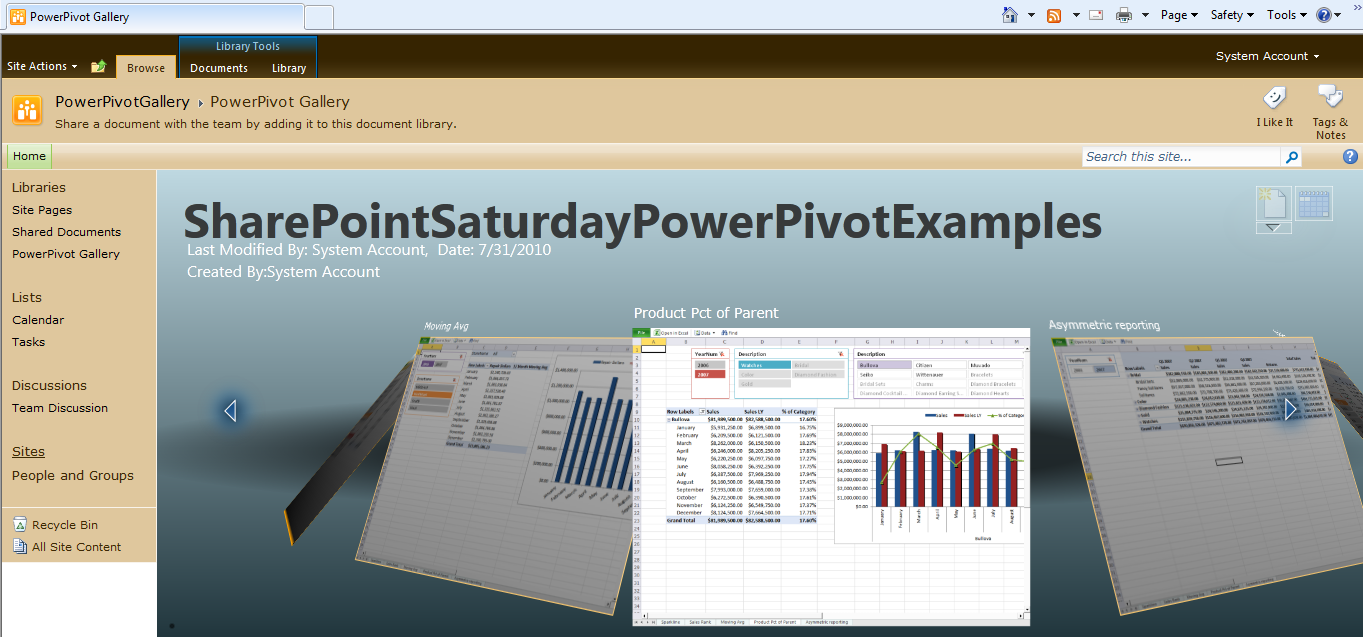
So in Excel you can select the option to “Save and Send” and then select the option to save to SharePoint and provide the full address for the PowerPivot site collection. Once you’ve deployed your content, you could view your content in a carousel-style window in SharePoint (Figure 3).
Tip 4: A Simple DAX Formula Expression
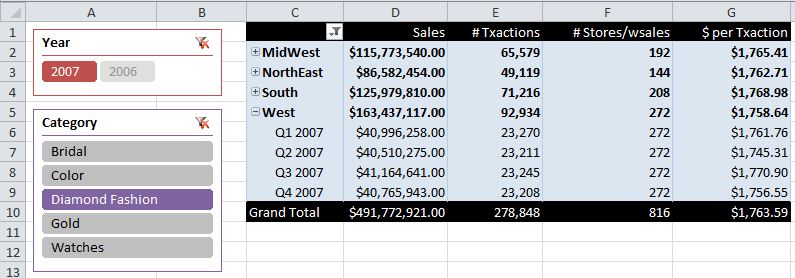
Figure 4 shows a basic PivotTable with built-in measures for Sales Revenue. I also wanted to show three additional measures: number of transactions, number of distinct stores with at least one transaction, and dollars per transaction. I’ll use the DAX expression language to create each of those in this tip as well as the two following tips.
To create a new DAX expression, right-click in the PivotTable field list and select “Add New Measure” (Figure 5).
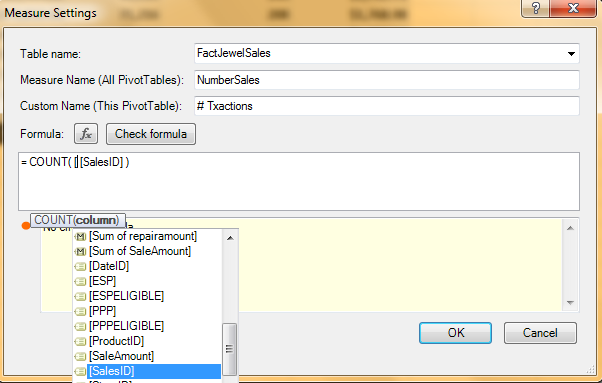
To get a tally of sales

=count( [SalesID])
Tip 5: A DAX Formula to Perform a Distinct Count
The next calculation back in Figure 4 shows a distinct number of stores with at least one sales transaction. While there’s no actual single COUNT DISTINCT in DAX, you can wrap a DISTINCT function inside a COUNTROWS function to achieve a distinct count of stores within the FactJewelSales table:
=COUNTROWS(DISTINCT(FactJewelSales[StoreID]))
Tip 6: A DAX Formula that Refers to Another DAX Formula
The last calculation in the basic example in Figure 4 shows dollars per transaction, which is nothing more than a SUM of the SalesAmount column from the FactJewelSales table, divided by the existing NumSales measure from Tip 4. So you can easily reference other DAX expression names in a new DAX calculation.
=sum(FactJewelSales[SaleAmount]) / [NumberSales]
Notice how the example back in Figure 4 “slices” data by Year, by Product Category, and by geography and time definition. You may be asking, “Shouldn’t the DAX expression receive those as parameters?” You may also be asking, “How can the calculation SUM the SalesAmount column, without knowing the scope of the SUM?”
These are good questions - and the answer reflects the “essence” of OLAP. The underlying engine (be it the full blown version of Analysis Services or the PowerPivot Vertipaq engine) automatically aggregates the measure by any business dimensions (years, regions, products, etc.) that are related to the fact table containing the measure. This is why the relationships between tables are so critical!
Tip 7: A Set of DAX Formulas to Perform a 12-month Moving Average
A fairly common business calculation is a moving average. Over a 12-month period, a business might want to know, for each given month, the average sales over the last 12 months. (It is called it a “moving average” because, over the course of the 12 months, the range you use for any given month changes, or “moves.”)
Figure 6 shows an example of this, where the 12-month moving average is displayed in a PivotTable, and also plotted in a chart as a line chart. An analyst can easily spot the months where repair dollars for that month exceeds the 12-month overall average, for that point in time. This requires four calculations, all of which are found in Listing 1.
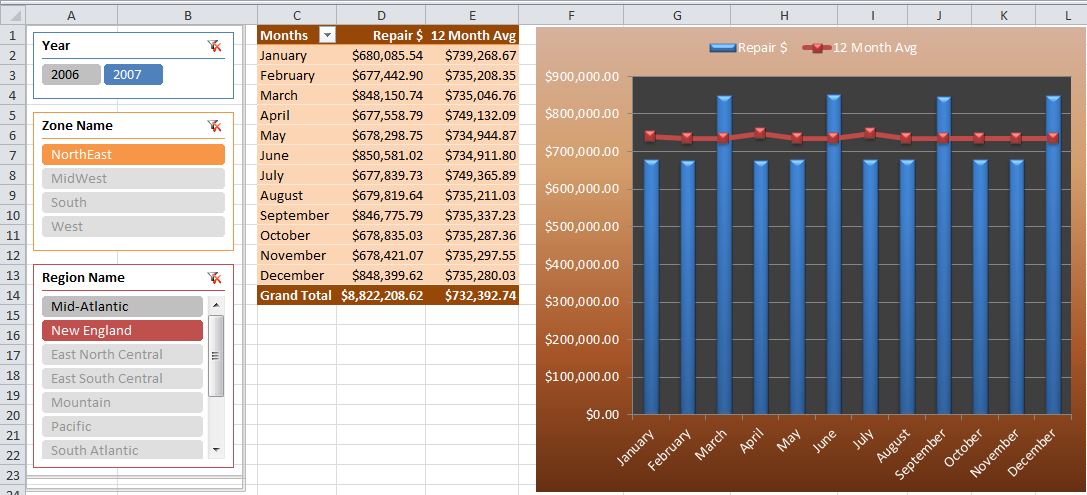
The first calculation (AverageRepairs) sums the repair dollars for a given slice of data, and divides the sum by the number of months being sliced.
The second and third calculations determine the beginning and ending range of the moving average. The beginning month (FirstMonthMovingAverage) takes the current month and goes back 12 months by using the functions DateAdd (with a parameter of -12) and StartOfMonth. The ending month (LastMonthMovingAverage) takes the current month and goes back one month.
Finally, the actual calculation uses the DAX function called CALCULATE to express the AverageRepairs across the range of dates between FirstMonthMovingAverage and LastMonthMovingAverage.
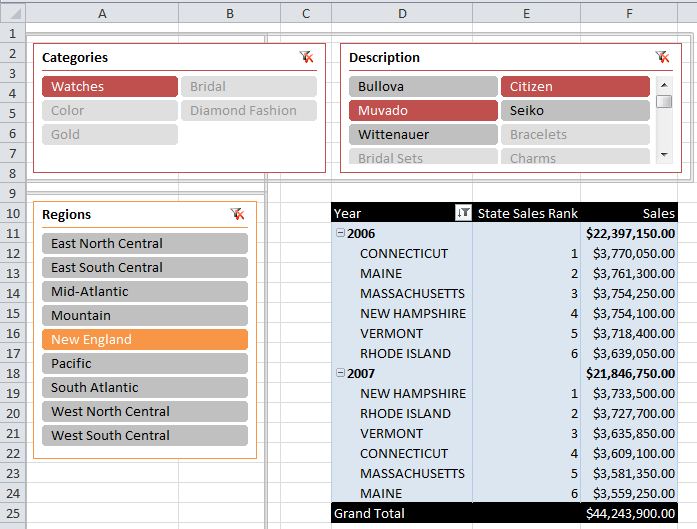
Tip 8: A DAX Formula to Generate a Ranking Number
Figure 7 shows an example of raking sales by state, and Listing 2 shows the DAX code to perform a ranking. Unfortunately, DAX does not have a built-in RANK function - however, you can manually rank data by counting the number of rows where the sum of sales for the current state is less than the same slice of data, but with one added to it.
Tip 9: A DAX Formula to Calculate Values as Percentages of a Larger Parent Value
Another very common function is the calculation of a measure (sales, returns, etc.) expressed as a percentage of the measure for a parent dimension value. For example, you might want to see sales for each city in Pennsylvania as a percentage of the state. Another example is seeing sales for each product in a product group as a percentage of that group. That might be important to spot trends in one product over time with respect to other products in the same group (i.e., product cannibalization).
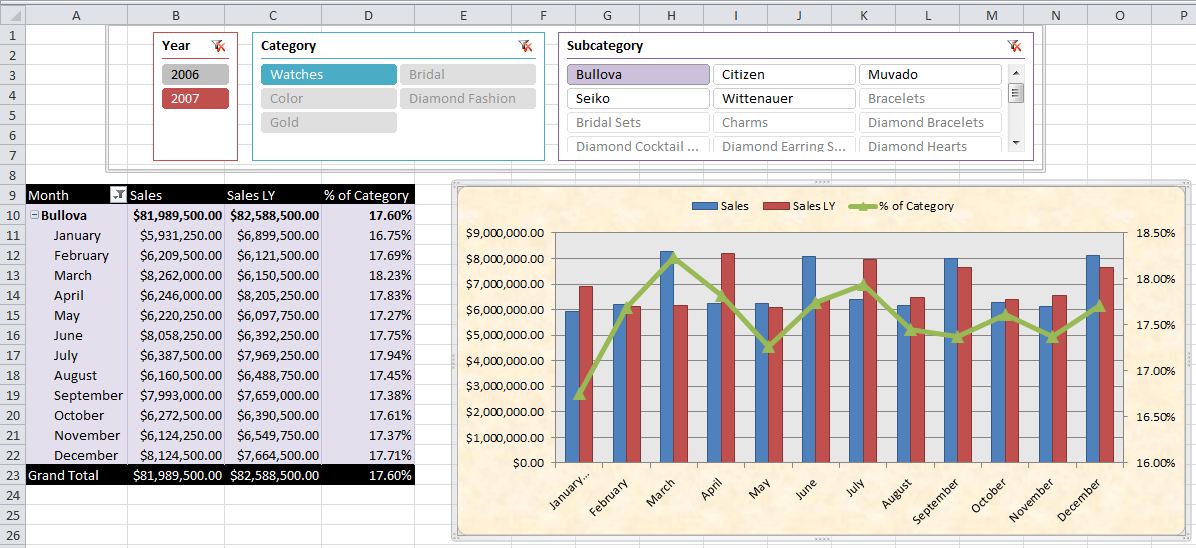
Figure 8 shows an example of sales for a specific watch brand (Bullova) as a percentage of overall sales for watches. Listing 3 shows the code for the calculation, which sums sales for the current “slice” of data divided by the sales for all Product Subcategories.
Tip 10: A DAX Formula that Calculates a Value for the Same Time Period One Year Ago
One of the more important calculations in trend-based analysis is calculating a measure (e.g., sales) for one year prior. For instance, if you’re in March 2009, you might want to see sales or profit percentage for the same time period Last Year (March 2008). If you were looking at data by quarter (e.g., Q1, 2009) you’d want to see data for the same quarter in the prior year (Q1, 2008).
Figure 8, in addition to showing percentage of subcategory, also shows sales for the same time period last year. This can be done several ways in DAX: one way is through the DAX calculation called SamePeriodLastYear (Listing 4) to express the SUM of sales for one year ago, context sensitive to the current date slice.
Tip 11: A DAX Formula that Calculates Quarter-to-Date (QTD) Values
Another common calculation is summing a measure for a period to date (such as Quarter to Date, Year to Date, etc.). Figure 9 shows a calculation of sales to date for the quarter associated with the current month. The code (Listing 5) for the DAX calculation sums the sales measure using the DAX function DATESQTD.

Tip 12: A DAX Formula that Calculates Year-to-Date (YTD) Values
Figure 9 also shows a similar calculation that rolls up months for the current year. Listing 6 shows the calculation for this, which is essentially the same as Listing 5, except using the function DatesYTD.
For those who have special reporting calendars (e.g., a Fiscal Date range that goes from July 1 to June 30), you may be asking, “How can I use DatesYTD?” That’s a segue into Tip 13:
Tip 13: A DAX Formula that Performs YTD Summarization, But for a Custom Year Definition (e.g., a Fiscal Year)
Figure 10 shows a similar output to Figure 9, except using a Fiscal hierarchy that begins in July. You can use an optional parameter in DatesYTD to specify the last date in a Fiscal year (Listing 7).

Bonus Coverage: Sparklines in Excel 2010
Figure 11 demonstrates a feature that you’ve probably seen before: a sparkline. A sparkline is a highly compressed, dense graphic (often a line chart) stripped of all labels, legends, tick markets, etc. All that remains is just the plotted data and perhaps a small marker for a high and low point, and nothing else.

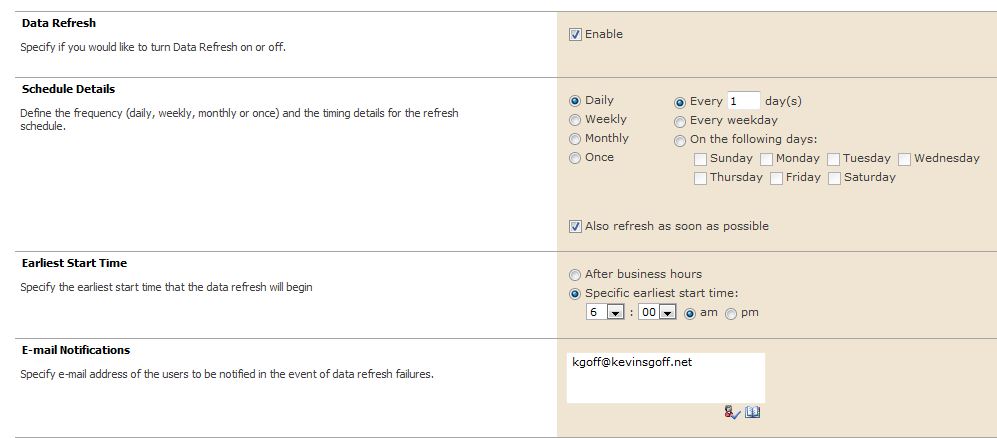
Bonus Coverage: Data Refreshes in PowerPivot
Once you deploy a PowerPivot worksheet/database to SharePoint 2010, the next question that comes up is, “What happens when the underlying data changes?” Fortunately, SharePoint provides an option to define a data refresh (Figure 12).
Bonus Coverage: Recommended PowerPivot Resources
There are several excellent sources for PowerPivot, and I’m grateful for the individuals who have built these sources of information.
First, Andrew Brust has been a tireless advocate for PowerPivot. You can find several excellent blog entries on his blog site: http://www.brustblog.com/">http://www.brustblog.com/. Andrew also recently performed an outstanding webcast for PowerPivot: http://oreillynet.com/pub/e/1697. I strongly recommend anyone interested in business intelligence to read anything Andrew has written.
Additionally, I recommend the following sites for more information on PowerPivot:
- http://blogs.msdn.com/powerpivot/">http://blogs.msdn.com/powerpivot/
- http://powerpivotpro.com/
- http://powerpivotgeek.com/
- http://www.powerpivot-info.com/">http://www.powerpivot-info.com/
- http://powerpivot.com/
- http://powerpivotfaq.com/Lists/TGPPF/AllItems.aspx
- http://www.powerpivotblog.nl/">http://www.powerpivotblog.nl/
- http://powerpivottwins.com/
Finally, I’ve read the following books and highly recommend them:
- Professional Microsoft PowerPivot for Excel and SharePoint (published by Wrox).
- PowerPivot for the Data Analyst: Microsoft Excel 2010 (published by Que).
- Practical PowerPivot & DAX Formulas for Excel 2010 (published by McGraw Hill).
Bonus Coverage: Differences Between SSAS and PowerPivot
Here are the limitations of PowerPivot. Many of these limitations will keep PowerPivot in the area of “personal or small-team BI” as opposed to corporate-wide BI.
- The maximum size of a PowerPivot database when deployed to SharePoint is 2 GB. This pales in comparison to the size of many OLAP databases, and will often restrict PowerPivot to data marts.
- Unlike SSAS OLAP databases, PowerPivot has no built-in role-based security. Therefore, dimension-based security restrictions (e.g., User XYX can only see the Mid-Atlantic Region, or the Brand of Motor Bikes, etc.).
- PowerPivot does not natively support some of the more advanced dimension relationship types, such as many-to-many relationships.
- Analysis Services provides the ability to script calculations and KPIs. PowerPivot does not have the same ability.
- The PowerPivot Data refresh option, while functional, is not as robust as other scheduling options in SQL Server.
- PowerPivot does not permit table relationships based on composite keys. The workaround is to create a calculated column that concatenates the columns that would otherwise comprise the composite key).
- While the DAX language has many capabilities, the MDX programming language for OLAP databases remains a stronger language.