With each new version of SQL Server Reporting Services, Microsoft continues to offer new functionality for reporting. SQL Server 2008 R2, released to manufacturing in mid-2010, represents Microsoft’s fourth major release of Reporting Services in the last 10 years. This fourth release focuses on map generation and various business intelligence/data visualization features. In this article, I’ll demonstrate 13 significant features in SSRS.
What’s on the Menu?
Recently I attended a presentation where the speaker seemed to take forever to get to the meat of the demonstration. So I’ll get right to my 13 topics-in Sergeant Joe Friday style (i.e., “the facts, just the facts”). Here are the 13 items on the menu for this article:
- Deploying reports to native servers or SharePoint.
- Creating SSRS maps using the SSRS State Map Gallery.
- Creating SSRS maps using geospatial data.
- Linking the two SSRS maps together using a report action.
- Another example using Geospatial data, but with a custom zoom in a web page.
- Creating a pivot table/drilldown report with the Tablix report control.
- Creating reports with cascading parameters.
- Creating reports against OLAP cubes.
- Creating reports with performance gauges and sparklines.
- Running reports from C# and exporting to PDF.
- SSRS 2008 R2 Potpourri.
- Baker’s Dozen Spotlight: Data-driven subscriptions.
- Subreports.
So What Will You Have at the End?
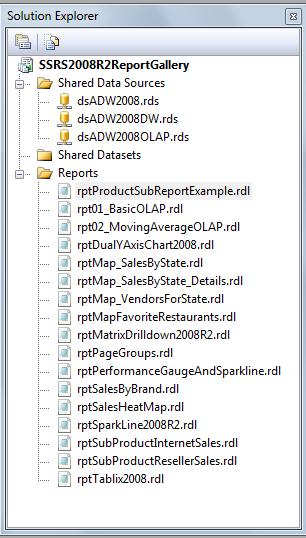
Figure 1 shows an SSRS project in Business Intelligence Development Studio (BIDS). The project contains over a dozen reports, with three shared data sources. The data sources are dsADW2008 (the OLTP relational database for AdventureWorks), dsADW2008DW (the OLTP data-mart relational database for AdventureWorks), and dsADW2008OLAP (the OLAP database for AdventureWorks).
Tip 1: Deploying Reports to Native Servers or SharePoint
This article assumes that you know the basics of creating SSRS reports in BIDS and that you know the basics of querying data for reports.
After you create reports in BIDS and test them with the BIDS preview option, the next step is to deploy reports to a server. The server could be a QA server, a test development server, or a production server. Reporting Services supports two different types of deployment targets: SharePoint integrated mode or native SSRS (“non-SharePoint”) mode. With SharePoint integrated mode, you deploy SSRS reports and data sources into a SharePoint document library and you can take advantage of SharePoint resources. In native SSRS mode, you deploy reports into a web environment that’s dedicated exclusively to Reporting Services.
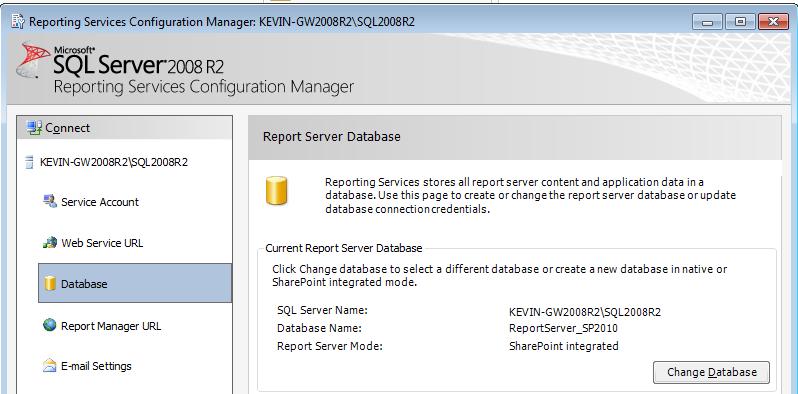
To configure SSRS for either mode on a server (or even a development environment), you first need to define the configuration type. Figure 2 shows the SSRS 2008 R2 Configuration screen, where you can provision the Report Server database for either native SSRS mode or SharePoint integrated mode. Additionally, you’ll need to set the Web Service URL, which will often be something like http://Server/reportserver.
Note that for native SSRS mode, it is no longer necessary (in SSRS 2008 and 2008 R2) to run IIS-because SSRS uses the SQL network stack. Obviously, if you’re deploying SSRS reports into a SharePoint environment, then IIS is required.
On the SharePoint end, you’ll need to install the Reporting Services Add-in for SharePoint (available as a free download for MOSS 2007 and integrated into the SharePoint 2010 pre-requisites installation). You’ll also need to go to SharePoint Central Administration > Application Management, and then configure the report server integration to use the same Web Service URL that’s defined back in the SSRS Configuration area.
After you have SSRS and your target deployment area configured, you can take an SSRS project and set the project properties. Figure 3 shows the properties for an SSRS project when deploying into a SharePoint location. Note: it’s assumed that a SharePoint site or site collection already exists. So suppose I’ve created a site location called http://MyServer/sites/MySiteCollection, a report document library in the Site Collection called MyReportLibrary, and a report project called MyReportProject. Here are the required entries in the project properties page:
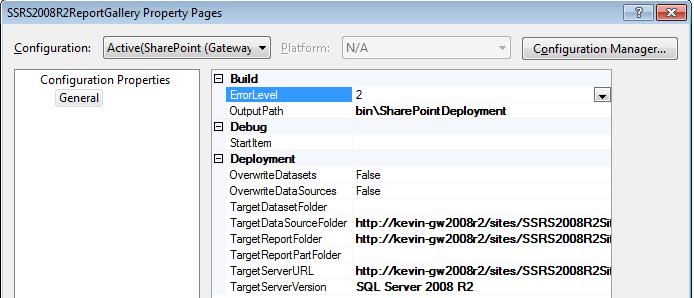
TargetDataSourceFolder: http://MyServer/sites/MySiteCollection/DataSources
TargetReportFolder: http://MyServer/sites/MySiteCollection/MyReportLibrary/MyReportProject
TargetServerURL: http://MyServer/sites/MySiteCollection/
When deploying to a native (non-SharePoint) report server, the URL location is much simpler. In my case, I have a local server called localhost, and a database report instance of SQL2008 R2. In that case, here are the required entries in the project properties page (Figure 4):
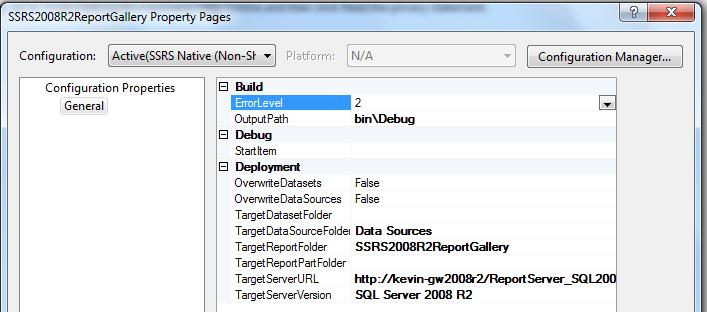
TargetDataSourceFolder: DataSources
TargetReportFolder: MyReportProject http://myserver/sites/MySiteCollection/MyReportLibrary/MyReportProject
TargetServerURL: http://localhost/ReportServer_SQL2008 R2
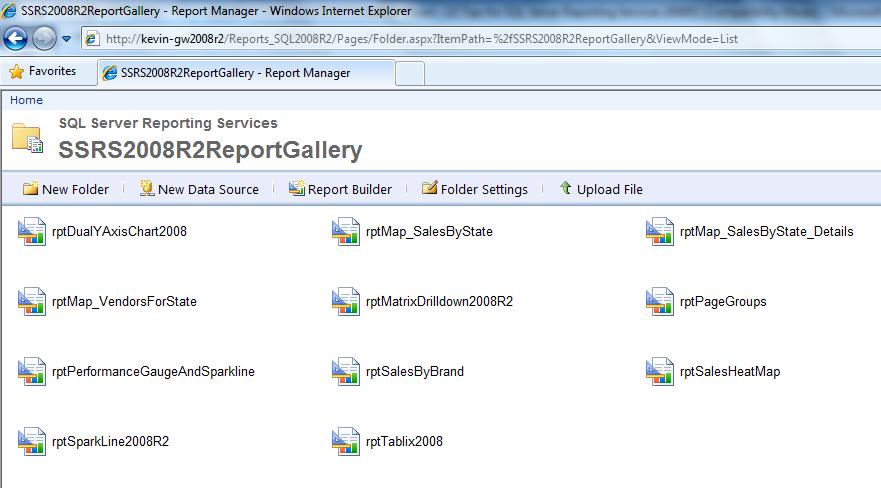
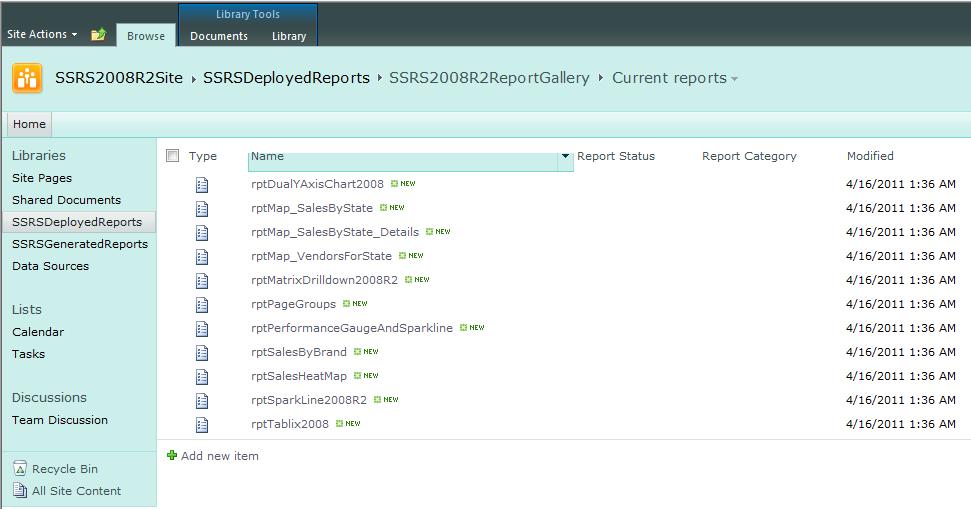
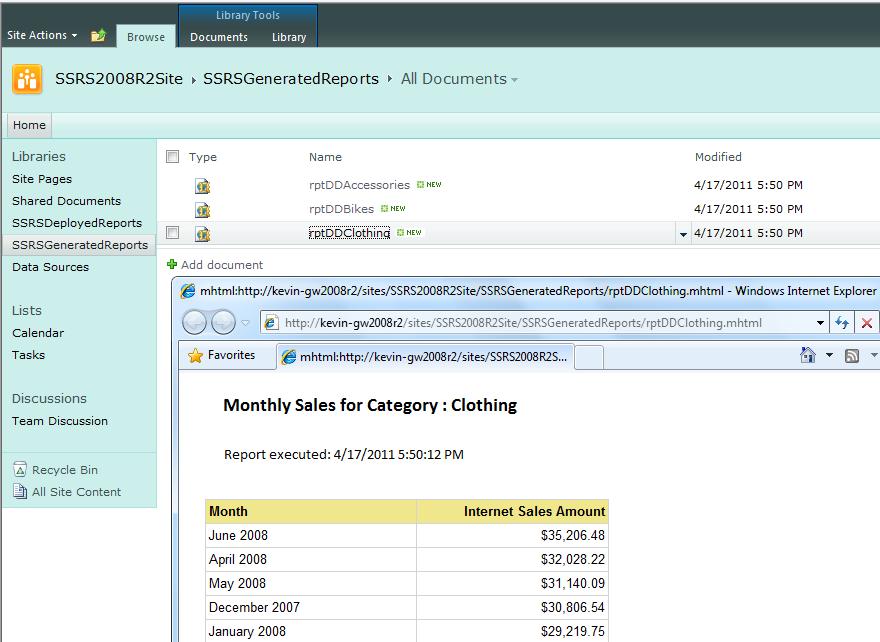
Once deployed, you can review reports in either the SSRS Report Manager (when using native SSRS mode, Figure 5), or in the SharePoint site collection (Figure 6).
Tip 2: Creating SSRS Maps Using the SSRS State Map Gallery
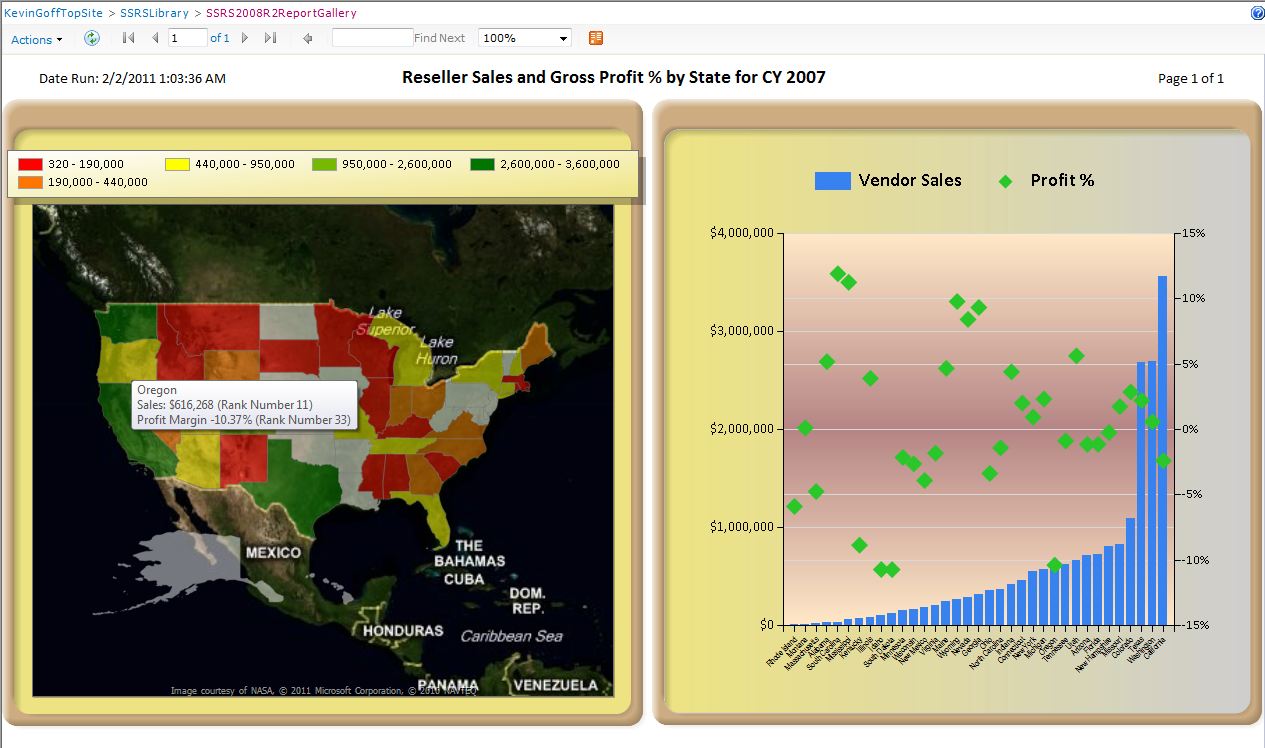
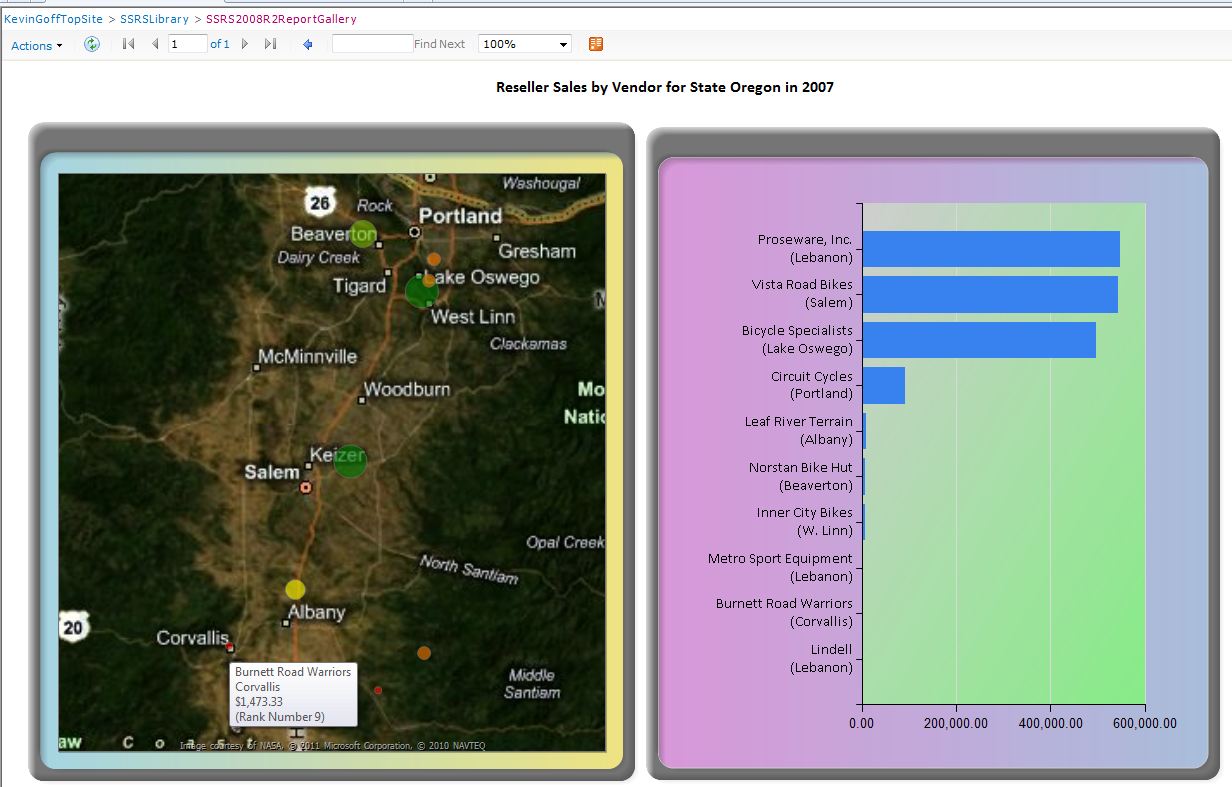
SSRS 2008 R2 and Report Builder 3.0 provide new functionality for creating maps. This opens up great possibilities for geographic visualizations. One could write an entire article just on the new mapping features, but I’ll try to show a few features here. Figure 7 shows a U.S. state map with states color coded by sales using a built-in Map Gallery and a dataset containing sales by state. The user can hover over a state and view a tooltip of sales and profit ranking. The report also shows a dual-axis chart that plots sales by state as a column chart and profit margin percentage by state as a scatter graph.
SSRS 2008 R2 and Report Builder 3.0 provide new functionality for creating maps. This opens up great possibilities for geographic visualizations.
To create this, I first need to build a dataset for the supporting data for the map/chart:
- Created a new dataset against the ADWOLAP cube (dsSalesByState).
- Retrieved the Reseller sales amount and Reseller Gross Profit Margin from the Reseller Sales Fact table, and also retrieved the Geography State-Province attribute.
- Set an internal filter to only view state-provinces in the United States, and created a parameter filter for the user to select a Fiscal Year.
- Created two MDX calculated members to rank each state by sales and by gross profit margin (the download project contains the MDX code).
The next step is to create the map using the Map Wizard. This is an amazingly easy process:
- Drag a map object from the toolbox into the main report area. This invokes the SSRS Map Wizard.
- Select Map Gallery for the Map Source, select USA by State Exploded, and then select Next.
- Check Add a Bing Maps Layer, select a Tile Type of Hybrid, and then select Next.
- For the Choose Map Visualization option, select Color Analytic Map, and then select Next.
- For the Choose Analytic DataSet option, select the dataset from the first set of steps (dsSalesByState).
- In the Specify Match Fields screen, match the column for StateName, and then select the dataset column StateValue.
- Select a theme (Mahogany), select the sum of Reseller Sales amount as the Field to visualize, and then select a color rule of Red-Yellow Green.
To add a tooltip so that a user can hover over a state and view the sales and ranking information, right-click on the map, go to the map layers, right-click on the Polygon layer properties, and then enter the following formula into the tooltip formula expression:
=Fields!State_Province.Value & vbcrlf  &
  "Sales: " &
formatCurrency(
  Fields!Reseller_Sales_Amount.Value,0) &
 " (Rank Number " &
  Fields!SalesRank.Value & ")" & vbcrlf
 & "Profit Margin " &
     FormatPercent(
   Fields!Reseller_Gross_Profit_Margin.Value,2) &
 " (Rank Number " &
   Fields!ProfitRank.Value & ")"
Tip 3: Creating SSRS Maps Using Geospatial Data
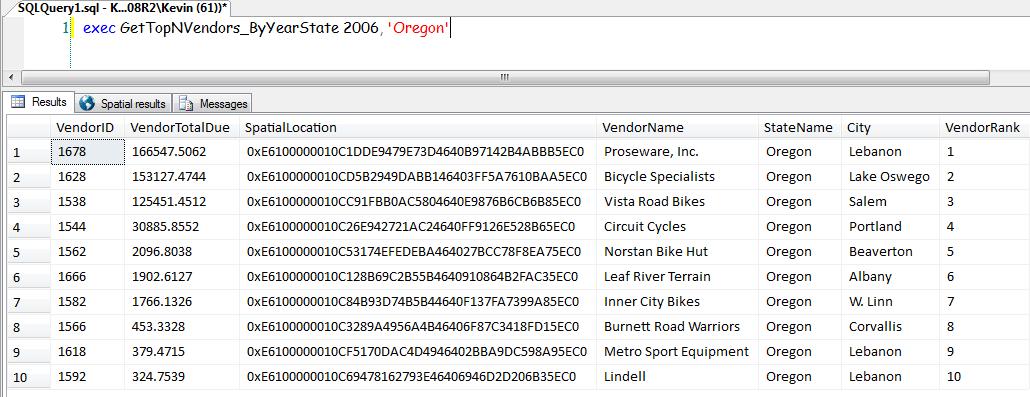
From the map in Figure 7, a user might want to click a state and launch a second report that shows the vendor locations and sales within the state (Figure 8 and Figure 9). This second map will plot sales by using the geospatial coordinates for each vendor. You can use the new geography data type in SQL Server 2008 (and the geospatial address locations found in the Person.Address table in AdventureWorks).
To accomplish this, I first (once again) need to build a supporting dataset:
- Create a dataset (dsVendorSales) that retrieves Vendor Sales, Vendor ID and Vendor Name, City Name, Vendor Rank, and the Spatial location geographic data from the Person.Address table.
- Figure 8 shows a stored procedure that captures this information for a specific state as a parameter.
I can then drag a map into the layout area, but this time in the map wizard I can specify the SQL Server Spatial Query option for the source of the spatial data. I also need to define the Layer Type as a Point, since I’m providing geospatial data points.
Tip 4: Linking the Two SSRS Maps Together Using a Report Action
For a user to be able to click a state in the first map and launch a more detailed map, I need to define a report action in the first report. I can go to the polygon properties of the first map, go to the action page in the properties dialog, and then set the action to “Go to Report”, specify the name of the child report, and specify the child report parameters that I want to populate from the main “parent” report.
Tip 5: Another Example Using Geospatial Data, But with a Custom Zoom in a Web Page
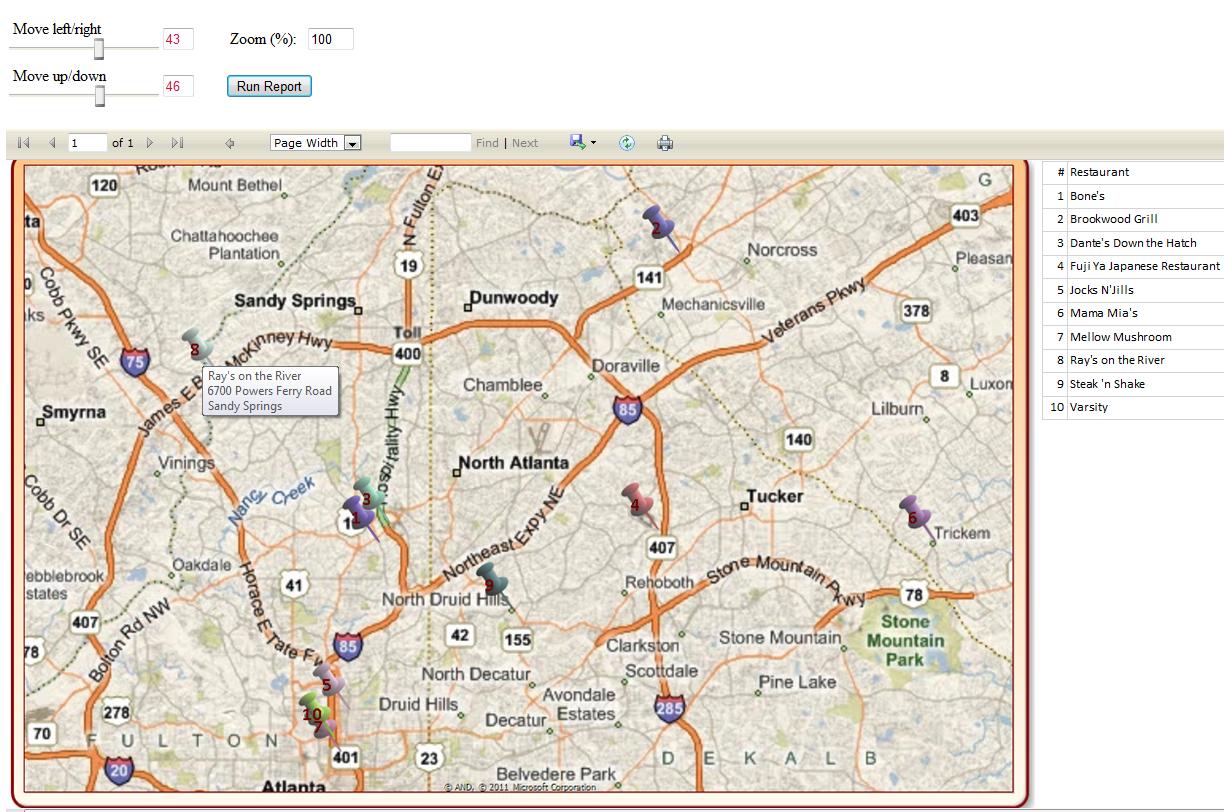
When I was learning the new geospatial data type in SQL Server 2008, I created a demo map report application that plotted my favorite restaurants in the Atlanta, Georgia area. (I lived in Atlanta in the early 1990s.) The result is Figure 10 and Figure 11, which show an SSRS report inside a web page, with some very basic slider extender controls from the ASP.NET AJAX library to zoom and slide north/south and east/west.
Additionally, I populated the address table using a Web Service (Listing 1) and a stored procedure (Listing 2).
Here are the steps I went through:
- Created two SQL Server database tables to store restaurant name and address information.
- Wrote a small application in C# to call a free public Web Service (http://geocoder.us/) that will receive an address, city, and state and return the latitude and longitude points (Listing 1).
- Wrote a small stored procedure (Listing 2) that receives the latitude and longitude points from the C# program, and uses the SQL 2008 function STPointFromText. This function converts latitude and longitude coordinates to a geography point that I can ultimately use in an SSRS map.
- Created a report (rptMapFavoriteRestaurant) with a map that points to the geospatial data from the address table in the first step.
- Eventually, I want the end user to be able to zoom the map in/out, and also to move the map up/down (north/south) and left/right (east/west) from the center. So I created three integer parameters (Zoom, MoveUp, MoveRight) that tie to the Zoom Level, View Center X, and View Center Y Map Viewport properties.
- Note that in Figure 10 and Figure 11, the report appears in an ASP.NET web page, where I can use a basic slider extender control (from the ASP.NET AJAX Library) for the user to adjust the View Center X and View Center Y properties.
- To access the report inside a .NET web page, I created a new Visual Studio 2010 website project, dropped an instance of a Reporting Services viewer on a Web Form, along with slider extenders for the View Center X and View Center Y, and a web command button to run the report.
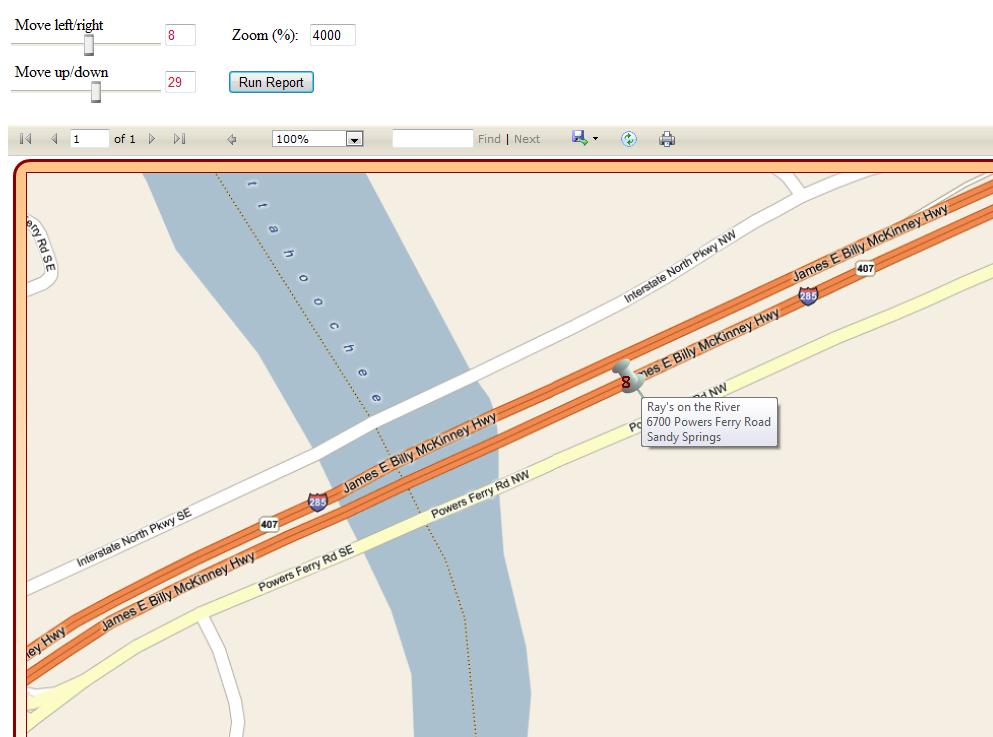
- In the Click event of the command button, I use the code in Listing 3, which sets the URL for the report, creates a ReportParameter parameter list object, populates the three parameters, and then sets the report viewer visible property to true. The user can now view the report in a web browser (again, Figure 10 and Figure 11). Figure 11 shows an example of zooming from the general Atlanta area to a specific restaurant (Ray’s on the River)-the zoom level is so high that you can almost read the menu!
Tip 6: Creating a Pivot Table/Drilldown Report
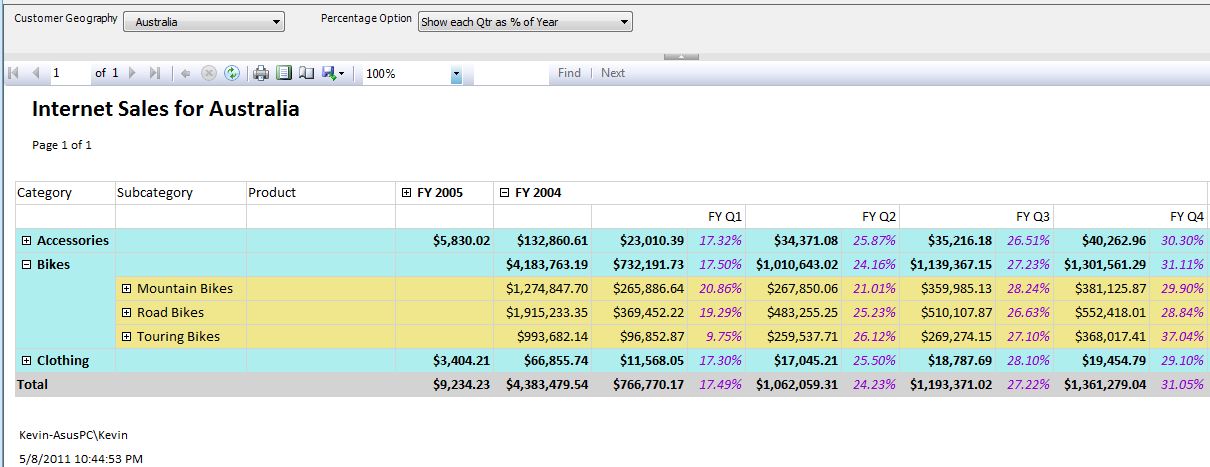
Figure 12 and Figure 13 demonstrate a report that uses the pivot table (matrix) capabilities of SSRS. Both screen shots show row groups with the product hierarchy (category-subcategory-product) and column groups with the date hierarchy (Fiscal Year-Fiscal Quarter), with expand/collapse (drilldown) capabilities to show or suppress details. The report also contains a dropdown option for showing expanded quarters as a percentage of the year or a percentage of the parent product level.
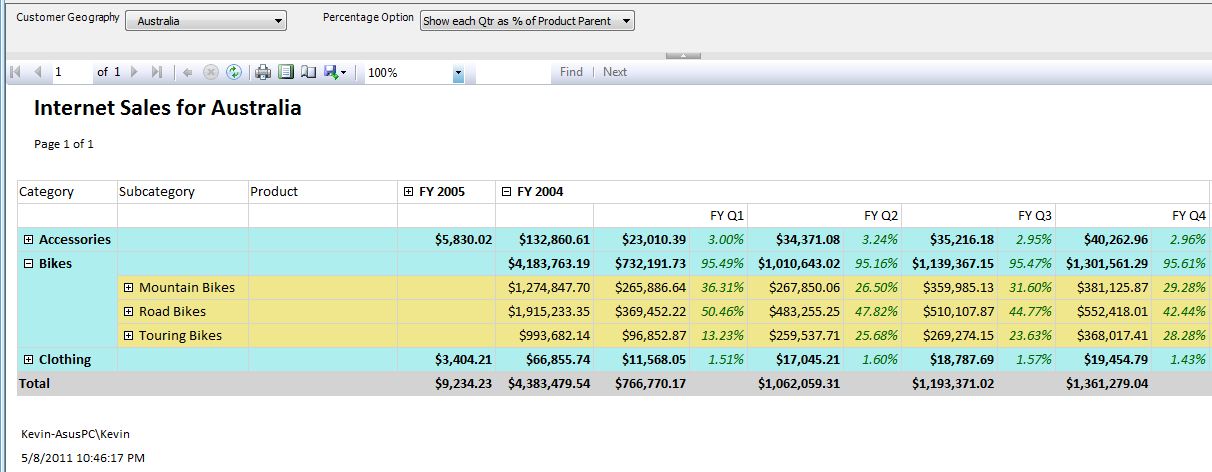
To implement this report, I did the following:
- I created a new report against the ADWOLAP shared data source. In the report primary DataSet, I used the OLAP MDX query designer to select the Internet Sales measure, and the following Dimension members: Fiscal Year, Fiscal Quarter of Year, Product Category, Product Subcategory, and Product.
- Also, in the Query designer, I defined the Customer Geography hierarchy in the Dimension Slicer at the top of the dialog window, and checked the Parameters check box to allow the user to make a geography selection at runtime.
- In addition to the data-bound parameter, I also created an unbound parameter for the dropdown (in Figure 11 and Figure 12) to allow the user to select from the two calculation logic options for the percentages (either “Show each Quarter as a % of the Year” or “Show each Quarter as a % of the Product Parent”).
- In the report designer, I dragged in a Matrix control from the toolbox, and then dragged the Internet Sales Amount measure into the Matrix Data section. I then created row groups for the Product Category, Subcategory, and Product dimension members. I started by creating the Product Category group, and then adding child groups for SubCategory and Product.
- To implement drilldown capability for the rows, I loaded the group property dialog for the Product and Product SubCategory group, went to the Visibility dialog box, set the “Report is initially run” option to Hide, and then set the “Display can be toggled” to the SubCategory and Category, respectively.
- I created the column groups for the Fiscal Year and Fiscal Quarter dimension members in much the same way as the row groups, and implemented a column group drilldown by initially hiding the Fiscal Quarter column group and setting the “Display can be toggled” to the Fiscal Year.
- With row groups by Product Category, SubCategory, and Product, the level of row aggregation (i.e., sum) is by product. To implement row totals for subcategory, category, and a grand total, I clicked the row group dropdown for each of the three groups, and took the option to “Add Total…Before”. If you’re wondering why I selected “Before” instead of the more typical “After”, it’s only to simplify the generated output when the user collapses a row group level.
- I implemented column totals for fiscal year and a grand total in the same general way that I implemented row totals. I clicked the column group dropdown for each of the two column groups, and took the option to “Add Total…Before”.
- All of the above steps were possible using SSRS 2005. However, the next feature (implementing a percentage of total for each column group) is only possible in SSRS 2008. To implement a percentage of total for each of the fiscal quarters (as spread across the fiscal year), I right-clicked in the matrix, on the column separator for the fiscal quarter of year, and selected “Insert Column…inside group”. BIDS will open up a new column (within the fiscal quarter group), where I can implement a percentage of total calculation.
- To actually implement the percentage of total calculation for all row groups, I can take advantage of the SSRS feature to access specific report textbox cells by name using the ReportItems! collection. Since the calculation will depend on the user percentage option, I need to place the following calculation into the expression of the new cell:
 = iif(ReportItems!PctOption.Value=1,
    (ReportItems!txtCategoryFYQtr.Value /
     ReportItems!txtCategoryFYYear.Value),

   (ReportItems!txtCategoryFYQtr.Value /
    ReportItems!txtRowTotalFYQtr.Value)
Note that I need to repeat this for each row group. I also need to set the foreground color property:
 = iif(ReportItems!PctOption.Value=1,
        "DarkViolet", "DarkGreen")
Tip 7: Creating Reports with Cascading Parameters
Figure 14 shows an example of a report against an OLAP database that uses cascading parameters. In this situation, the report generates daily sales for a specific city and product. Because the OLAP dimension could have thousands of products, the report will prompt for a city, and then display only those products “in distribution” (i.e., only those products that have been sold for the current customer).
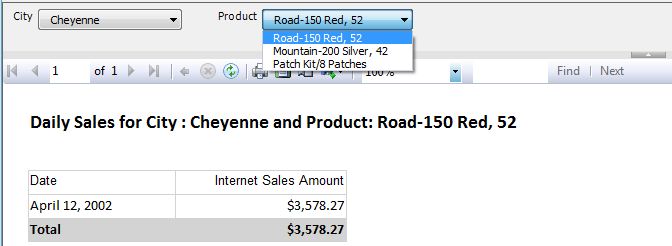
I created the dataset for the report by selecting the date dimension attribute, internet Sales Amount, and then dimension slicer parameters for the Customer City attribute and the product dimension attribute. BIDS will create hidden datasets to bind to the City and Product dropdowns. I can modify the generated MDX for the Product hidden dataset, and then add the following MDX code:
ORDER (
   FILTER ( [Product].[Product].Children,
            [Internet Sales Amount] > 0),
    [Internet Sales Amount], DESC)
ON ROWS
FROM [Adventure Works]
WHERE STRTOSET(@CustomerCity)
Tip 8: Creating Reports against OLAP
Figure 15 shows another example of an SSRS report against an OLAP data source. This report contains a chart that plots monthly sales, along with a 12-month moving average (i.e., for any single month, the average sales going back over the last 12 months). Many analysts will use a chart like Figure 15 to spot any trends where the monthly sales dip below the standard average.
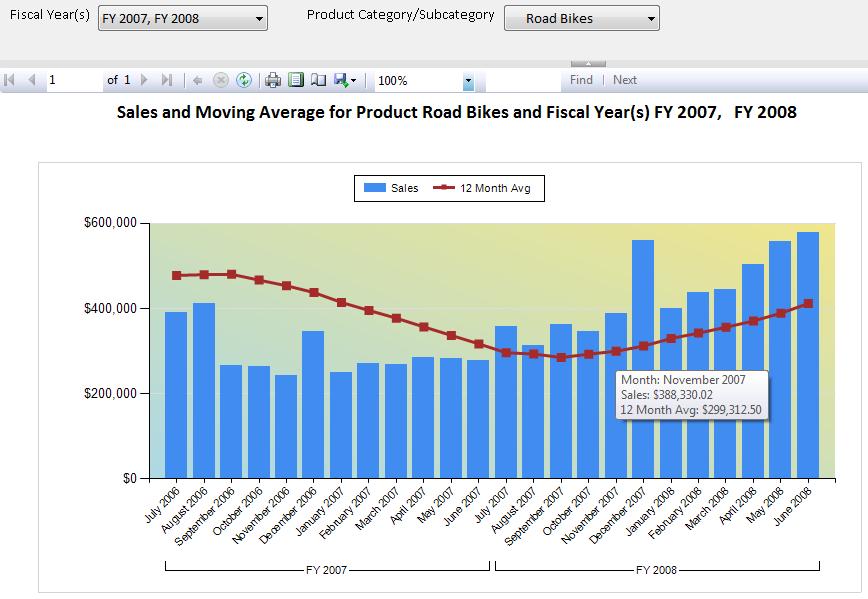
SSRS can easily plot two measures in a chart using different chart types (column bar and line), but I need to provide the calculation for the moving average. Essentially, for any one month (using the MDX CurrentMember statement), I need to calculate the average going back over the last 12 months (using the MDX LastPeriods function).
Here is the full MDX calculation for the Moving Average:
AVG(
   LASTPERIODS( 12,
      [Date].[Fiscal].CurrentMember.PrevMember),
         [Internet Sales Amount])
There’s another topic I need to cover: a rather unpleasant feature that Microsoft introduced in SSRS 2008.
In the main report DataSet, I created a parameter for the Geography Hierarchy. As a result, SSRS automatically generated a second (hidden) dataset with MDX code to populate a parameter dropdown (and that’s a good thing).
SSRS (Visual Studio) also allows you to modify the MDX code for that second dataset, if you only want a subset of the hierarchy (and that’s also a good thing).
However, by default, if you ever go back and modify the first dataset, or modify the new report parameter, Visual Studio will regenerate the MDX dataset code. This will overwrite your custom MDX changes-and that’s NOT a good thing!
Fortunately, there’s a workaround. Note: You must do this BEFORE modifying any of the generated MDX code.
Close the report designer, but keep the overall SSRS project open. In Solution Explorer, right-click on the report, and then take the View Code Option. For each instance of a hidden dataset, find the </Query>.</DataSet> combination, and then enter the following:
<rd:SuppressAutoUpdate>true
       </rd:SuppressAutoUpdate>
</Query>
</DataSet>
Save the code, close the code window, and then reload the report in the Visual Studio designer.
Tip 9: Creating Reports with Performance Gauges and Sparklines
One of the top enhancements in SSRS 2008 was new data visualizations. You might think this simply means “new charting features.” Actually, the new visualization features in SSRS 2008 go well beyond new charting features. SSRS 2008 provides new gauge report options that allow developers to create dashboard-style reports to visually render performance, similar to the types of KPI-style reporting found in tools like PerformancePoint Services.
The new visualization features in SSRS 2008 and 2008 R2 go well beyond new charting features.
Before I begin, the following example originated in Teo Lachev’s outstanding book, Applied Microsoft SQL Server 2008 Reporting Services. This is one of two SSRS books I recommend at the end of this article. In this book, Lachev shows how to use a bullet graph linear gauge to visualize sales as a percentage of sales quota.
I’ve made several enhancements to the example:
- Interactive sorting at the employee group level on the different sales figures.
- Displaying the second indicator in a different color based on the sales percentage.
- Referencing the percentage of sales in the gauge from the ReportItems! Textbox collection.
- Showing two sparkline chart types (a line chart with markers and a smoothed curve line).
- Showing a grand total for the year.
However, the example originally comes from Lachev’s book, which I highly recommend.
Figure 16 shows a report that displays sales and quote information by salesman, along with two major visualizations that are new in SQL Server 2008 and 2008 R2. The first is the performance gauge (new in 2008), and the second is the sparkline (new in 2008 R2). A sparkline is a highly compressed chart (often a line chart) with all labels, tick marks, and other accoutrements stripped out-and is intended to show overall trend/direction.
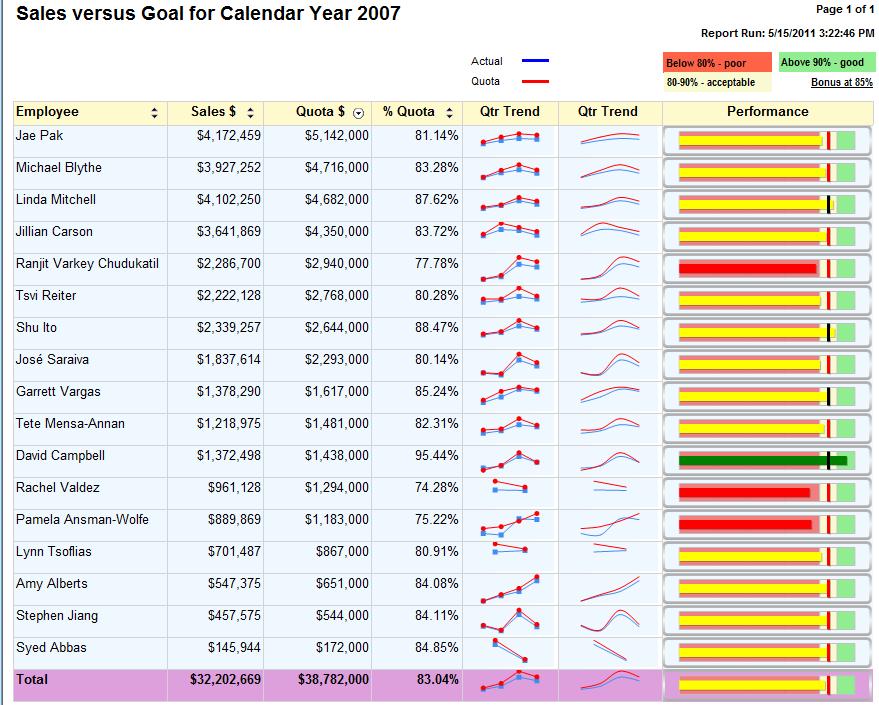
The performance gauge is similar to a visual KPI in PerformancePoint Servers or SharePoint, but with the added benefit of visually displaying how close (or far away) a metric is from a goal. SSRS offers a number of different linear and radial gauges. I chose a linear bullet graph gauge.
The performance gauge consists of the following properties that I need to specify:
- Range Properties: by default, the performance gauge contains horizontal ranges where I can right-click, go to range properties, and specify the range and background color (0-80 light red, 80-90 light yellow, 90-100 light green.
- Linear Pointers: by default, there are two linear pointers to show actual performance within the ranges. I can make the main linear pointer a horizontal bar that maps to the employee percentage of profit, and I can define the linear pointer’s fill color:
=switch(
    ReportItems!txtPctOfQuota.Value < .80,
            "Red",
    ReportItems!txtPctOfQuota.Value < .90,
            "Yellow",
    ReportItems!txtPctOfQuota.Value >= .90,
           "Green")
Tip 10: Running Reports from C#
Suppose you have a situation where you want to programmatically generate an SSRS report to a PDF file-perhaps after finishing a database job. Listing 4 shows how you can execute a deployed report, and then create a file stream to render the report as a PDF file.
Tip 11: SSRS 2008 R2 Potpourri
SSRS 2008 R2 contains a number of miscellaneous enhancements that I’ve found particularly valuable. While not a full list, here are some of the ones I’ve used:
- You can now create page breaks at the report group level. SSRS 2008 R2 now features both a group-level “Page X of Y” in addition to an “Overall Page X of Y”. If you access the properties window for any group, there are new PageBreak properties (BreakLocation, ResetPageNumber, etc.) that you can set. If you’re producing a report that needs to repaginate at the group level, this new feature eliminates the need to calculate pagination manually!
- Additionally, you can scope aggregation to a page-this is a VERY welcome feature for those who produce certain financial reports!
- Creating reports against SharePoint lists is now MUCH easier-there’s no need to reference the .ASMX any longer.
- You can reference the output export format at runtime with the new Globals!RenderFormat global variable.
- Developers who have wanted to join values across report DataSets will be happy with this one-the DataSet object now supports multiple LOOKUP functions, to simulate a JOIN between DataSets.
- When exporting to Excel, you can specify the worksheet tab names.
- You can now define a report expression as an aggregate of an aggregate.
Tip 12: Baker’s Dozen Spotlight: Data-driven Subscriptions
Many SSRS company environments will generate reports on a schedule (typically overnight/off-hours), and deliver the generated report content either via email, file-share, or a SharePoint Document Library. This has become a very popular method for delivering SSRS output to end users, especially when there’s a predictive nature to the way people run reports. This can also improve overall performance and scalability in certain data warehouse/business intelligence environments, where users would otherwise run large/complicated reports during the day.
Report subscriptions can improve overall performance and scalability in certain data warehouse/business intelligence environments, where users would otherwise run large/complicated reports during the day.
An SSRS subscription is just like any standard subscription-you sign up for specific content and you have the content delivered to your front door. In the context of SSRS, it means that you can deliver SSRS content to someone’s email inbox, to a shared network folder, or to someone’s SharePoint Document Library.
SSRS provides many server-side options for defining report caches, snapshots, and subscriptions. I’m going to focus on one specific (and important) feature: data-driven subscriptions. I’m going to take a report that could be run for different product categories, define a schedule to execute the report for different categories, and then specify a deliver type of a SharePoint Document Library. A possible business context here would be generating a sales report for each different brand/category manager in a company: I could also generate a subscription for region/market managers, or some other business workflow.
To start, I’ll create a table in a SQL Server relational database (Listing 5) that will define the contents for a data-driven subscription. The concept of “data-driven” should be obvious; but just in case, I’m storing in a table the information for a subscription that I’d otherwise have to provide SSRS manually. A data-driven subscription is ideal when I have a large number of subscription definitions that could also change over time. In the case of Listing 5, I’ve defined the report to run (rptSalesByBrand, a very simple sales report), the name of the destination output file and SharePoint document library, the render format (static HTML, though it could be a PDF just as easily), and the parameter key for the report instance (since I want a separate output for Bikes, Accessories, and Clothing). Because this specific report is an OLAP report, I need to express the parameter keys in terms of MDX/OLAP Dimension Member notation ([Product].[Category].&[1]). If I had created a report against a relational database, I’d likely need to provide the surrogate integer key for the parameter. In many instances, developers will build a special UI to populate these tables from menu-driven selections.
Also notice the option for AutoIncrement-this will generate a unique output file for each report subscription execution.
The next step is to create a shared execution schedule in SharePoint. In the SharePoint site collection where the report resides, you want to go to the Site Actions, then Site Settings, and define a shared schedule. This is an interface that runs on top of SQL Server Agent, to create a job with a specific execution frequency (e.g., every Monday night at midnight, every two weeks, etc.)
You would think the next step would be to tell the Reporting Services execution engine (via SharePoint) about the subscription table from Listing 5. Unfortunately, there’s an issue. By default, report data sources use Windows authentication, which SSRS will not accept when a report executes “unattended” on a schedule. So I need to go to the site collection folder that contains the deployed data sources, open the data source (which is basically a connection string), and then take the option to store credentials securely on the server for unattended report execution. This account must be a domain account with sufficient rights to execute the report and access the output SharePoint Document Library-a service account usually won’t be strong enough. (An I.T. manager or DBA might create a special “non-human” domain account for these situations.)
Once I’ve taken care of the data source, I can go to the deployed report, click the SharePoint document/file dropdown, and then take the option to add a subscription (and then specify a data-driven subscription). SharePoint will then prompt me for the data source that holds the subscription table (from Listing 5), along with specific columns that SSRS expects (and how they map to the columns in Listing 5), and the name of the shared schedule that will execute the subscription.
Figure 17 shows the output in the SharePoint Document library, when the schedule executes.
Sometimes DBAs want to query the SQL Server Agent log tables to see the history of a schedule. Listing 6 shows a SQL query against both the ReportServer system tables and the SQL Server Agent system tables, to view history of a schedule.
Tip 13: Subreports
Occasionally a report will require multiple levels of detail (i.e., data from multiple 1-to-many relationships). For example, I might need to show a list of products and their sales through the retail channel (summarized by sales territory) as well as sales through the reseller channel (summarized by salesman). A specific product might have sales in either or both channels. Additionally, I want to show each set of sales separately.
Figure 18 demonstrates a basic example of a report with multiple levels of detail (subreports). The main report is rptProductSubReportExample (which shows the main product listing), and the two subreports are rptSubProductInternetSales (which shows Internet Sales by territory for each product) and rptSubProductResellerSales (which shows Reseller Sales by salesman for each product).
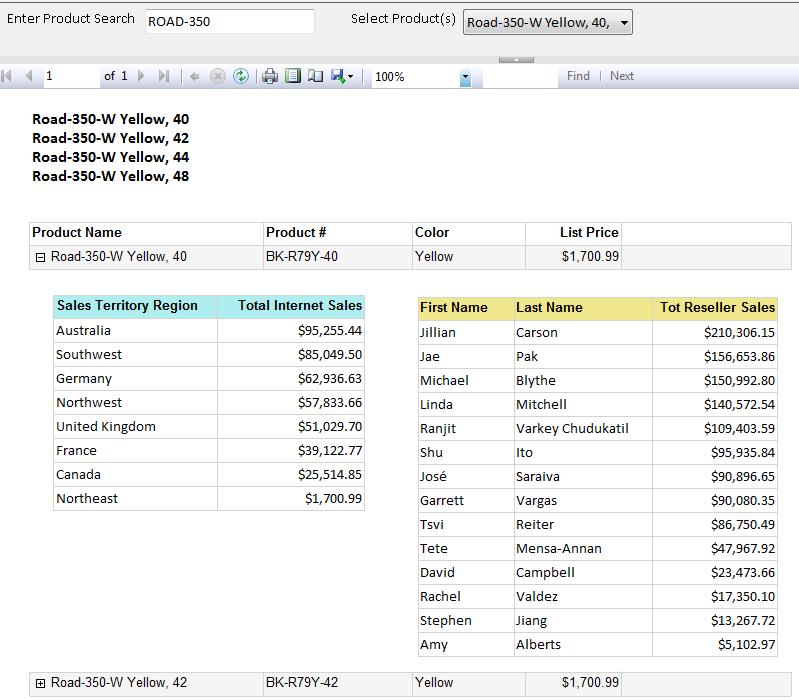
I constructed each of the two subreports by creating a standard SSRS report, but also defining a report parameter for a single product ID. So any time I run either of the subreports independently, SSRS prompts me for a product ID parameter. However, in the main report, after I build a basic layout for a product listing, I can add a reference to a subreport from the toolbox. In the subreport properties, SSRS (BIDS) provides a parameters page where I can map the ProductID value from the main report dataset to the subreport parameter.
Book Recommendations
I highly recommend the following two books. If you work with Reporting Services on a regular basis, these two books should be considered required reading:
Applied Microsoft SQL Server 2008 Reporting Services by Teo Lachev (published by Prologika). I also recommend Teo Lachev’s blog and his other books.
Microsoft SQL Server Reporting Recipes for Designing Expert Reports by Paul Turley and Robert M. Buckner.
I also have additional SSRS book recommendations on my website (www.KevinSGoff.net), but these are the absolute must-have books.