In the good old days when the software industry was young, a developer wrote code all day long. When a collection of features was complete, the code was compiled, moved into a testing environment, and manually tested. Eventually, the features made it into a production environment where something inevitably went wrong. This caused the whole process to repeat at a much more rapid and anxious pace because the business was then without a working system.
The software industry matured. The Good-Old-Days developer has grown up into a software engineer. Engineers take an active role in processes that help to ensure code quality. They understand at least one of the many development methodologies in the industry that help teams produce quality code quickly. They also use more than just an IDE or code editor. In addition to writing code, an engineer spends a fair amount of time reviewing, analyzing, and testing code.
In this article, I'll introduce the concept of code coverage by exploring the value of measurements such as statement coverage, function coverage, branch coverage, and condition coverage. I'll also demonstrate how to generate these measurements using an open source test coverage tool known as Coverage.py. Python engineers use Coverage.py to measure the effectiveness of a test suite when applied to an application. Even though I'm using a specific language and a specific tool in my example, the basic concepts are the same regardless of your programming language and coverage tool. So, if you want to be a mature software engineer, read on.
Basic Concepts
Before jumping into the features of Coverage.py, let's dive a little deeper into test coverage theory and get an understanding of all the possible measurements that can be taken. When measuring test coverage, there are four measurements that can be taken that give insight into the effectiveness of a test suite for a particular application. These four measurements are: statement coverage, function coverage, branch coverage, and condition coverage.
You may be looking at this list and thinking to yourself, “Function coverage is really just a special case of statement coverage and condition coverage is really branch coverage by another name.” The truth is that there are subtle differences.
Statement Coverage
Statement coverage is the easiest coverage concept to visualize. Every software program, regardless of language, is composed of a collection of text files containing lines of code. Statement coverage tells you how many lines of code have been executed by the test suite and how many lines of code haven't been executed. The key measure here is the percentage of code executed for each individual file as well as for the entire application. Obviously, the goal is to achieve 100% coverage.
Even though the key measure is a percentage, a good test coverage tool shows engineers their source code, all nicely color coded by lines of code that have been executed and lines of code that weren't executed. This is useful when you need to add test scripts to improve coverage. A good coverage tool also excludes comments and white space from the calculation of the percentage measurement. Some tools report the number of non-executable lines in each code file. This is a good way to see whether engineers are commenting their code.
Function Coverage
Function coverage tells you what functions have been called and what functions haven't been called. Looking at code coverage from the level of functions is a good way to find dead code. Reviewing function coverage helps you figure out how to improve the coverage of a test suite. For example, a Test Engineer with minimal programming experience may notice that a function named AddCustomer is never called by any of the tests in a test suite. Using this information, it's easy to conclude that a test script creating a new customer needs to be added to the test suite.
Branch Coverage
Branch coverage is a measure that tells you whether each branch of a control statement has been executed. Examples of control statements are if statements and case statements. As an example, a simple if statement with no else clause has two possible branches. One branch executes when the condition of the if statement evaluates to true. The second branch executes when the condition is false. It's important to note that it's possible to have 100% statement coverage and less than 100% branch coverage. Consider the simple function in the following snippet. It contains an if statement that creates two branches through the function.
def BranchCoverageDemo(n):
    if n > 0:
        x = n
    print('The value of x is ' + str(x) + '.')
If this function is passed a value of 2, you'd have 100% statement coverage. Every line of code gets executed when this function is passed a value that's greater than 0. However, the code never branches around the assignment of x. Only a value less than or equal to 0 skips the assignment of x. As a matter of fact, this branch results in an error because x is left undefined. Therefore, it's important to consider more than merely statement coverage when evaluating the effectiveness of a test suite.
It's possible to have 100% statement coverage and less than 100% branch coverage
Condition Coverage
Condition coverage is a measure that tells you whether every Boolean sub-expression within a program has evaluated to both true and false during the execution of a test suite. Consider the lines of code in the next snippet. There are three Boolean sub-expressions in the if statement contained within this function. The first sub-expression is n > 0, the second is x < 0, and the third is the or of the results from the first two sub-expressions.
def ConditionCoverageDemo(n, x):
    if n > 0 or x < 0:
        # Do something
When you look at this function with respect to condition coverage, make sure that you pass parameters causing all three of the Boolean sub-expressions to evaluate to both true and false.
Coverage.py Coverage
Coverage.py doesn't have a reporting option that shows function-level coverage or condition coverage. When I get to the reporting capabilities of Coverage.py, I'll show an easy way to look for missing function calls. However, there's no easy way to unearth conditional sub-expressions that haven't been executed. Unfortunately Python, like most other programming languages, only executes conditional expressions to the point that it needs to. For example, consider the following function, which is similar to the function you just reviewed.
def ConditionCoverageDemo(n):
    if n > 0 and z < 0:
        # Do something
In this function, z never gets defined. The second sub-expression never gets evaluated when passed a negative number because Python doesn't need to evaluate it in order to determine that the entire conditional expression will be false.
This simple function illustrates the importance of condition coverage. A test suite could have tests with 100% statement coverage, 100% function coverage, and 100% branch coverage for this function. However, there's a hidden bug that won't be found unless the first conditional sub-expression (n > 0) is tested with a value that evaluates to true.
Readability is one thing that both engineers and non-engineers like about Python
Reports showing function coverage and condition coverage would be great additions to Coverage.py. If you're a Python programmer looking to get involved with a worthy open source project, perhaps you can add these features.
Getting Started
In this section, I'll show how to install Coverage.py on a Mac. Mac installations are a little more straightforward than Windows installations because both Python and Pip, a package management system for Python, are preinstalled and the environment variables needed to run Python are already set up. If you wish to get a Windows computer up and running on Python, check out https://www.python.org/ to get Python, https://pip.pypa.io/en/stable/installing/#installing-with-get-pip-py to get pip, and https://pypi.python.org/pypi/coverage to install Coverage.py.
The command below uses pip to install the latest version of Coverage.py, which, at the time of this writing, is version 4.2.
$ pip install coverage
If you've already installed Coverage.py, this command fails with a “Requirement already satisfied” error message. If you receive this error message, you already have Coverage.py on your computer. To check the version of Coverage.py, you can use the following command:
$ coverage --version
If you don't have the latest version of Coverage.py, use pip to upgrade your existing version of Coverage.py. The next snippet shows this command:
$ pip install --upgrade coverage
Because Coverage.py is a frequently updated open-source tool, it's a good idea to periodically check your version of and run the upgrade command. If you're on the most recent version of Coverage.py, the upgrade command lets you know and nothing will be modified on your computer.
Statement Coverage
Running a simple example from the command line that measures statement coverage is the best way to get a feel for how Coverage.py works. Consider the code in the next snippet. It shows a simple Python script saved in a file named statementcoverage.py. It accepts one parameter and, based on the value of that parameter, executes one of three branches.
# Function with multiple branches.
Import sys
def StatementCoverageDemo(number):
    if number < 0:
        print(str(number) + ' is negative.')
    elif number == 0:
        print(str(number) + ' is 0.')
    else:
        print(str(number) + ' is positive.')
# Main processing starts here.
if __name__ == '__main__':
    n = float(sys.argv[1])
    StatementCoverageDemo(n)
Normally, this script is executed using the command in the next snippet. This command tells Python to execute the script statementcoverage.py and pass it a value of 5. The file statementcoverage.py must be located in the present working directory.
$ python statementcoverage.py 5
To measure statement coverage, you need to allow Coverpage.py to run the module. Do this by executing the command in the next snippet.
$ coverage run statementcoverage.py 5
Once this command runs, you can use Coverage.py's reporting capabilities using the Report command. The snippet below uses the Report command to create the summary report shown in Figure 1.
$ coverage report -m
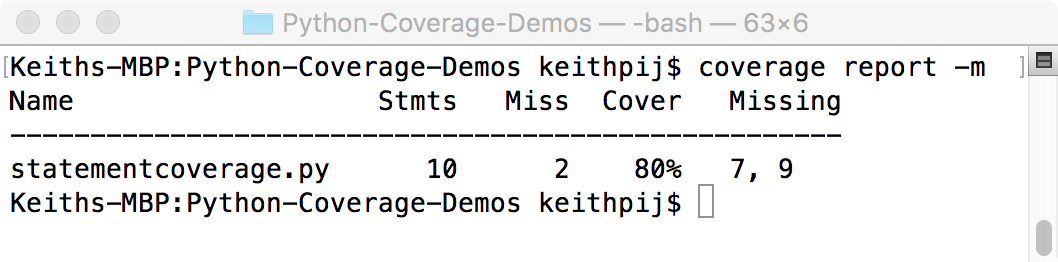
The report command creates textual summary. In a later section, I'll show how to use Coverage.py to create HTML-based reports that are much more user friendly. Meanwhile, the summary report shown here is easier to use when you're building out your test suite and need to see quickly how much code has been covered and the location of the missing code.
For each file executed, this report shows the total statements, the number of lines that were missed, the coverage as a percentage, and the line numbers of the missed code. The -m switch causes the Missing column to be displayed with this report. If you don't want to see this column, you can omit the -m switch.
Coverage.py saves coverage data in a file named .coverage created in the same directory in which you executed Coverage.py. This file name can be changed using the COVERAGE_FILE environment variable. Use the COVERAGE_FILE environment variable if you'd like to store coverage data in another directory.
By default, each run of Coverage.py erases the data from the previous run. If you need to run your program multiple times to get complete data, you can use the Append flag. This flag allows you to accumulate coverage data across multiple runs of Coverage.py. If you're appending the data from multiple runs of Coverage.py, at some point, you'll want to erase coverage data stored in the .coverage file. To manually erase coverage data, you can use the Erase command. This command deletes the .coverage file located in the present working directory.
The set of commands shown in the next snippet erase any existing coverage data before running three separate tests against the statementcoverage module. Each test appends its data to the .coverage file.
$ coverage erase
$ coverage run -a statementcoverage.py -1
Value is negative.
$ coverage run -a statementcoverage.py 0
Value is 0.
$ coverage run -a statementcoverage.py 1
Value is positive.
Branch Coverage
Branch coverage will be demonstrated in the next snippet. This module is similar to the function shown previously when the basic concepts of branch coverage were discussed. In this module, a dead function exists so that you can see how Coverage.py makes the distinction between missed statements and missed branches within the summary report.
import sys
def BranchCoverageDemo(n):
    if n > 0:
        x = n
    print('The value of x is ' + str(x) + '.')
def DeadFunction():
    print('I am not being used.')
if __name__ == '__main__':
    n = int(sys.argv[1])
    BranchCoverageDemo(n)
Use the - -branch switch with the run command, as shown in the next snippet, to create branch coverage measurements.
$ coverage run --branch branch-coverage.py 1
Now when you run the summary report, you'll see the data shown in Figure 2. Use the -m switch when running a report on coverage data that contains branch coverage information. Without this switch, the column showing missing branches isn't shown.
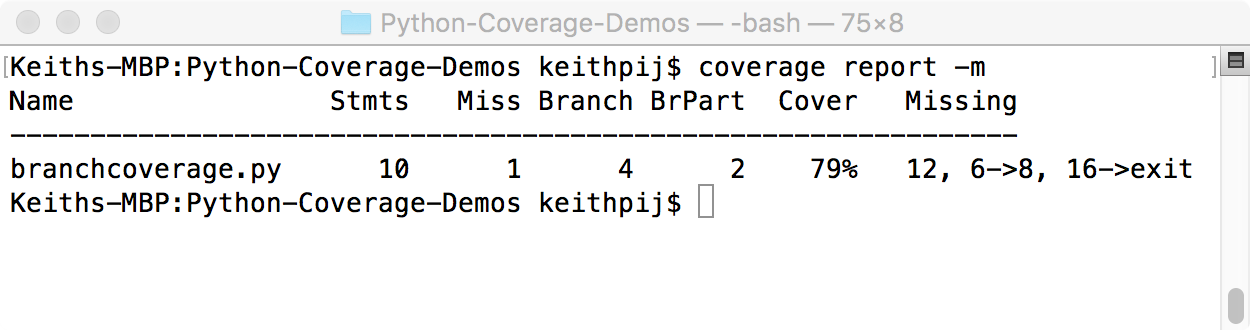
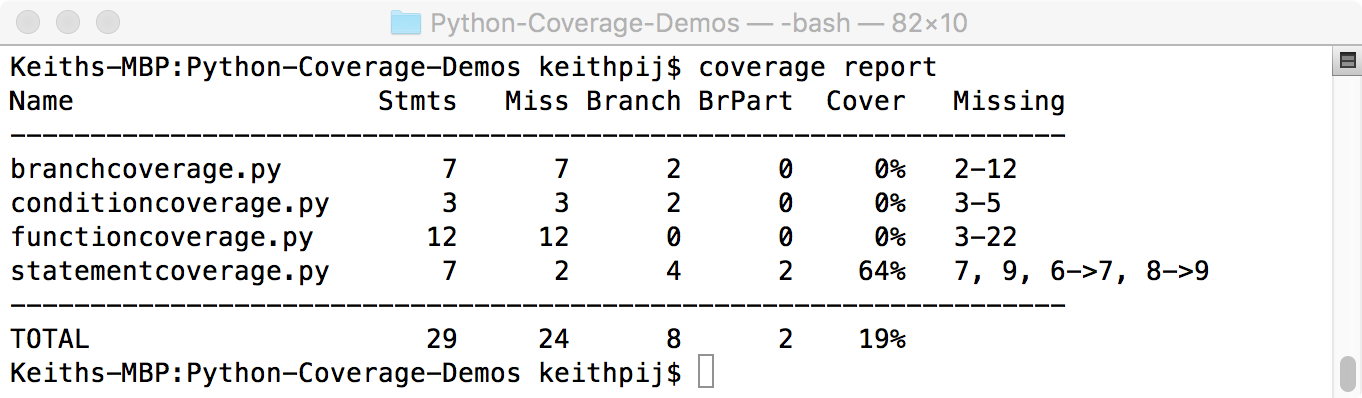
There are a few things worth noting in this report (in Figure 2) because it shows both statement coverage and branch coverage. First, one line of code has been missed. The Miss column indicates this. The Branch column indicates that there are four possible branches in this module. Two of the four branches were executed during this test, as indicated by the BrPart column.
The Missing column shows the most useful information in this report. This column shows both the missing statements and the missing branches. During this test, line 12 was missed; this is the body of the DeadFunction. Also, the branch from line 6 to line 8 was missed as was the branch from line 16 to the end of the module. This last branch represents the unit test itself. Remembering the quick Python lesson above, this branch only executes when another module imports the branchcoverage module. Measurements of the test code itself aren't useful and dilute the measurements of the application. Fortunately, Coverage.py provides a mechanism to exclude code like this from the measurements it collects. Any line with a comment of "pragma: no cover" is excluded. The next snippet shows how the last three lines of the branchcoverage module must be written to prevent the test code from being included in the command line reports.
if __name__ == '__main__': # pragma: no cover
    n = int(sys.argv[1])
    BranchCoverageDemo(n)
Figure 3 shows the modified summary report. Notice that the number of total statements and the number of total branches only include application code. The statements and branches from the test code have been omitted.
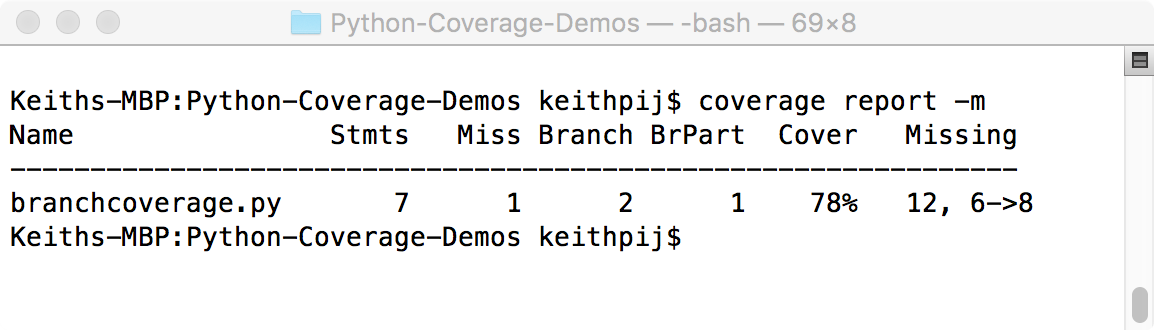
The final fact worth noting about the coverage report above is the calculation of the coverage percentage (the percent value in the Cover column). When using the --branch flag during a run of Coverage.py, this percentage is calculated based on the combination of branch coverage and statement coverage. Specifically, this percentage is the sum of tested branches and tested statements (6 + 1 in this report) divided by the sum of total statements and total branches (7 + 2 in the same report). The percentage you get when 7 is divided by 9 is 78%.
This is an unfortunate way to calculate Coverage. Information is lost whenever two measures are combined into one in this manner. I'd much rather see a separate measure for statement coverage and another separate measure for branch coverage. In other words, 6 divided by 7 or 86% as the measure for statement coverage and 1 dived by 2 or 50% as the measure for branch coverage.
Reporting Options
Up until now, the summary report produced by the report command showed the measurements taken by Coverage.py. Engineers find these summaries useful when developing tests and unit-testing code. However, they provide only summary information and aren't well suited for sharing coverage data and reviewing code.
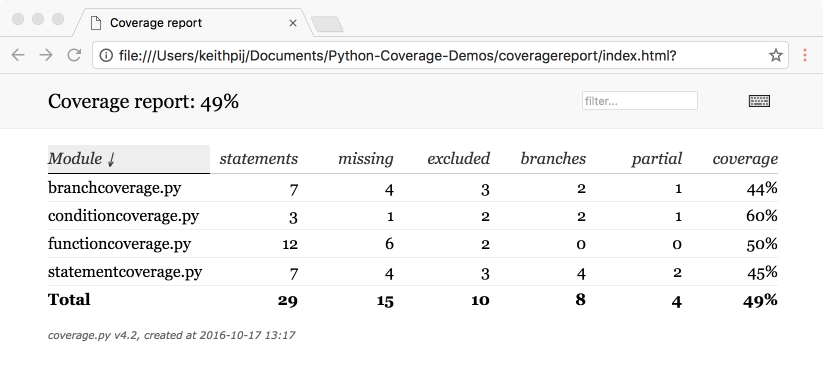
Coverage.py provides a more advanced reporting capability. The html command, as the name suggests, produces an HTML-based report that shows both summary information and source code. Once a .coverage file has been created, the command in the next snippet creates a collection of HTML, JavaScript, CSS, and image files, and places them in a directory named coveragereport.
$ coverage html -d coveragereport
Clicking on the index.html file within this directory brings up the summary page in your default browser. The summary page contains all of the same information found in the summary report but columns can be sorted allowing the report to be sorted by module name, number of statements, missed lines of code, etc. The list of modules can also be filtered. Figure 4 shows a sample of the summary page.
The module names within the summary page represent links that take the user to a view of the module's source code. Figure 5 shows a sample of the source code view. Notice the color coded lines highlighting missed code, covered code, excluded code, and missed branches. The buttons at the top of the page toggle the color coding.
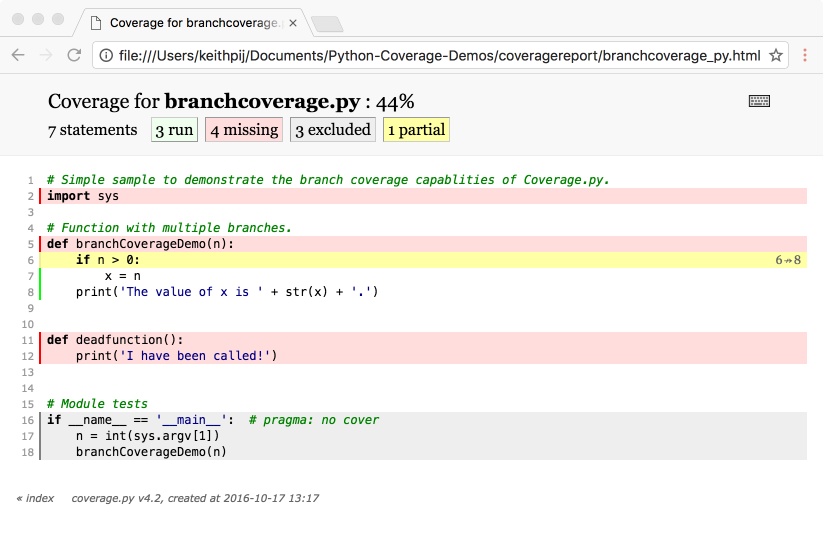
The generated Web pages that make up this report aren't data driven. They don't read data from the underlying .coverage file. They contain hard-coded values, so be sure to recreate these pages each time you run your tests.
Parallel Tests
Often, you want to run tests in parallel and combine the results when all tests complete. When measuring coverage within a continuous integration service such as Jenkins, Circle CI or Travis CI, you need to use the parallel test features of Coverage.py. Integration services take your tests and run them in parallel. When running tests in parallel, the data from each test must be saved in a uniquely named file so that it can later be combined with data from other tests. Once all files are combined, a single report can be created.
Coverage.py has a parallel-mode switch that provides this feature. To demonstrate how Coverage.py collects data in parallel, consider the three commands shown in the next snippet that use the --parallel-mode switch. These three commands run in this fashion are not a true parallel test. They are just an experiment to show how Coverage.py saves data in parallel mode. A true parallel test would run these tests in different processes and possibly on different servers. If these tests need to be run manually, use the append flag discussed previously. Nevertheless, this simple test represents the easiest way to demonstrate how Coverage.py stores data from separate tests when using the parallel mode flag.
$ coverage run --parallel-mode
        statementcoverage.py -1
$ coverage run --parallel-mode
        statementcoverage.py 0
$ coverage run --parallel-mode
        statementcoverage.py 1
Each test generates a uniquely named data file containing its results when running Coverage.py in parallel mode. After running these three commands, there will be three separate files in the current directory. On my computer, the three files created were:
.coverage.keiths-MBP.home.13369.043525
.coverage.keiths-MBP.home.13370.876811
.coverage.keiths-MBP.home.13371.712728
The naming convention used appends the computer name, process name, and a random number to the string .coverage.
Next, combine the data from these three parallel runs into one coverage file. Using the combine command combines the data in these three files, as shown in the next snippet.
$ coverage combine
The combine command looks for all files in the current directory that start with .coverage. Once the combine command executes, the files from the parallel runs are erased and the data they contained is in a single .coverage file. The combine command also allows you to identify specific files and directories to combine. When specifying a directory, all files that start with .coverage are combined into a single .coverage file. The example in the next snippet combines the cov.dat file located in the current directory with all files that start with .coverage located in the parallel_run_files folder. The result is a single .coverage file located in the directory where combine was run.
$ coverage combine cov.dat parallel_run_files/
If you get halfway through a series of parallel tests and you wish to start over and erase all your data, the easiest thing to do is to combine and then use the erase command. The erase command doesn't remove any files created when using the parallel-mode flag.
Using a Configuration File
All of Coverage.py's command line switches are specified in a configuration file. This not only saves typing when running individual unit tests but the configuration file can be checked into source control and shared with other engineers. This allows all of the engineers on a team to consistently apply Coverage.py to their source code. There are also features of Coverage.py that are only configurable within a configuration file. For these reasons, it's a best practice to use configuration files.
The next snippet shows a sample configuration file. The name of the configuration file is .coveragerc and it uses the INI file format. Square brackets denote sections with name value pairs under each section. Lines starting with # or ; (the pound sign or the semi-colon) are treated as comments and are ignored. The file itself needs to be located within the same directory in which Coverage.py runs.
# .coveragerc to control coverage.py
[run]
branch = True
source = /Users/keithpij/Documents/CoverageDemos/
omit = tests.py
parallel = False

[report]
show_missing = True

[html]
directory = coveragereport
Categories correspond to Coverage.py commands and name value pairs correspond to switches. What's worth noting in this configuration file is the value for source in the run category. This informs Coverage.py to include all files in this directory when generating reports. If a file hasn't been tested, it still shows up in the summary report and the HTML report with 0% coverage. This feature is also available as a command line switch of the run command but is much easier to specify in the configuration file. Finally, omit can be used to omit files from being included in coverage data. This configuration file excludes tests.py. Test.py is a test module that I'll describe in the API section of this article.
Using the configuration file above, you can issue the commands in the snippet below without any switches and Coverage.py checks for branch coverage, turns off the parallel testing feature, shows missed lines of code, and uses the directory coveragereport for the HTML-based report. Figure 6 shows the summary report listing all application files. Notice in the summary that all application files located in the current directory are included and tests.py has been excluded.
$ coverage run statementcoverage.py 1
$ coverage report
Using the Coverage API
Coverage.py has an API that allows it to be called from Python code. The interface is straightforward, so I'll jump right into a code sample. Listing 1 shows a Python module that combines all of the tests shown in this article into a single test.
Listing 1: Test module using the Coverage.py API
# test.py module
import coverage
import branchcoverage
import conditioncoverage
import functioncoverage
import statementcoverage

cov = coverage.Coverage()
cov.erase()
cov.start()

branchcoverage.branchCoverageDemo(3)
conditioncoverage.conditionCoverageDemo(1, 1)
functioncoverage.startFunction(-1, 1)
statementcoverage.statementCoverageDemo(1)

cov.stop()
cov.save()

cov.html_report()
cov.report()
In order to use the Coverage.py API, the coverage module must be imported. To configure Coverage.py, use the configuration file described previously. When running this module from the command line with the configuration file shown in the previous section, Coverage.py enables branch coverage, turns on parallel mode, includes all files in the source directory, shows missed lines of code, places the HTML report in a directory named coveragereport, and prints a textual summary. The last two lines of code create the HTML report and cause this test module to output a textual summary. These two lines should be omitted when using this test module within a continuous integration service. It's a best practice to have a test module like this in every project. If your tests take a long time to run, consider setting up multiple test modules so that they can be run in parallel.
It's a best practice to have a test module like this in every project.
Wrapping Up
In this article, I started a conversation about code quality by discussing the basic concepts of code coverage and demonstrating code coverage using Coverage.py, an open-source tool for Python developers. If code quality is of interest to your engineering team (and it should be), consider investigating static code analysis and continuous integration in addition to code coverage. Continuously integrating code, testing code, and statically analyzing code are capabilities that can be easily integrated into most source code management tools. For example, GitHub.com allows third-party tools to be integrated into the pull request workflow. This means that every time a change is submitted, the new code can be compiled, tested, and statically analyzed before being merged into the master branch of your application.
This article touched on the basic features of Coverage.py. There are many ways to fine-tune Coverage.py that weren't discussed, such as using third-party plug-ins, measuring sub-processes, and using regular expressions to indicate lines of code that should be excluded.