In early 2004, Microsoft released a new set of extensions to SQL Server 2000 called SQL Server 2000 Reporting Services.
SQL Server Reporting Services provides a comprehensive platform for creating, managing, securing, scheduling, and outputting data from SQL Server, Oracle, OLE DB and ODBC data sources. When Microsoft created SQL Server Reporting Services they created it as an extendable platform. You can create your own data extensions and your own output extensions. In this article, I'll show you how to create your own custom data extensions for SQL Server Reporting Services.
Where to Get Reporting Services
When Microsoft created SQL Server Reporting Services they created it as an extendable platform.
You can download a 120-day evaluation copy of SQL Server 2000 Reporting Services from the SQL Server Web site at www.microsoft.com/sql. After downloading reporting services you simply run the installer. The installer installs two sets of components: the Reporting Server components and Report Designer components. The server components require that you've installed Internet Information Services (IIS) on the server where you install Reporting Services. Reporting Services uses a Web service-based API that requires IIS. The report designer is hosted inside of Visual Studio .NET 2003 and requires any standard edition or better of a Visual Studio .NET 2003 product to be installed wherever you install the designer. When I am developing reports I generally install the server and the designer components on the same machine. When I am done working on my reports I then deploy them to a production report server. Once you have installed the various server and client components you can go to work creating your first report.
Creating Your First Report
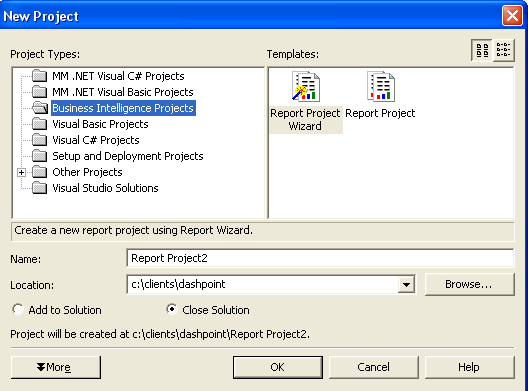
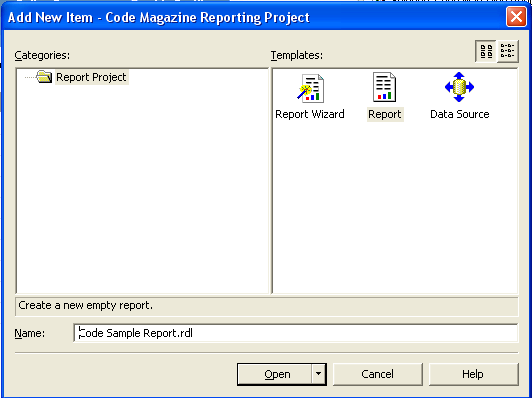
After installing Reporting Services you can create your first report. To create your report you need to launch Visual Studio .NET and create a new report project by selecting File and then select New Project. This will open the New Project dialog box. Select the Business Intelligence project type. You can then create a project using a wizard or you can create an empty Report Project. Figure 1 shows the Business Intelligence project types. Once you have created your reporting project you can create a new report by right-clicking on the reports folder in project. You have two options at this point. You can select Add New Report which will activate the Report Wizard. The second option is to select Add New Item. This option will bring up the Add New Item dialog box (Figure 2) which allows you to create a new report from scratch.
After you create your new blank report you will be presented with your report in the Visual Studio IDE. Now you can go to work on creating your report.
Selecting Your Data
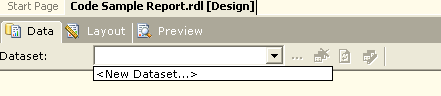
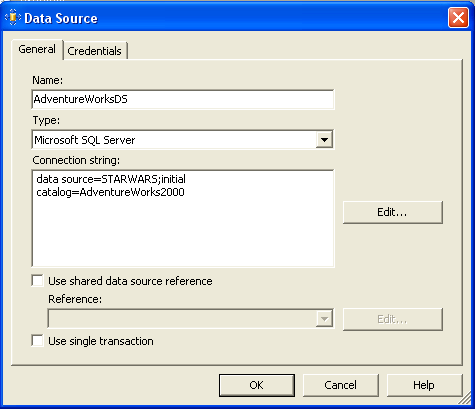
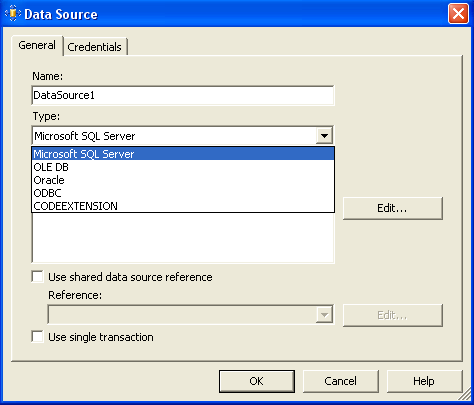
To create your report you must first query the data from your database. You do this in SQL Server Reporting Services by selecting New Dataset from the Dataset drop down combo box (Figure 3). Selecting this option will activate the Data Source dialog box (Figure 4) which you use to connect to your database. You can select from the various drivers that come with Reporting Services (SQL Server, Oracle, OLE DB, and ODBC). Here you'll also specify the login credentials that are required to connect to your database server.
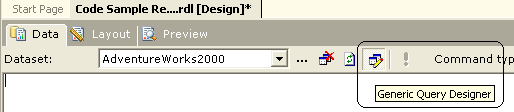
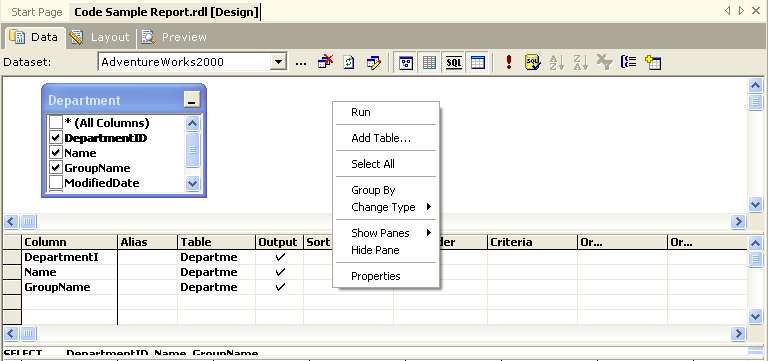
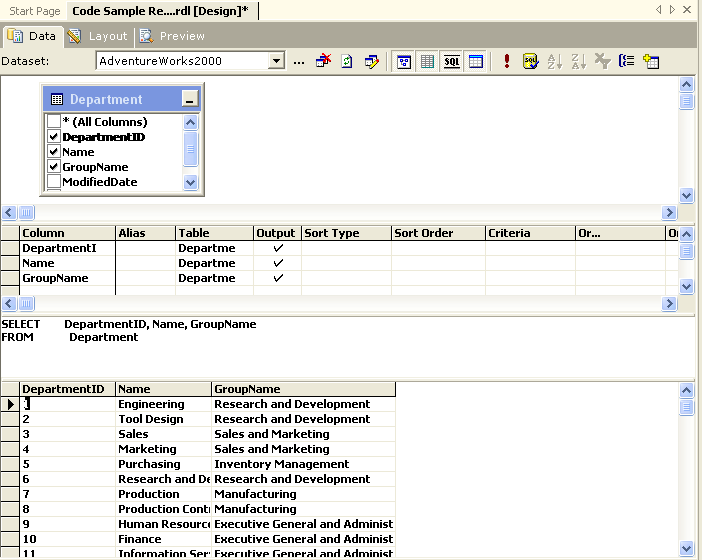
After connecting to your database you can then create a query that will be sent to your database server. The easiest way to create a query is to use the Generic Query Designer that comes with SQL Server Reporting Services. To activate this dialog box you click the Generic Query Designer icon on the report designer toolbar (Figure 5). This will activate a developer-friendly query designer. You can right-click in the query design surface (under the toolbar) and select Add Table... from the shortcut menu (Figure 6). This will allow you to select the tables that you'll use for your query. Select the columns from your tables to show on your report. Figure 7 shows the query designer with a number of columns from the departments table selected. This table is found in the AdventureWorks sample database. Click the run (!) command from the report designer toolbar to execute the query.
Creating the Layout
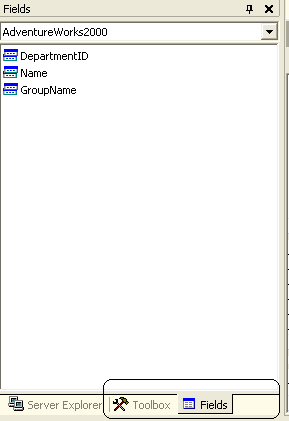
Once you have created your query you can begin report layout. First switch to Layout view. You will use the Toolbox and Fields tabs (Figure 8). The Toolbox tab contains the various UI components (text boxes, labels, and so on) that you can drag and drop onto your report. The Fields tab contains the columns returned from your query.
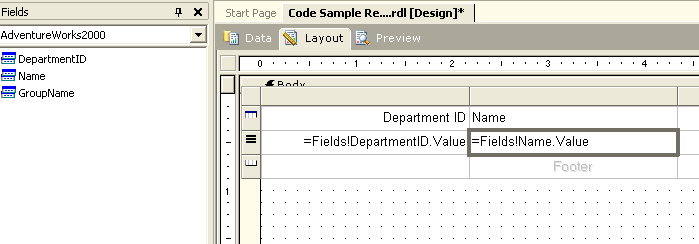
From the Toolbox tab select the Table object and drag one onto your report layout. Next, select the Fields tab and drag and drop the columns into the Detail area of the table object. Figure 9 shows the layout with the departmentid and name fields specified for the report. Once you have selected some columns from your query to display on your report you can preview it and later deploy it to your reporting server.
Previewing and Deploying Reports
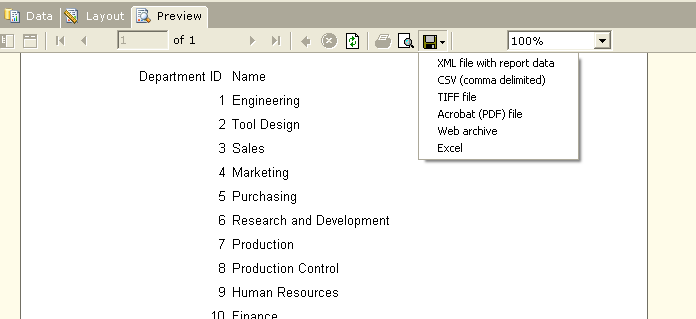
To preview your report you simply select the Preview tab from the report designer. (It's the third tab over, the one to the right of the Layout view tab.) The Preview tab lets you zoom, page, and export your report to various formats. Figure 10 shows the Preview pane with the various export formats available in SQL Server Reporting Services. Once you have finished laying out your report you deploy it to your reporting server.
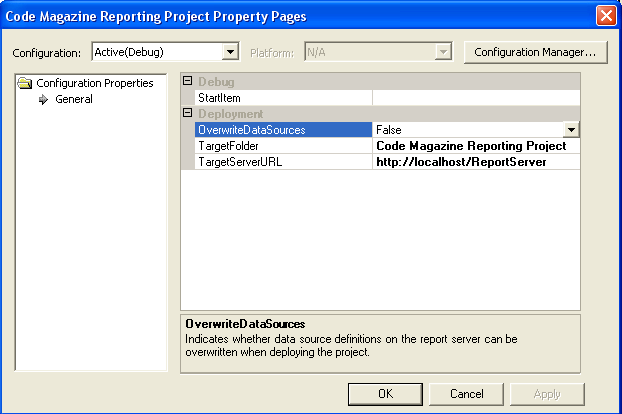
To deploy your report you must specify the location of your reporting server. To specify the reporting server location, right-click on your project and select Properties. Set the TargetServerUrl property to the location of your reporting server. Figure 11 shows this dialog with the TargetServerUrl property set.
Now that you have a basic understanding of SQL Server Reporting Services you can now look at the process of creating data extensions.
Why Extend Reporting Services?
I am currently working with a client that has chosen SQL Server Reporting Services as their reporting platform. During their evaluation of Reporting Services they reached the conclusion that SQL Server Reporting Services would not meet all of their needs "out of the box." One primary need is the ability to query data from a data source and then pre-process that data before sending it to a report for layout. SQL Server Reporting Services does not handle this situation in its default configuration. When they asked Microsoft what they should do, Microsoft recommended creating a data extension. When Microsoft created SQL Server Reporting Services they had the foresight that people would need to extend reporting services. Thus were born Data and Delivery Extensions. Data extensions provide data. Delivery extensions output reports into different formats.
Data Extensions 101
A data extension provides data to the reporting services environment. In its most basic terms, a data extension is a class that very closely resembles a Data Provider class. It has objects like Connections, Commands, Readers, Parameters, etc. Let me walk you through the steps of creating a data extension using Visual Basic .NET.
Creating Data Extension
Begin creating a data extension by creating a new Visual Basic .NET class project. Next, add a reference to the reporting services interfaces assembly. You'll find this file at the following path:
C:\Program Files\
Microsoft SQL Server\
MSSQL\
Reporting Services\
ReportServer\bin\
Microsoft.ReportingServices.Interfaces.dll
Once you have added this reference you can go to work implementing the interfaces required of a data provider.
The Data Extension Interface
With the reference added, your next step is to implement the minimal interfaces required. Your extension must implement the following interfaces found in the Microsoft.ReportingServices.DataProcessing namespace:
- IDbConnection
- IDbCommand
- IDataReader
Thankfully, implementing these interfaces in Visual Studio .NET is pretty simple. Just use the Implements keyword after your class definition and Visual Studio will "stub" in all of the property and method signatures for you. You then simply implement each method and property.
Listings 1 - 3 show the implementation code for each property and method used by SQL Server Reporting Services when accessing your data extension.
SQL Server Reporting Services could not meet all of their needs "out of the box."
As you can see, the interfaces you need to support are quite simple. The real meat of this code is the GetDataSet function found on the DspiReader class. You put your custom query code in the GetDataSet function. This standard .NET code creates a single table dataset. It's up to your imagination what to put in this function. One idea is to query some data from your database?that data will then be pre-processed and finally sent to your layout for display.
Installing Your Driver
Once you have implemented the required API's you will need to install the driver you built. You install your driver by first copying the DLL into the following directories:
C:\Program Files\Microsoft SQL
Server\MSSQL\Reporting
Services\ReportServer\bin

C:\Program Files\Microsoft SQL
Server\80\Tools\Report Designer
Yes, you do have to copy the code into two locations. One is for the report server and the other is for the report designer. Why the designer and server don't use the same extension is beyond me. One item to be aware of is you might need to shut down the VS.NET IDE if you are working on a report that uses your code. After you have copied your DLL to the appropriate directories you will need to modify a number of config files that come with SQL Server Reporting Services. These entries are as follows:
Add the following entry to the <Extensions><Data> section of the RSReportDesigner.Config file.
<Extension Name="CODECUSTOM"
Type="VBRSTEST.DpsiConnection,VBRSTEST"/>
The VBRSTEST.DpsiConnection entry instructs SQL Server Reporting Services to use the DpspiConnection class object from the VBRSTEST Namespace. The second part of the entry (after the comma) points at the namespace as well.
The next step is to grant rights to your data extension. To do this you need to add the following entries to the Rssrvpolicy.config and the rspreviewpolicy.config file found in the ReportServer and Report Designer directories respectively (where you copied your DLLs).
<CodeGroup
class="UnionCodeGroup"
version="1"
PermissionSetName="FullTrust"
Name="CustomGroup1"
Description="Custom extension ">

<IMembershipCondition
class="UrlMembershipCondition"
version="1"
Url="c:\Program Files\Microsoft SQL
Server\MSSQL\Reporting
Services\ReportServer\bin\VBRSTEST.dll
"/>
</CodeGroup>
The URL parameter must point to the DLL in the directory the config file is responsible for. That is, the rssrvpolicy file should point at the DLL in the ReportServer\bin directory. The designer config file should point at the DLL in the Report Designer directory.
Calling Your Data Extension
The next step is to create a report that uses your data extension. Your data extension will show up in the list of data types in the Data Source dialog box (Figure 13). For your custom data extension you will need to put some "dummy" text into the Connection String property. The data extension you created does not really support a connection string but the report designer requires that you use one. You will also need to check the "No Credentials" checkbox on the Credentials tab.
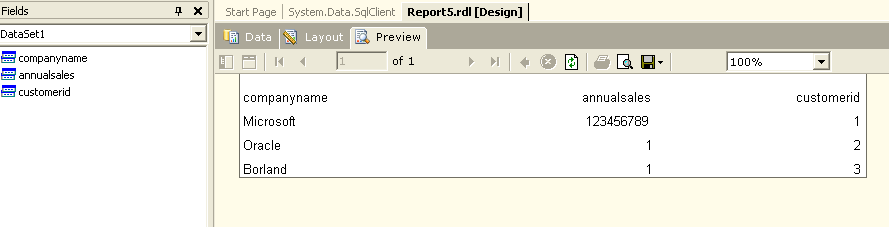
Once you specify your dataset, enter some text in to the query window and your custom extension will return the data from the GetDataSet function. Figure 14 show the data returned from your function in the Preview pane.
Now at this point you can create the layout of your report using the same steps you used to create the department report.
What's Next?
This is just an initial foray into creating a custom data extension. In a future article I will take you through more advanced extension techniques including: implementing the interfaces required to support parameters, driver debugging techniques, code access security techniques, and finally how to use the Web service interface to call reports using your custom driver.