
We've all faced those irritable questions about our applications running in production.
Typically a system administrator will spring one on you on a Friday afternoon just when you're finishing out the week with a game of foosball.
Why did this request fail?
What is causing so many disk IO spikes?
What requests are failing as a result of this error?
Why is the application running so slowly?
Why are all the resources being gobbled up on the Web server?
These questions often make us stare blankly for a while, mumble something, and then scramble back to our cave (or server room) for hours on end trying to provide answers,
What if things could be different? What if you could give the system administrator enough information to troubleshoot most basic issues and only come to you with the tough ones? What if, when she came to you, you could flip a switch and your application would start giving you the answers and you could get back to the Friday afternoon foosball tournament?
What if you could give the system administrator enough information to troubleshoot most basic issues and only come to you with the tough ones?
Sounds like a dream, right? Enter the Enterprise Instrumentation Framework (EIF). The EIF allows you to generate all sorts of data about your applications executing on the production servers. With a few well-placed, single-line static method calls into the EIF API, data can be streaming out of your applications, collected, parsed and displayed to answer any number of questions. And, of course, you provide access to the switch?turning up the volume on some transactions and hitting the mute button on others.
**Instrumentation **and the Goals of the EIF
The word “instrumentation” makes a simple process sound very complicated (as is often the case). As you may have guessed, instrumentation is a reference to actual instruments (like a tachometer) found in the physical world. A car's engine, for example, provides diagnostic and performance data to both drivers and mechanics. This data gets transmitted and processed by “listening” instruments. The process of embedding sensors into a system (a physical vehicle or a software application) for the purpose of diagnosing problems is referred to as instrumentation. In fact, most cars today can be connected to the ultimate instrument, a computer. This computer can be used to turn on all kinds of diagnostic information (at runtime) and then provide mechanics useful data to solve most problems without going back to the manufacturer for a fix.
In the software realm, instrumentation involves trace code (sensors) placed inside key areas of the application (components). The goal is to allow administrators (like mechanics) to turn this diagnostic information on and off as required, and thus use this information to solve issues without having to go back to the application's developer (or manufacturer).
Sounds like a great idea?and it is! However, in the real world, instrumentation gets pushed aside and all too often left out of the majority of applications. The reasons for this are:
- The environment may not support good instrumentation
- The instrumentation code is verbose and thus compromises code readability
- The instrumentation code is hard to write, and even harder to justify given a typical, aggressive development schedule
- The instrumentation code does not provide enough good information to make it worthwhile
- The instrumentation code degrades performance
We designed the Enterprise Instrumentation Framework to eliminate every one of these reasons not to leverage instrumentation in your applications. In fact, the goals for the EIF are right in-step with countering each of these issues:
- Provide a single, unified API for outputting instrumentation data to all data stores
- Provide a simple, one-line method call for instrumenting
- Provide a lot of good information in an easy to use format
- Provide the ability to trace a business request across method calls and across process boundaries
- Allow instrumentation to be turned on/off and up/down as required
Let's take a look at how the EIF realizes these goals.
A Single, Unified Instrumentation API
If you've been around long enough to get an actual application into production (congratulations!), you have undoubtedly experienced: “runs on my machine,” or “runs in the development environment” answer to the question, “why is this action failing on the production server?” To help answer this question, you might have checked out the offending source code, littered it with writes to the event log, and then shoved the DLL up to the production server. You then sit and monitor the event log. Once you gather enough information (and hopefully fix the issue) you then have to strip all the event log calls out of your code and again update the server. This can be a tedious process to be sure. EIF works in the same manner but without the tedium, and with a much more structured and controllable approach.
Without EIF, you have a lot of choices (and a big decision) to make regarding what data store you wish to target with your tracing code. You can do all of the following to trace your application:
- Write to the event log using the
System.Diagnostics.EventLogclass - Fire messages to WMI using the System.Management namespace
- Use the System.IO namespace to write to a text file
- Call into the System.Messaging namespace to output information to a message queue
- Log trace messages to the database using System.Data
- Output messages with System.Diagnostics.Trace
- Target performance counters
Once you choose a means to output your tracing and target your choice's associated event store, you are essentially stuck with that decision. All your trace code will be written to specifically target the underlying event store. In fact, you may be writing to the event log today but would prefer to write to SQL server?no small change.
Clearly, what you have now is a separate API for every event store. What you want is a common approach to allow developers to instrument their code, targeting all existing event stores (WMI, event log, text file, etc.) and all new event stores that might be created post application release. This unifying tracing API is the EIF. Here is how it works.
Instrumentation?The Basics
Instrumentation is often one of the last tasks a developer does before checking in their code (or passing code review). Like commenting, instrumentation is easy to skip when the schedule is tight and the code is difficult to implement. In addition, you don't want your instrumentation code to be a distraction when you view the core functionality of the application. To help solve these issues, instrumentation should be easy to implement and the code should be minimal.
The word “instrumentation” makes a simple process sound very complicated ... instrumentation is simply a reference to actual instruments (like a tachometer) found in the physical world.
You will soon see that the EIF API offers just that. In fact, applying the EIF is a straight-forward, two-step process:
Let's take a look at a simple example of this in action.
The EIF in Action
To output messages to event sinks (listeners like the event log) with the EIF you simply call the static Raise method of the TraceMessageEvent class as follows:
TraceMessageEvent.Raise("MyMessage");
This one line API call makes good on the promise of a simple instrumentation API.
The next step is to generate (or create) a configuration file. This configuration file will allow you (or the administrator of your application) to turn on and off the output and capturing of trace messages in your application. Like all config files in .NET, this file is XML. Let's take a quick look at the details of the XML contained in this file:
- Event Sources: Used to indicate the source (or provider) of the trace message (application is the intrinsic event source)
<eventSources>
  <eventSource name="Application"
               type="softwareElement"
               internalExceptionHandler="ignore"
               description="Application event source." />
</eventSources>
- Event Sinks: These are the consumers of the trace messages (event log for example)
<eventSinks>
  <eventSink name="wmiSink"
             description="Outputs events to WMI."
             type="Microsoft.EnterpriseInstrumentation.EventSinks.WmiEventSink" />
  <eventSink name="traceSink"
             description="Outputs events to the Windows Event Trace."
             type="Microsoft.EnterpriseInstrumentation.EventSinks.TraceEventSink">
    <parameter name="sessionName" value="TraceSession" />
  </eventSink>
  <eventSink name="logSink"
             description="Outputs events to the event log."
             type="Microsoft.EnterpriseInstrumentation.EventSinks.LogEventSink">
    <parameter name="entryTypeFieldName" value="EventLogEntryTypeID" />
    <parameter name="defaultEntryType" value="Information" />
    <parameter name="machineName" value="." />
  </eventSink>
</eventSinks>
- Event Categories: Used to group messages (“Errors” or “Broken Rules” for example)
<eventCategories>
  <eventCategory name="All Events" description="A category for all events.">
    <event type="System.Object" />
  </eventCategory>
  <eventCategory> ... </eventCategory>
</eventCategories>
- Event Filters: Used to
bindevent categories to event sinks
<filters>
  <filter name="defaultSoftwareElementFilter" description="Software Element event sources.">
    <eventCategoryRef name="All Events">
      <eventSinkRef name="wmiSink" />
      <eventSinkRef name="traceSink" />
      <eventSinkRef name="logSink" />
    </eventCategoryRef>
  </filter>
  <filter name="defaultRequestFilter" description=" Request event sources.">
    <eventCategoryRef name="All Events">
      <eventSinkRef name="wmiSink" />
      <eventSinkRef name="traceSink" />
      <eventSinkRef name="logSink" />
    </eventCategoryRef>
  </filter>
</filters>
- Filter Bindings: used to
bindevent sources to event filters
<filterBindings>
  <eventSourceRef name="Application">
    <filterRef name="defaultSoftwareElementFilter" />
  </eventSourceRef>
</filterBindings>
This configuration file is generated and manipulated for us at design time by the EIF. You will undoubtedly want to modify this configuration file yourself and perhaps share a common config file across your application. In addition, you may want to leverage the configuration API provided by the EIF to expose the contents of this file to editing by the system administrators.
Now let's take a look at what our one line API call output to the event log. Figure 1 provides a graphical depiction of the trace message inside the event log. The contents of the message is:
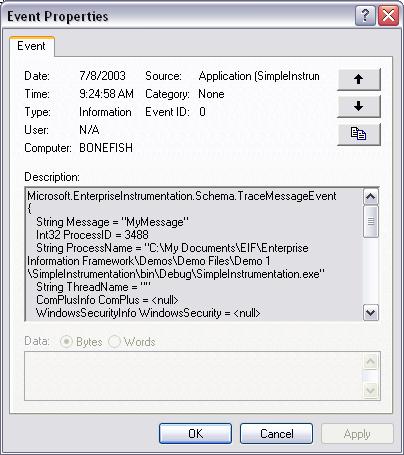
Microsoft.EnterpriseInstrumentation.Schema.TraceMessageEvent
{
   String Message = "MyMessage"
   Int32 ProcessID = 3488
   String ProcessName = "C:\My Documents\EIF\Enterprise Information Framework\Demos\Demo Files\Demo1\SimpleInstrumentation\bin\Debug\SimpleInstrumentation.exe"
   String ThreadName = ""
   ComPlusInfo ComPlus = <null>
   WindowsSecurityInfo WindowsSecurity = <null>
   ManagedSecurityInfo ManagedSecurity = <null>
   String StackTrace = ""
   String EventSourceInstance = "e03eb5ba-4c34-450d-aa84-8060ab056484"
   String EventSourceName = "Application"
   Int64 EventSequenceNumber = 1
   String EventSchemaVersion = "7.0.5000.0"
   DateTime TimeStamp = 7/8/2003 9:24:56 AM
   String AppDomainName = "SimpleInstrumentation.exe"
   String MachineName = "XXXXXX"
   String RootRequestName = ""
   String RootRequestInstance = ""
   String RequestInstance = ""
   String RequestName = ""
   Int64 RequestSequenceNumber = 0
   Int32 EventLogEntryTypeID = 4
}
You start to get a feel for the power of the EIF by examining the details of this output. EIF's default event schema controls the contents of this message. Event schemas define the messages (or events) that an application can raise. These schemas act as the contract between those responsible for raising events and those responsible for reading events. That is, these events have to be published and well-known to all consumers. You can use the default event schemas that ship with the EIF (errors, audits, administrative, diagnostic) or you can code custom event schemas using the standard schemas as a basis.
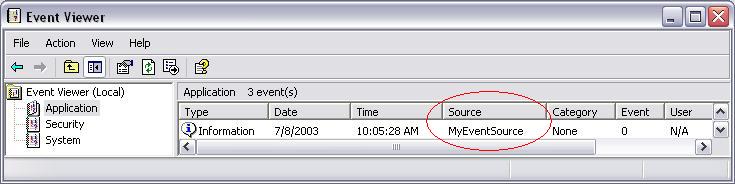
A Custom Event Source
In the previous example, you may have noticed that the event source name was simply “Application.” This is the implicit event source that gets used when calling the Raise method. However, if you want to filter and group related messages, you will want to explicitly define your event sources.
What we have now is a separate API for every event store. What we need is a common approach to instrumenting code while targeting all existing event stores
(WMI,event log, text file, etc.) and all neweventstores.
Thankfully, it is not difficult to create a custom event source with the EIF. You simply declare an EventSource type as in the following class-level declaration:
private static EventSource myEventSource = new EventSource("MyEventSource");
Next, to use this explicit event source, you simply call an overload of the Raise method that you used previously.
TraceMessageEvent.Raise(myEventSource, "MyMessage");
Figure 2 illustrates the results.
EIF Key Namespaces and Classes
You've seen the basics of the API, which, as promised, is very simple. The EIF, however, offers a rich set of classes for managing all things related to tracing. This article won't cover all of the details, but we want to make sure you know what is available. To that end, Table 1 shows some of the detail of this library.
This is by no means the full extent of this rich library. We'll leave the rest for you to discover on your own.
Request-Based Event Tracing
Your support team (or end users) will not know the intricate details of your application (as in its classes/types, methods, etc.). Therefore, the typical trace message may have little meaning to them. However, your users are well-aware of the services your application provides. For instance, they know your application allows them to “Edit a Customer” or “Submit a Purchase Order”, etc. By knowing only these services of your application, the support organization should be able to turn on diagnostic information based on these contextual elements. In addition, your application should be able to trace a business process, request, or transaction from start to finish as one message (or set of messages).
To accomplish this feat, the EIF provides request-based event tracing. This is truly one of the most exciting elements of the EIF. With request-based event tracing, you can wrap trace events into a single context which, in turn, maps to a business process flow in your application. This context can then be consumed by tools that correlate messages at the request level. You can easily create a tool that shows all failed requests to add a new order. EIF's output event tracing would let you drill into the failed requests to provide full details of the failure regardless of the number of method calls involved (or cross-process calls for that matter).
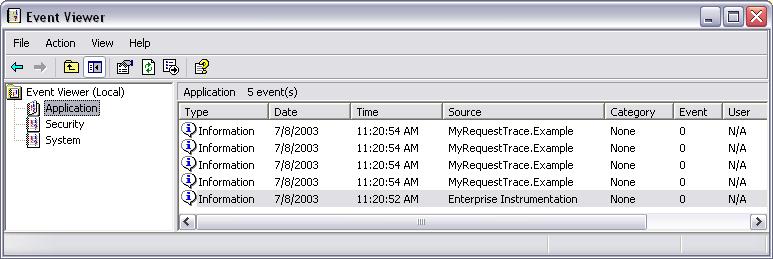
You can easily implement your own request-based event tracing. First, create an instance of the RequestTrace class. Constructing this class implicitly starts the request trace (you do not make a call to a Start method). All trace messages raised once the RequestTrace class has been created are wrapped inside this request context. That's it! Even calls to methods that knew nothing of this context at design time will see their TraceMessageEvent.Raise calls get automatically wrapped into this context. To close the context (or end the request) you simply call the Dispose method of the RequestTrace class. An example of this is provided inside of Listing 1.
Listing 1: Request-based event tracing
using System;
using System.ComponentModel;
using Microsoft.EnterpriseInstrumentation;
using Microsoft.EnterpriseInstrumentation.Schema;
using Microsoft.EnterpriseInstrumentation.RequestTracing;

namespace SimpleInstrumentation
{

  [RunInstaller(true)]
  public class MyProjectInstaller : ProjectInstaller {}

  public class EventSources
  {

    //delcare a custome event source
    private static RequestEventSource myReqEventSource = new RequestEventSource("MyRequestTrace.Example");

    [STAThread]
    static void Main(string[] args)
    {
      //start the request
      RequestTrace firstRequest = new RequestTrace(myReqEventSource);

      try
      {
        //do work ...

        //raise trace message
        TraceMessageEvent.Raise("MyFirstTraceMessage");

        DoMoreWork();
      }
      finally
      {
        //end the request
        firstRequest.Dispose();
      }

      Console.WriteLine("Done");
      Console.ReadLine();
    }

    static void DoMoreWork()
    {
      //do more work ...

      //raise trace message
      TraceMessageEvent.Raise("MySecondTraceMessage");
    }
  }
}
At runtime, each event is tagged with the request context and the request sequence number, giving you the ability to correlate the messages as a logical unit (by writing or purchasing a tool). Figure 3 illustrates these messages grouped together inside the event log.
Event Tracing in Distributed Environments
An enterprise application these days spans multiple layers and it is likely that some of these layers will be on physically-separate machines or even geo-graphically distributed. Request-based tracing takes this into account because the RequestTrace class can have its context flow across machine boundaries.
With Request-based event tracing, you can wrap trace events into a single context (which maps to a business process flow in your application)… This is truly one the most exciting elements of the EIF.
To do so, request tracing implements .NET's Remoting infrastructure. Information about a request is stored in the LogicalCallContext class which flows along the path of execution?crossing context, application, process, and machine boundaries. It is therefore particularly suitable for storing information about a request.
However, the use of the remoting infrastructure limits the cross-boundary requests to managed code. Access to native code and Web services currently does not support the LogicalCallContext class and thus request-based tracing will not work in these scenarios.
In addition, as requests flow across each machine, each event that is raised will log to a local trace log. Therefore, a request that spans three machines will have its messages spanning the same three machines. What you will need is a means to aggregated and analyze these requests in one place (perhaps SQL Server).
Summary
The EIF is simple but powerful. Using the EIF, you can group trace messages to form a logical unit that maps back to an actual business process your administrators and users can understand. Use the EIF to keep your application running smoothly and keep you writing code rather than troubleshooting production snafus.
Table 1: Important details in the EIF
| Assembly | Class Functionality |
|---|---|
| Microsoft.EnterpriseInstrumentation: Provides the basis for raising trace messages | |
| EventSource: provides class for managing event sources (TraceMessageEvent for example) | |
| ProjectInstaller: provides methods to install instrumented assemblies | |
| Microsoft.EnterpriseInstrumentation. EventSinks: Provides the standard event sinks | |
| TraceEventSink: provides a trace `log` event sink | |
| LogEventSink: provides an event log sink | |
| WmiEventSink: provides a WMI event sink | |
| Microsoft.EnterpriseInstrumentation. Readers: Provides classes for reading the trace logs | |
| Microsoft.EnterpriseInstrumentation.Schema: Provides the standard event schemas used when raising trace messages | |
| Microsoft.EnterpriseInstrumentation.Configuration: Provides classes and methods used to manage EIF configuration files |